Roto Pumps Limited
ROTO NSE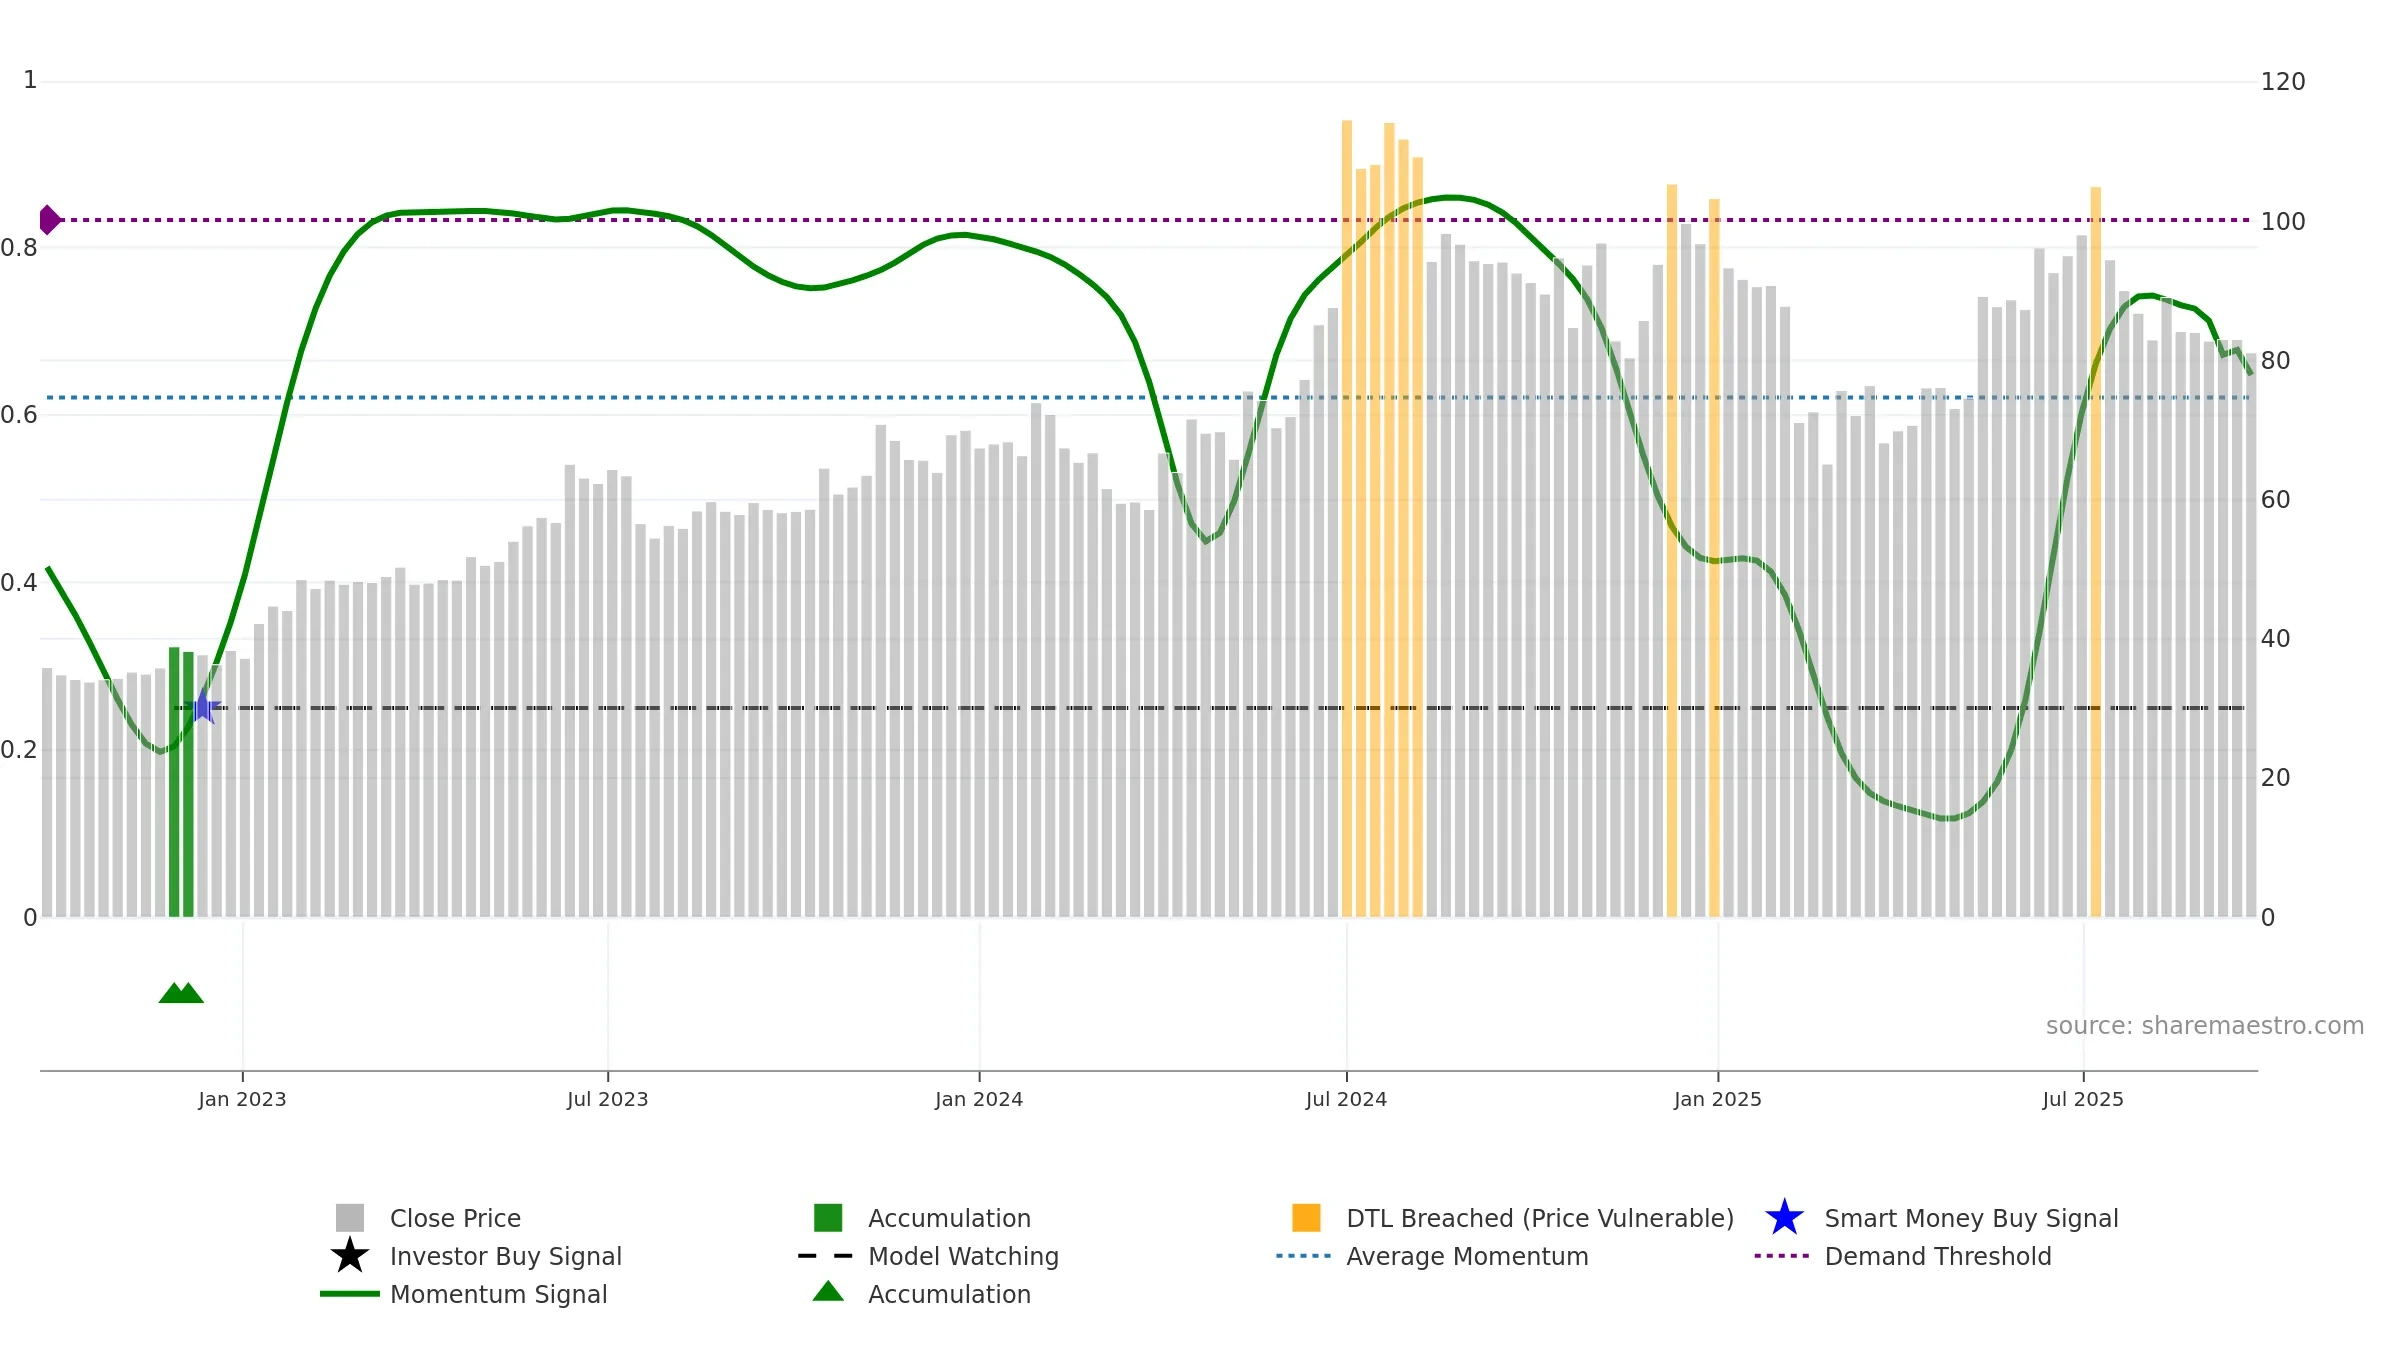
Weekly Report
Roto Pumps Limited closed at 81.1000 (-2.29% WoW) . Data window ends Mon, 22 Sep 2025.
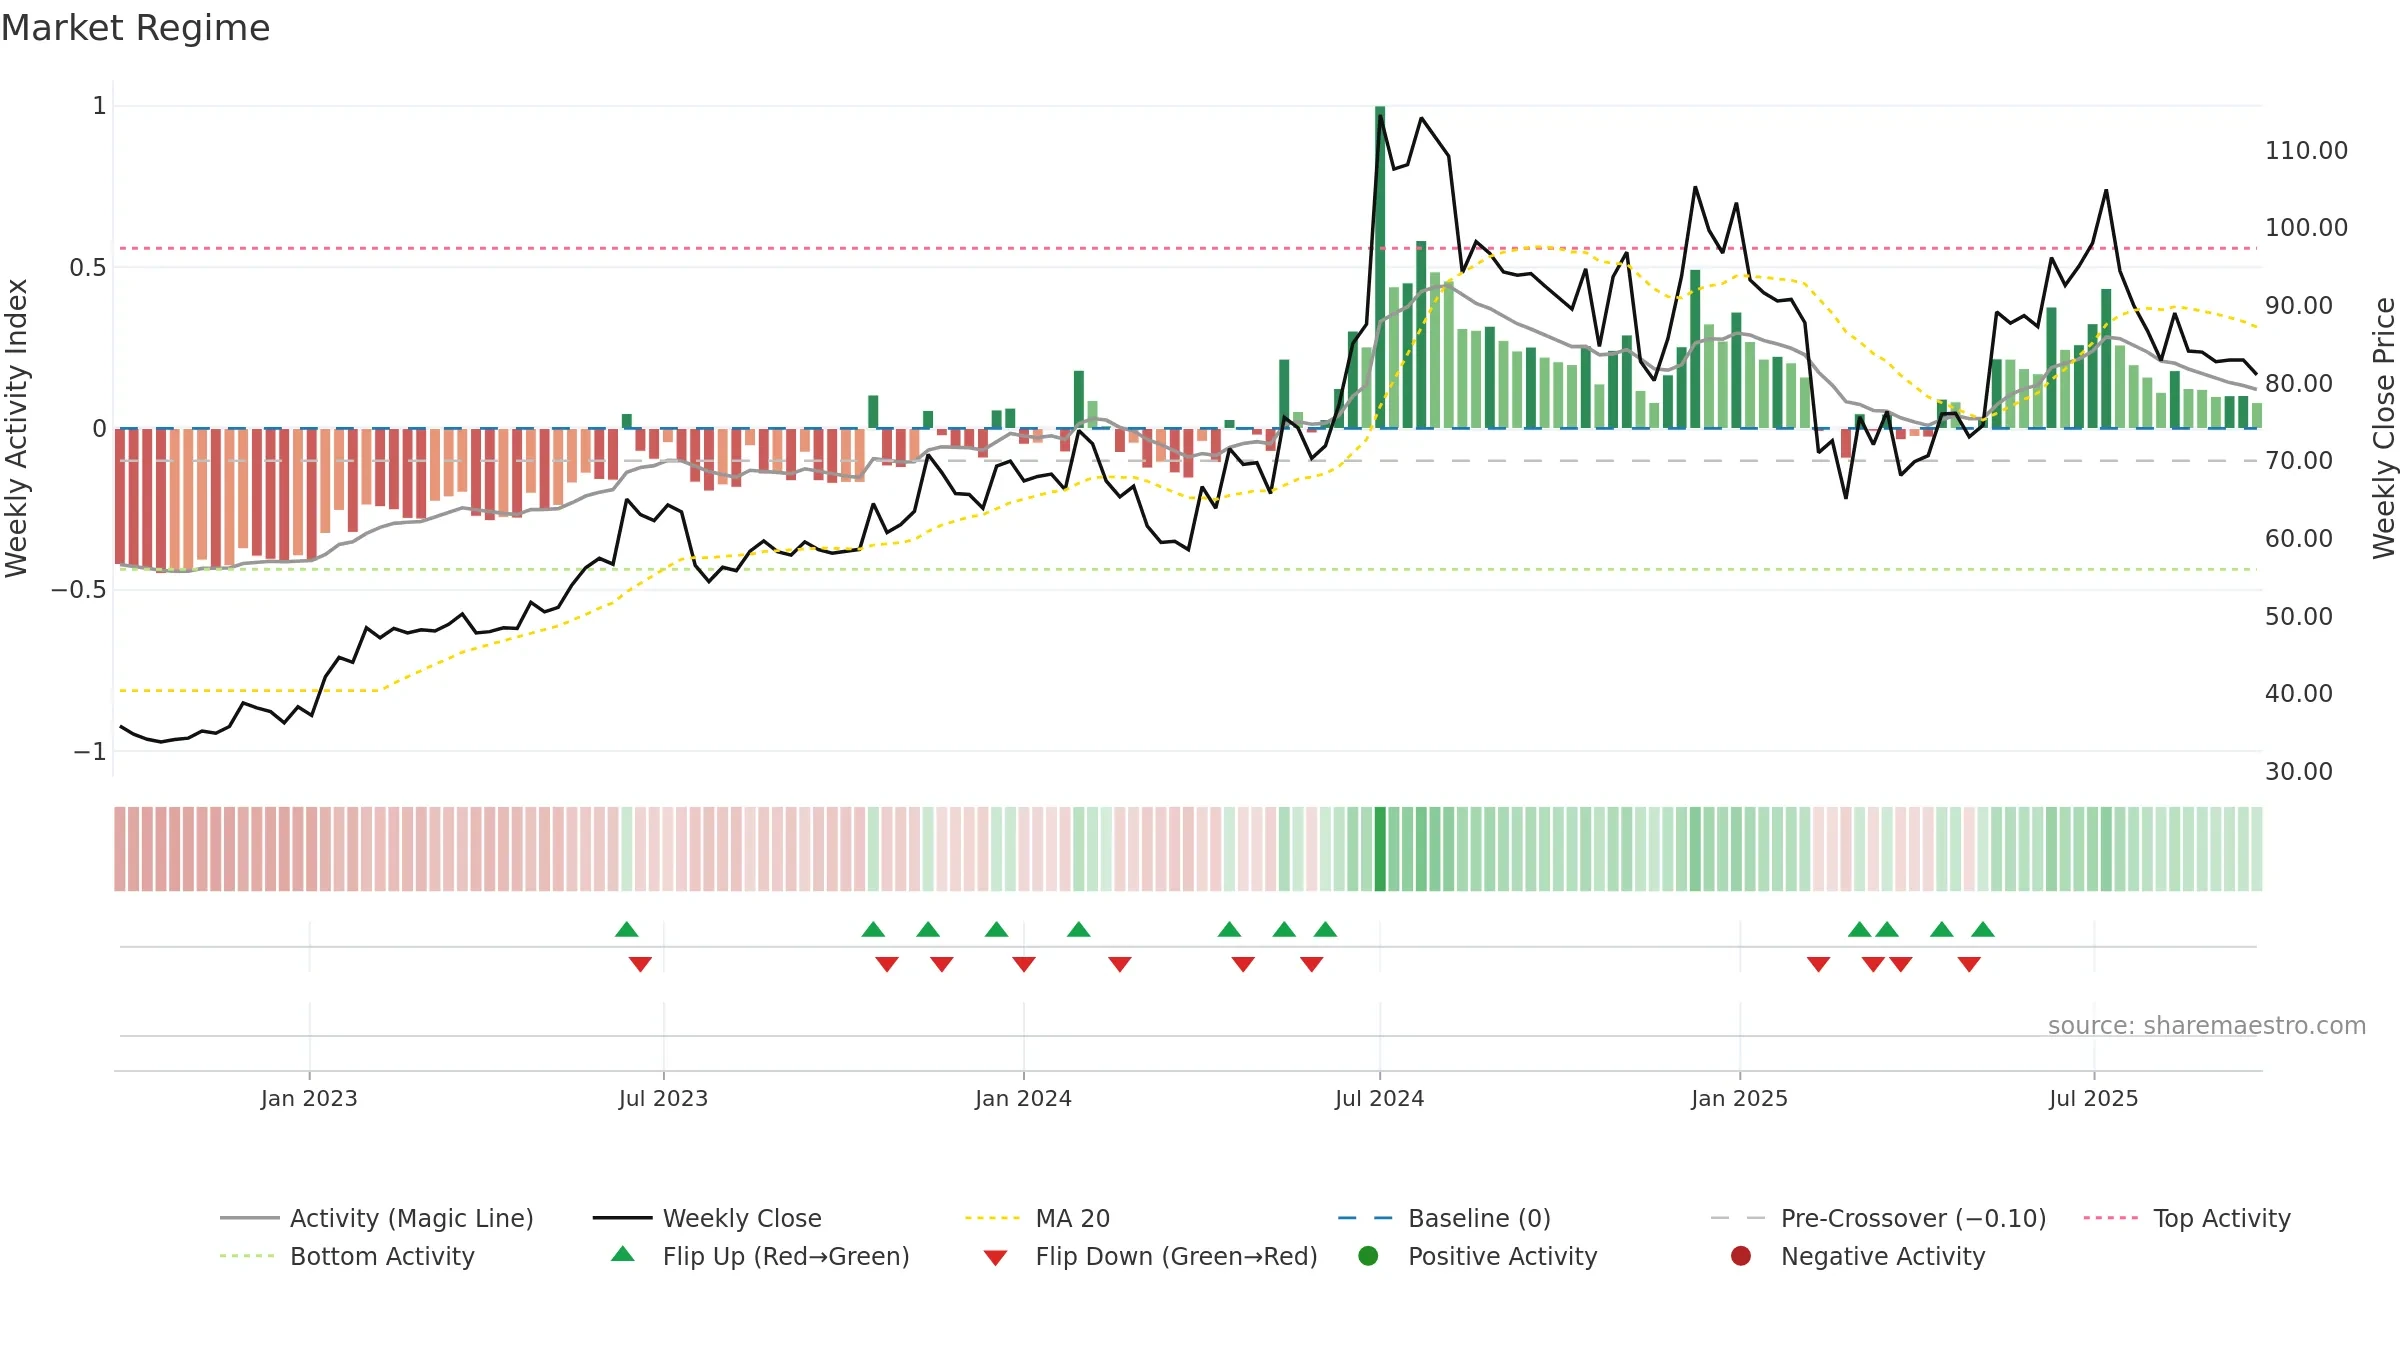
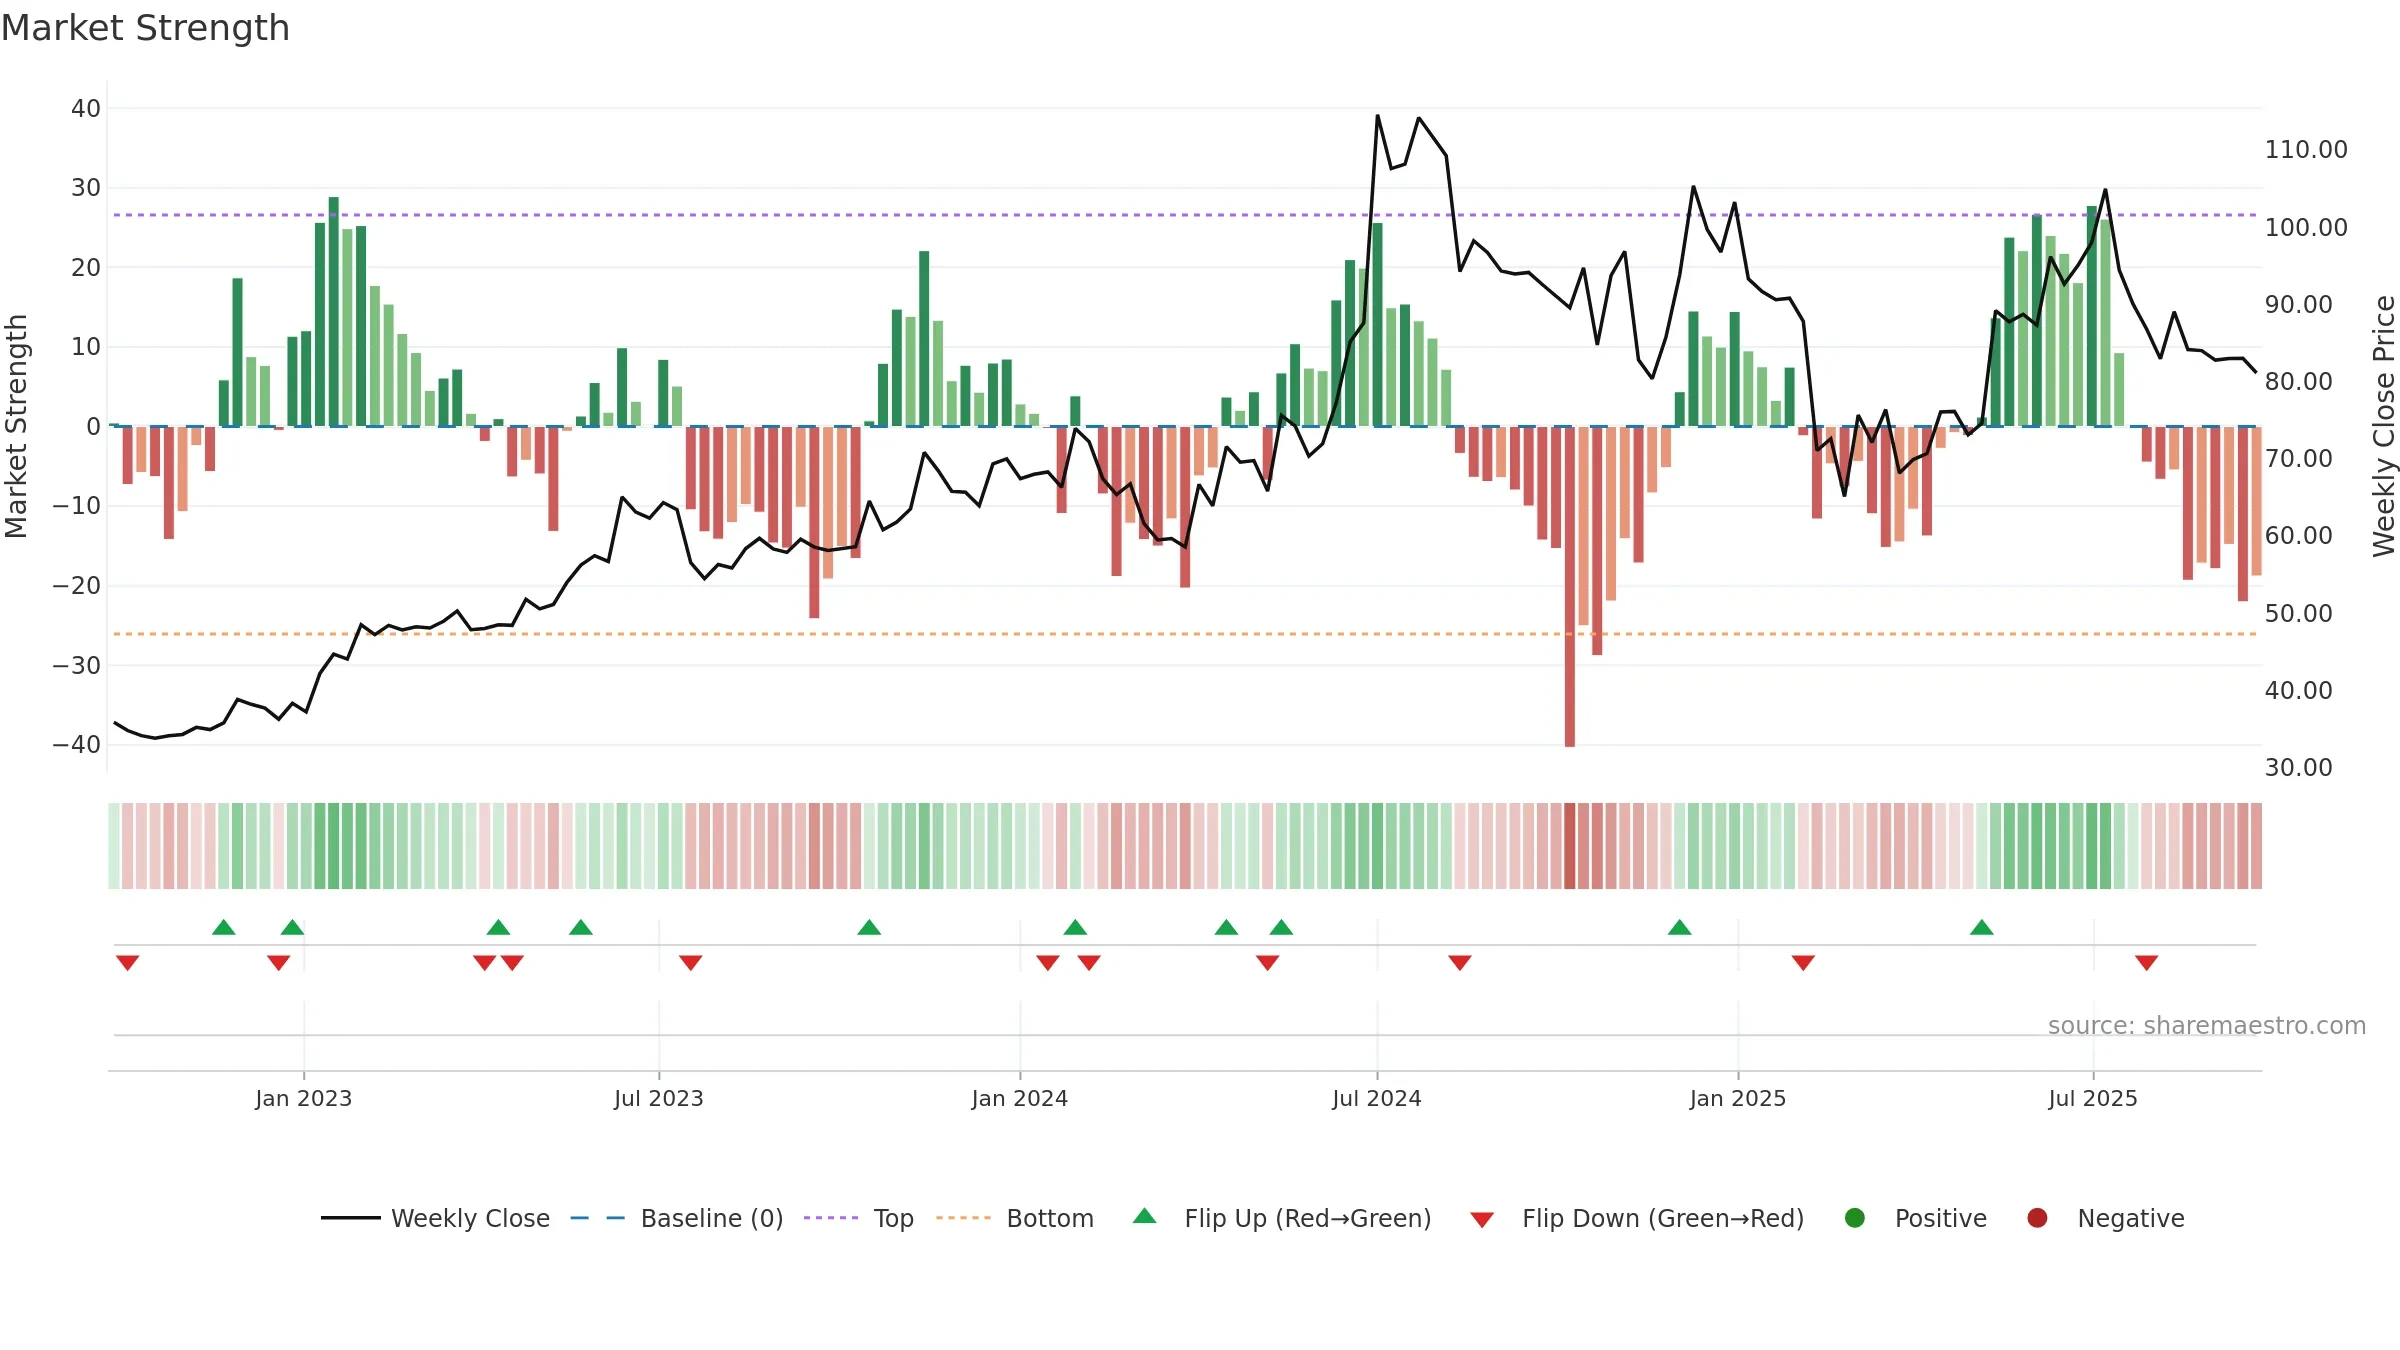
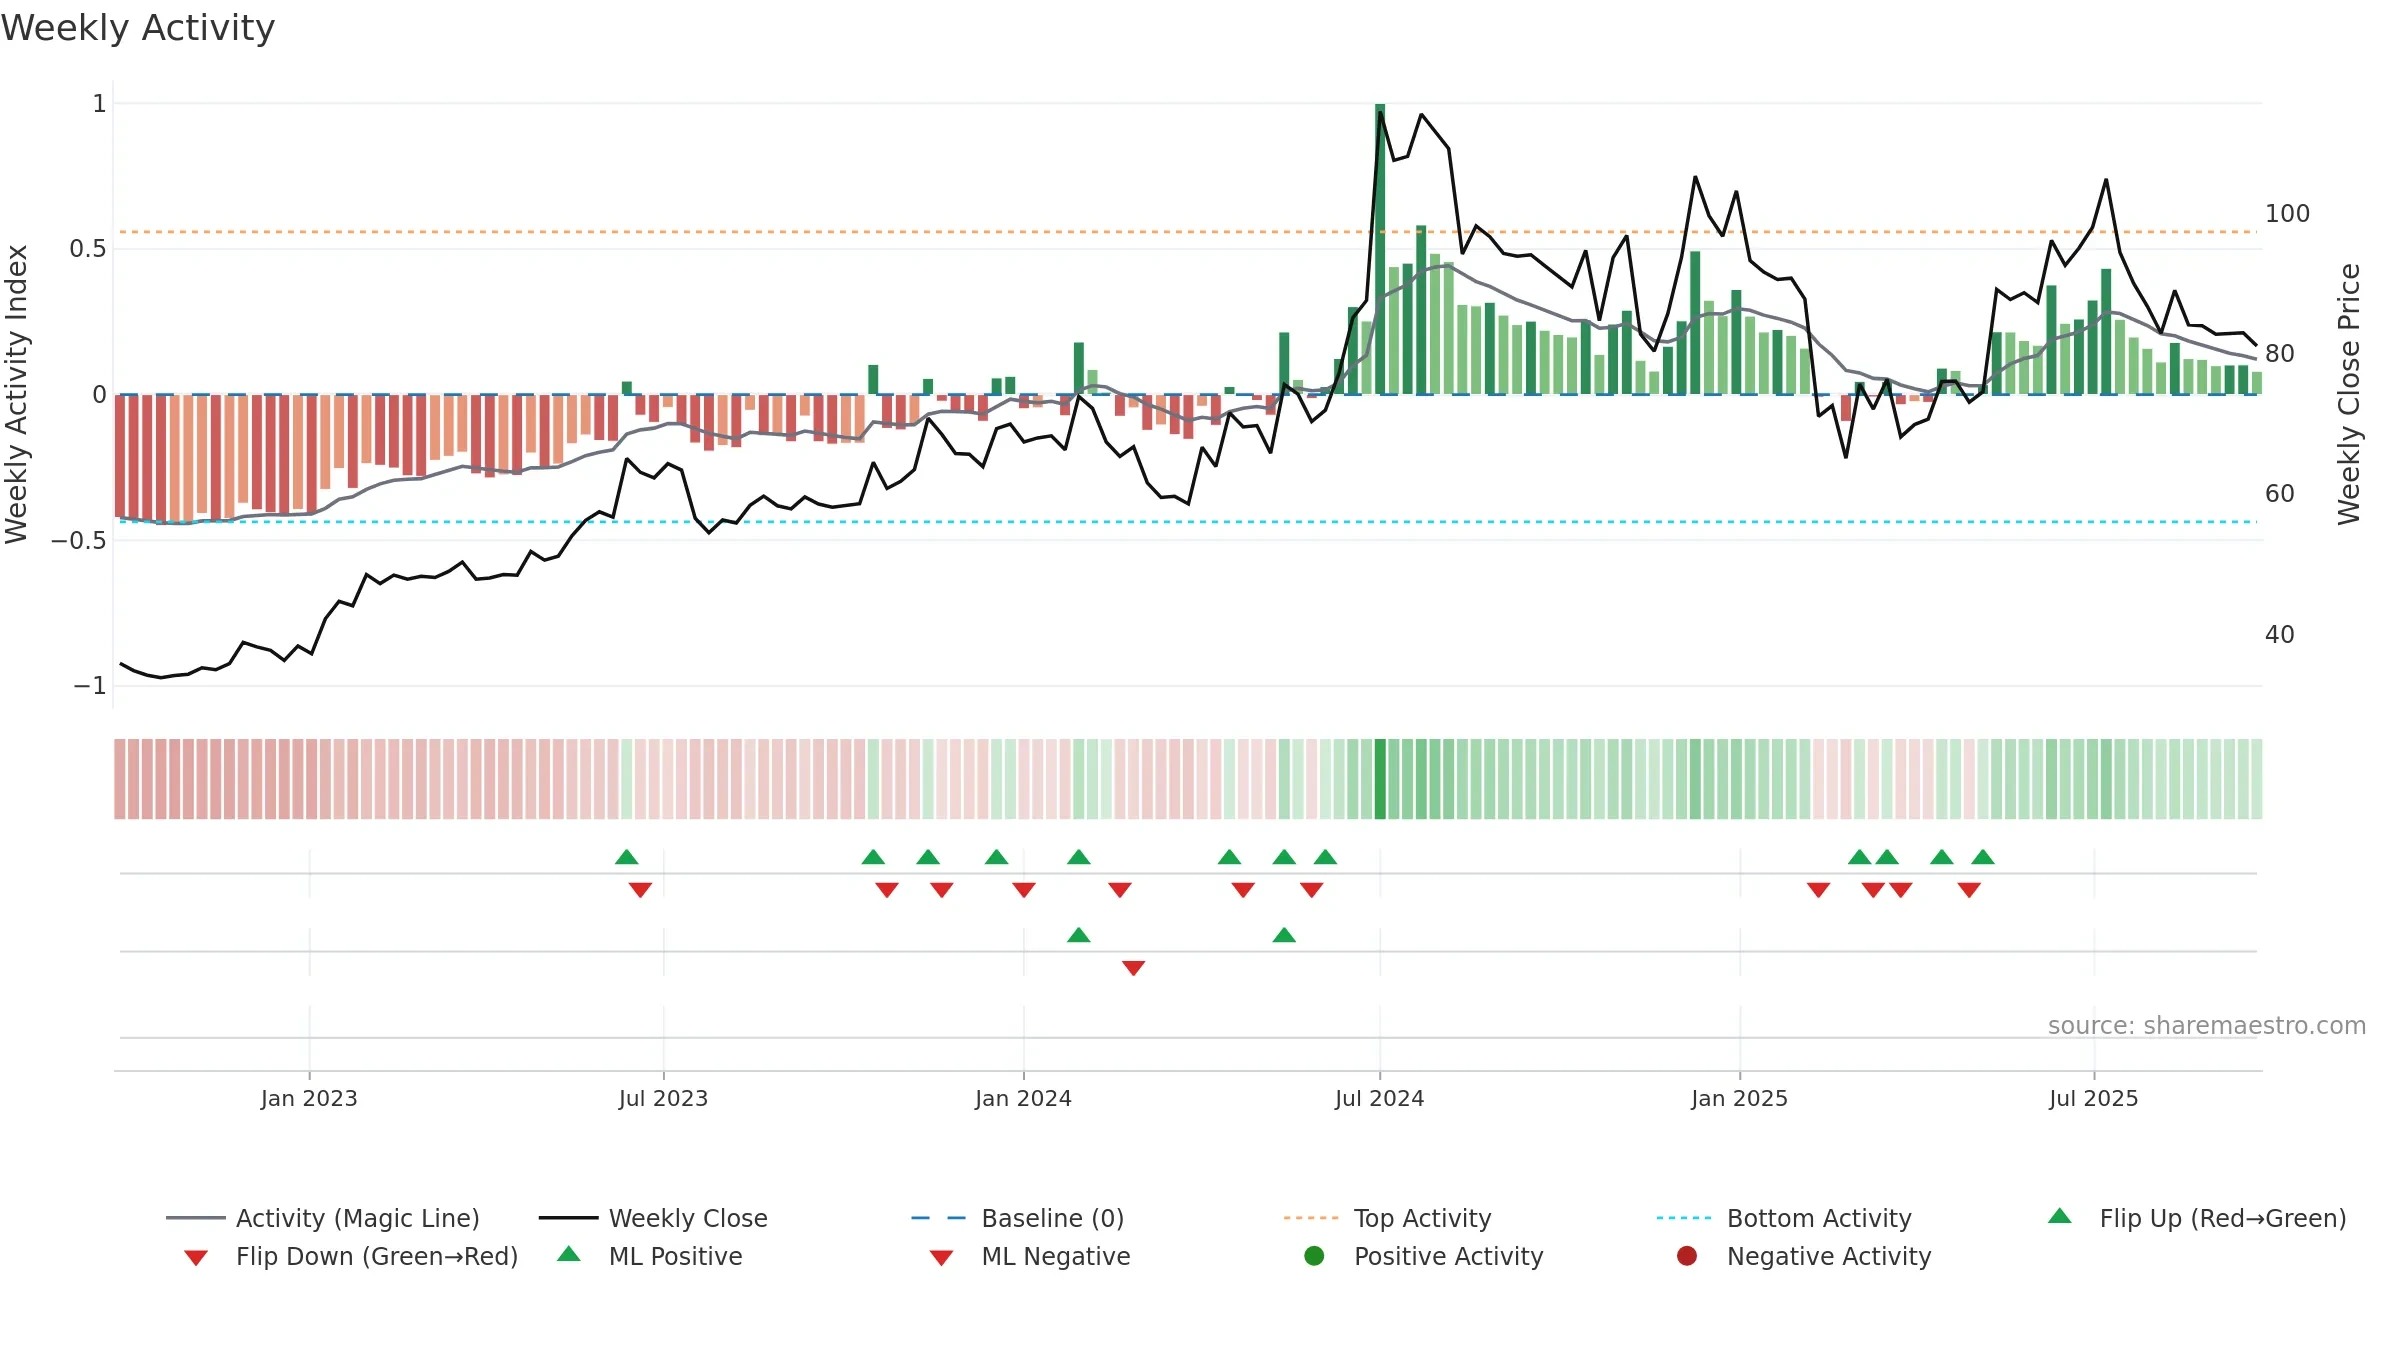
How to read this — Price slope is downward, indicating persistent supply pressure. Volume and price are moving in the same direction — a constructive confirmation. Returns are positively correlated with volume — strength tends to arrive on higher activity. Distance to baseline is narrowing — reverting closer to its fair-value track. Price sits below key averages, keeping pressure on the tape.
Down-slope argues for patience; rallies can fade sooner unless participation improves.
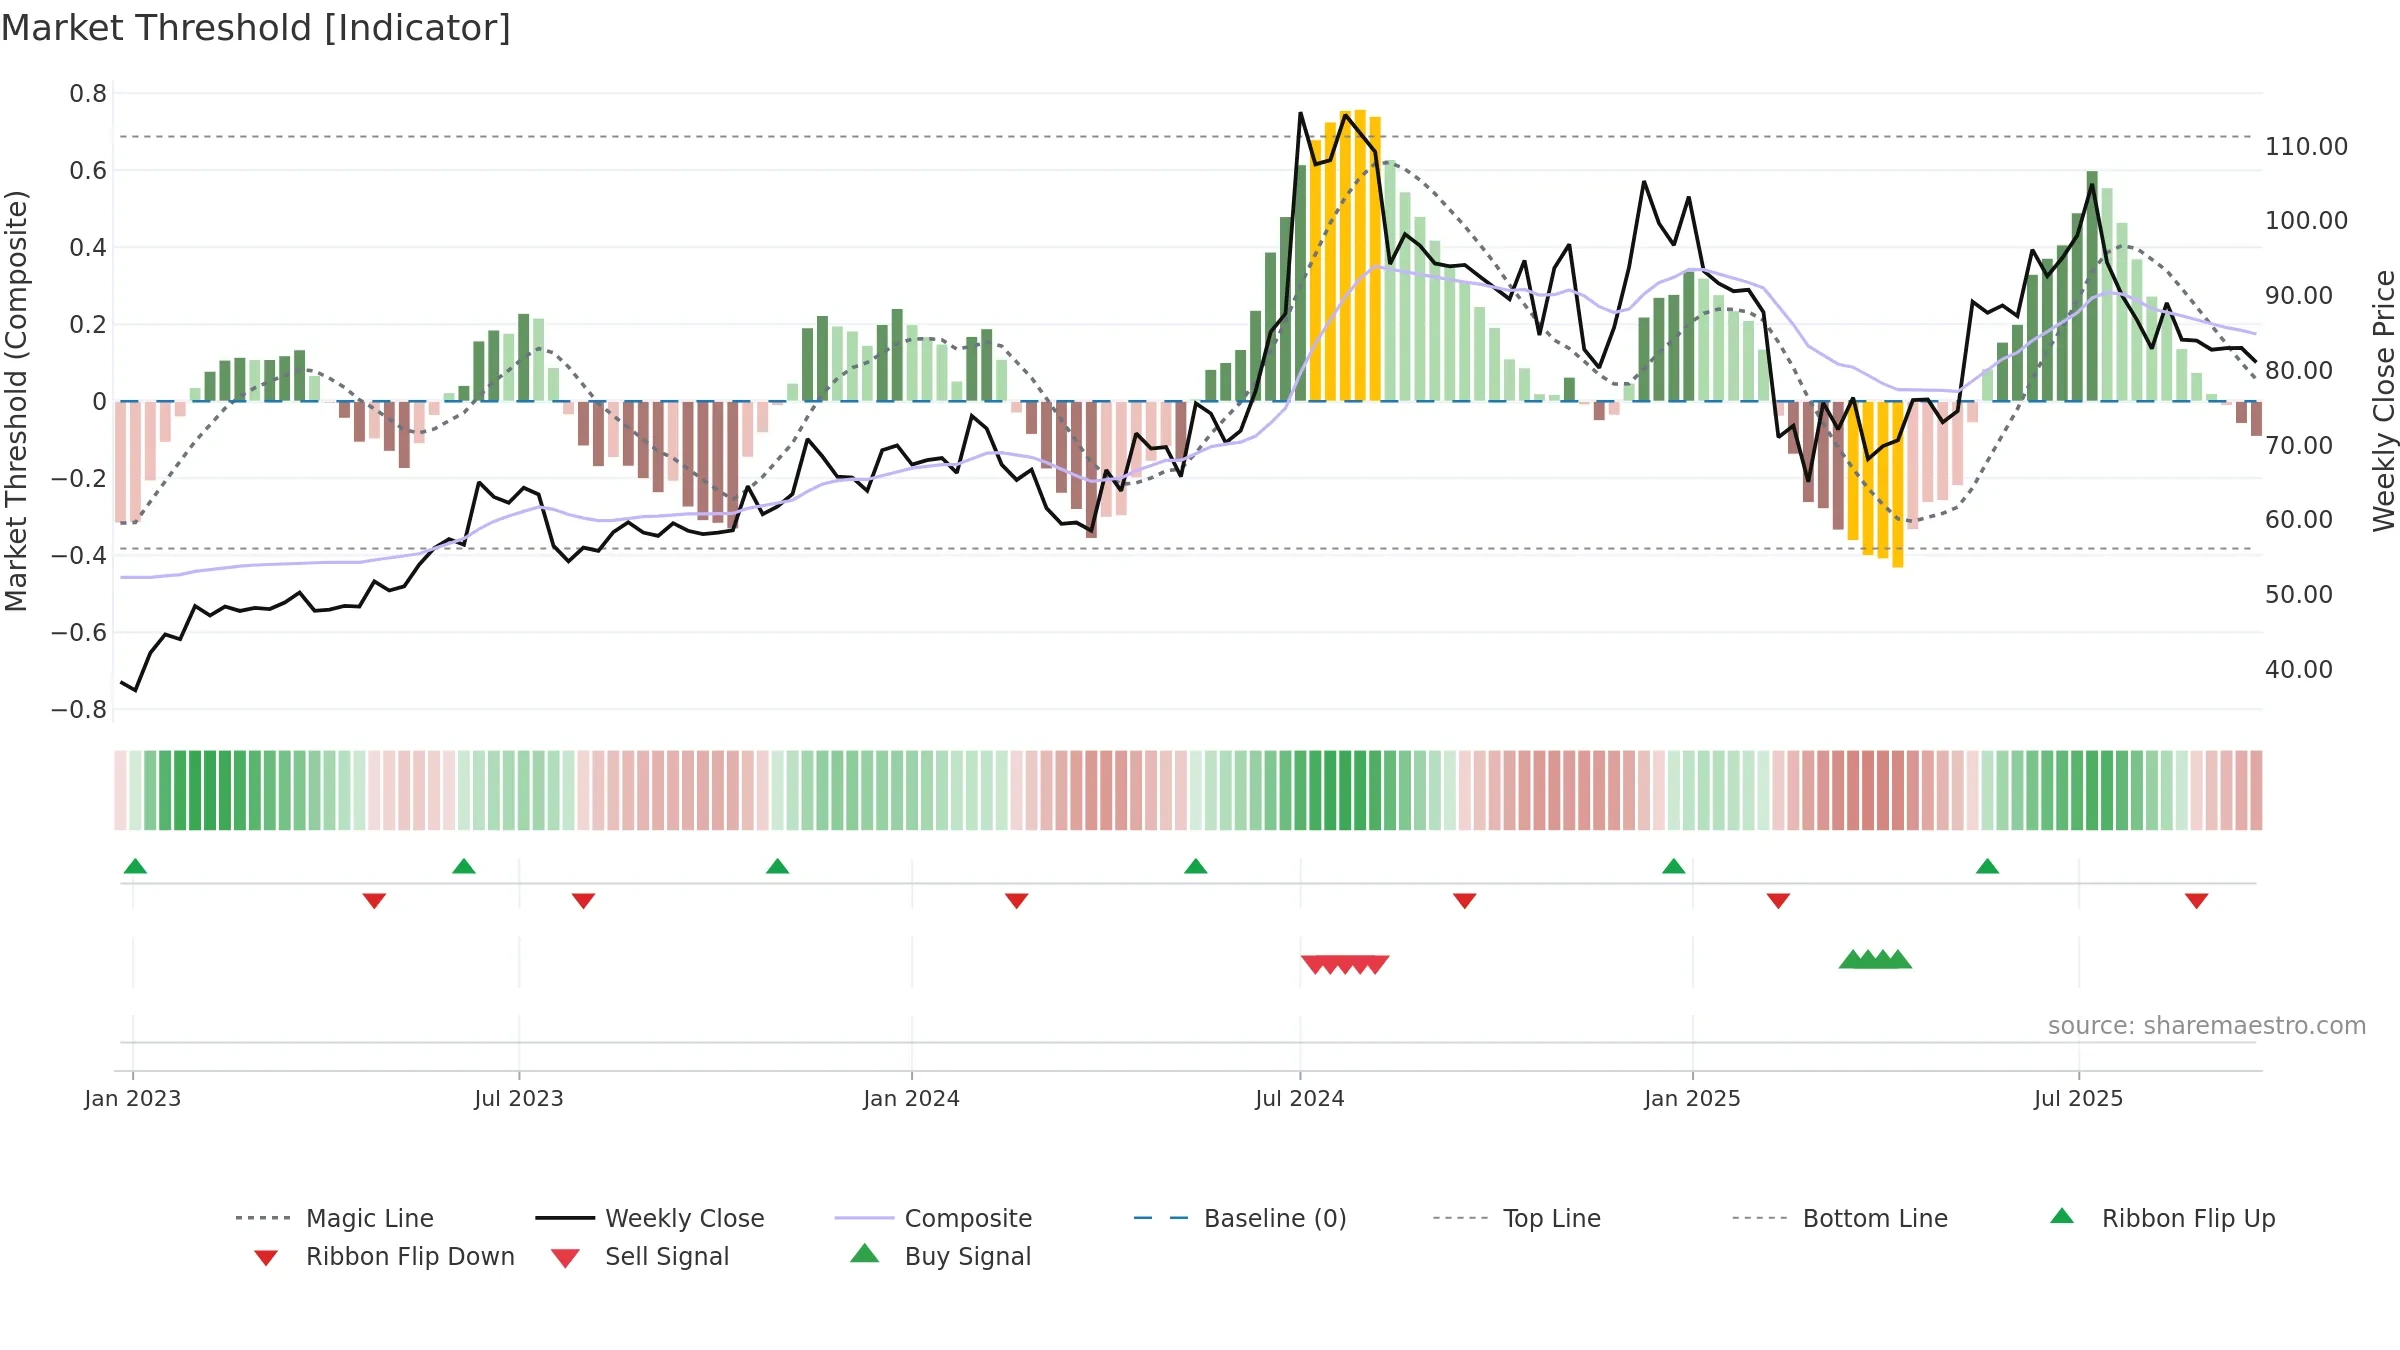
Gauge maps the trend signal to a 0–100 scale.
How to read this — Gauge is elevated but momentum is rolling over; topping risk is rising.
Stay alert: protect gains or seek confirmation before adding risk.
Price is above fair value; upside may be capped without catalysts.
Conclusion
Negative setup. ★★☆☆☆ confidence. Price window: -2. Trend: Uptrend at Risk; gauge 64. In combination, liquidity confirms the move.
- Liquidity confirms the price trend
- High-level but rolling over (topping risk)
- Momentum is weak/falling
- Price is not above key averages
- Negative multi-week performance
Why: Price window -2.22% over 8w. Close is -8.93% below the prior-window high. Volume trend falling. Liquidity convergence with price. Trend state uptrend at risk. Momentum neutral and falling. Valuation limited upside without catalysts.
Tip: Most metrics include a hover tooltip where they appear in the report.