Eden Research plc
EDEN LSE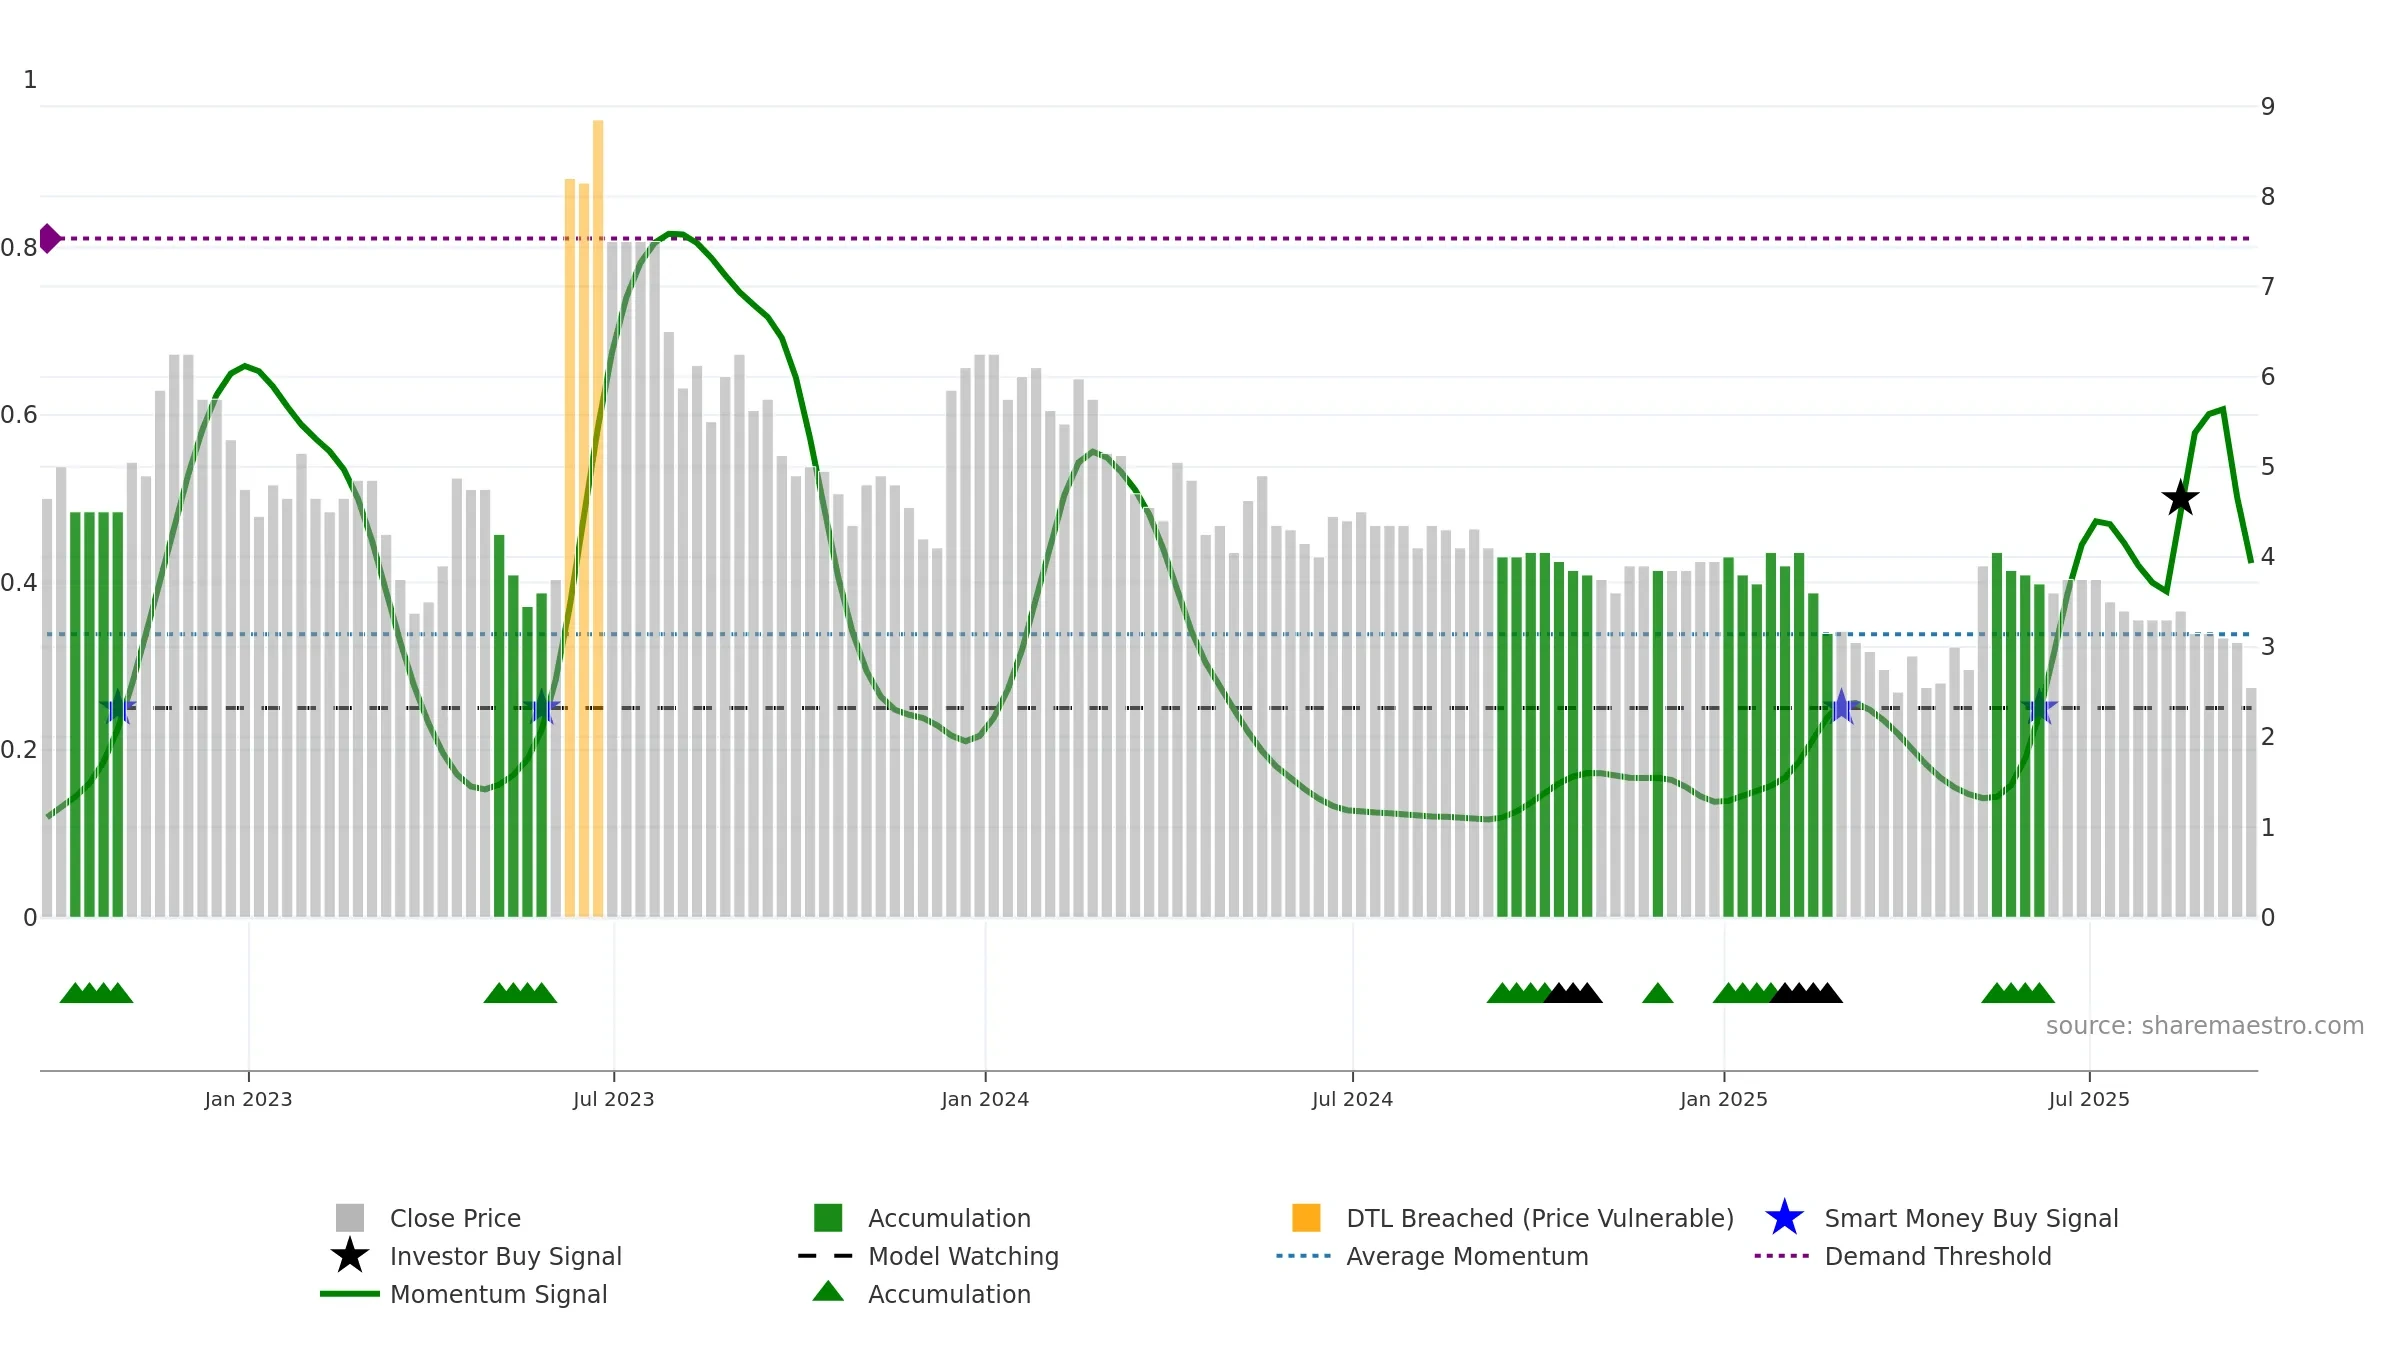
Weekly Report
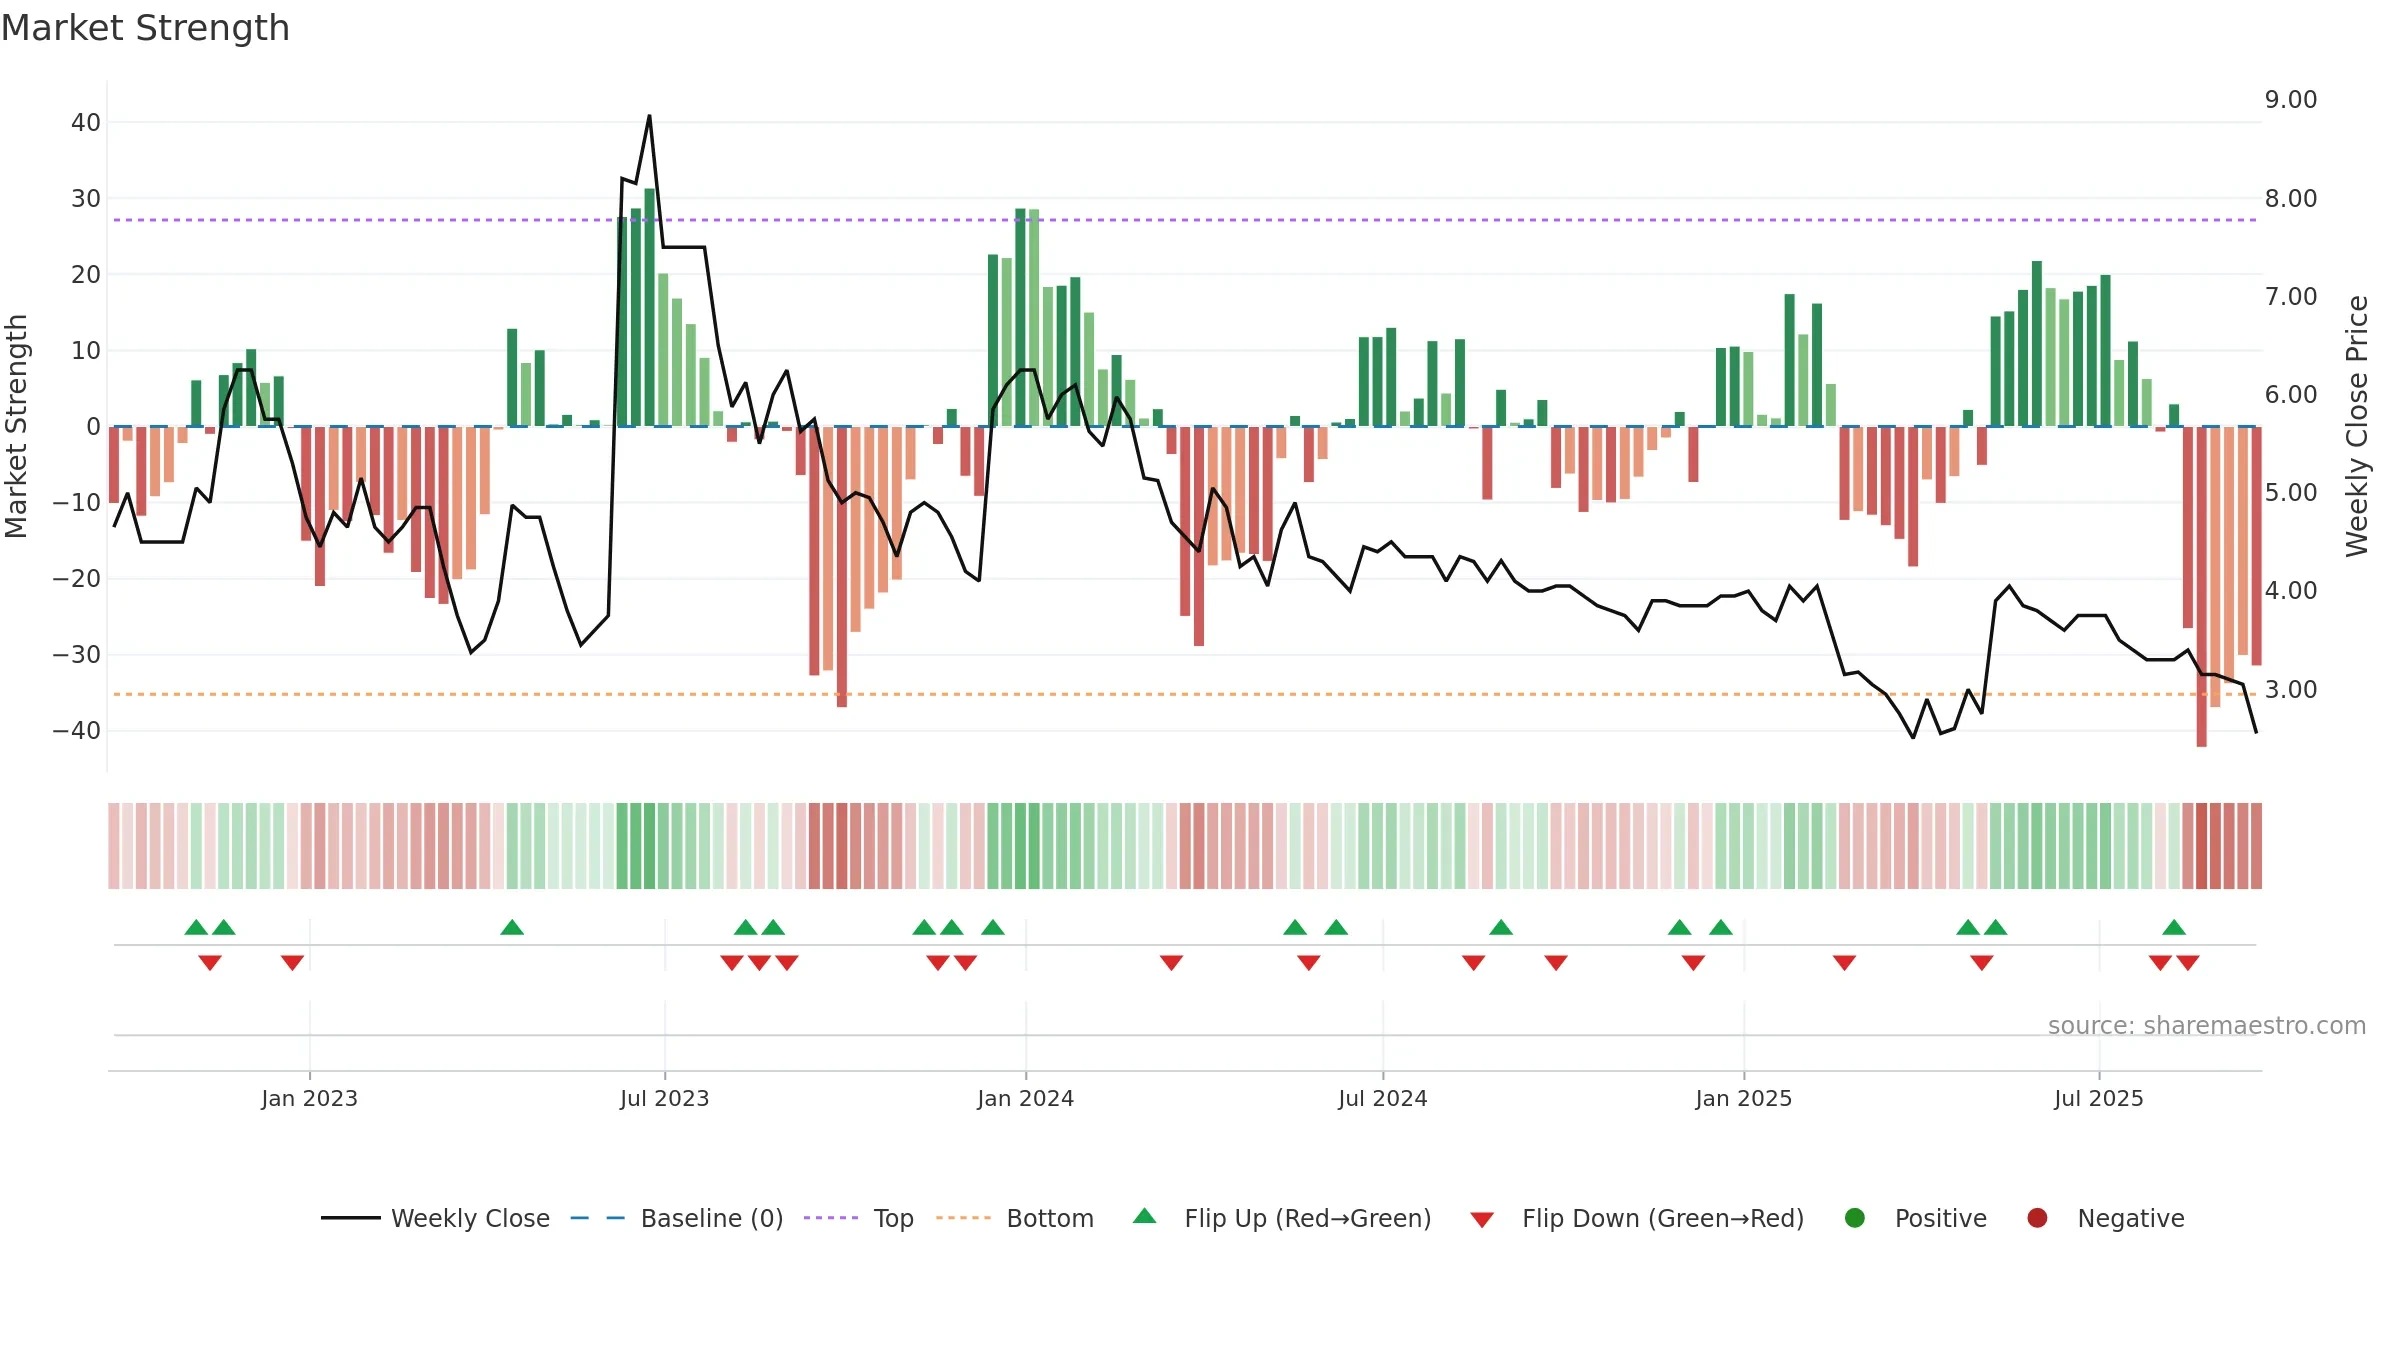
Eden Research plc closed at 2.5500 (-8.93% WoW) . Data window ends Fri, 19 Sep 2025.
How to read this — Price slope is downward, indicating persistent supply pressure. Volume trend diverges from price — watch for fatigue or rotation. Returns are negatively correlated with volume — strength may come on lighter activity. Weak MA stack argues for caution; rallies can fail near the 8–13 week region. Price sits below key averages, keeping pressure on the tape.
Down-slope argues for patience; rallies can fade sooner unless participation improves. Because liquidity isn’t confirming, prefer evidence of fresh demand before chasing moves.
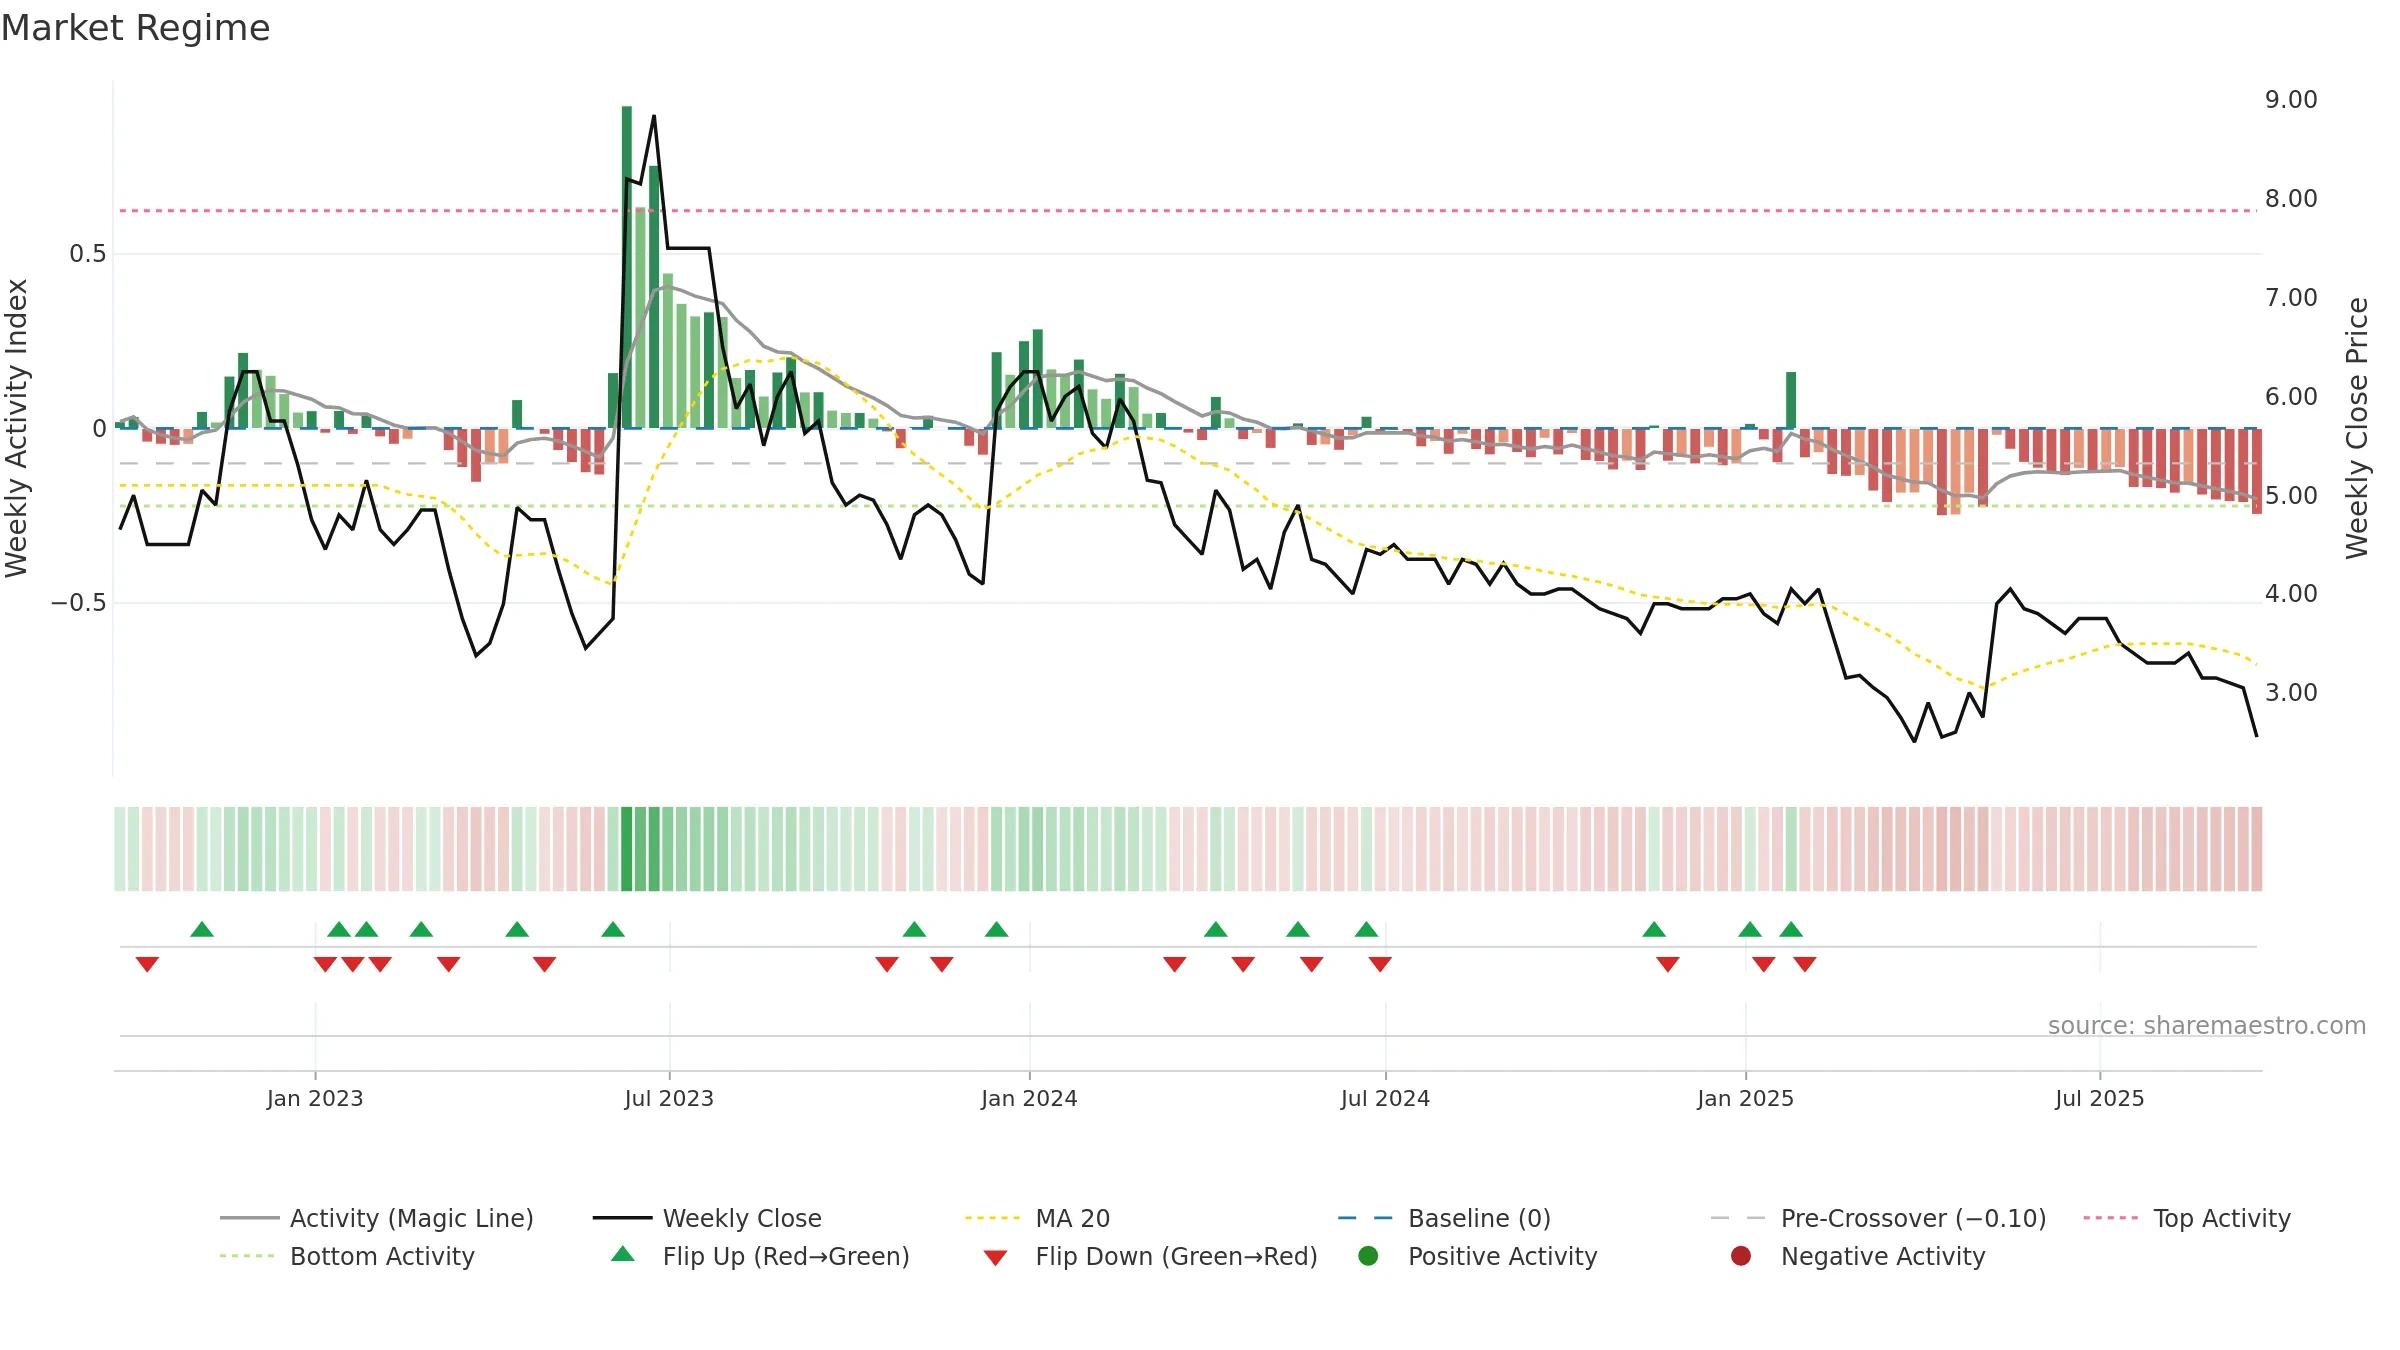
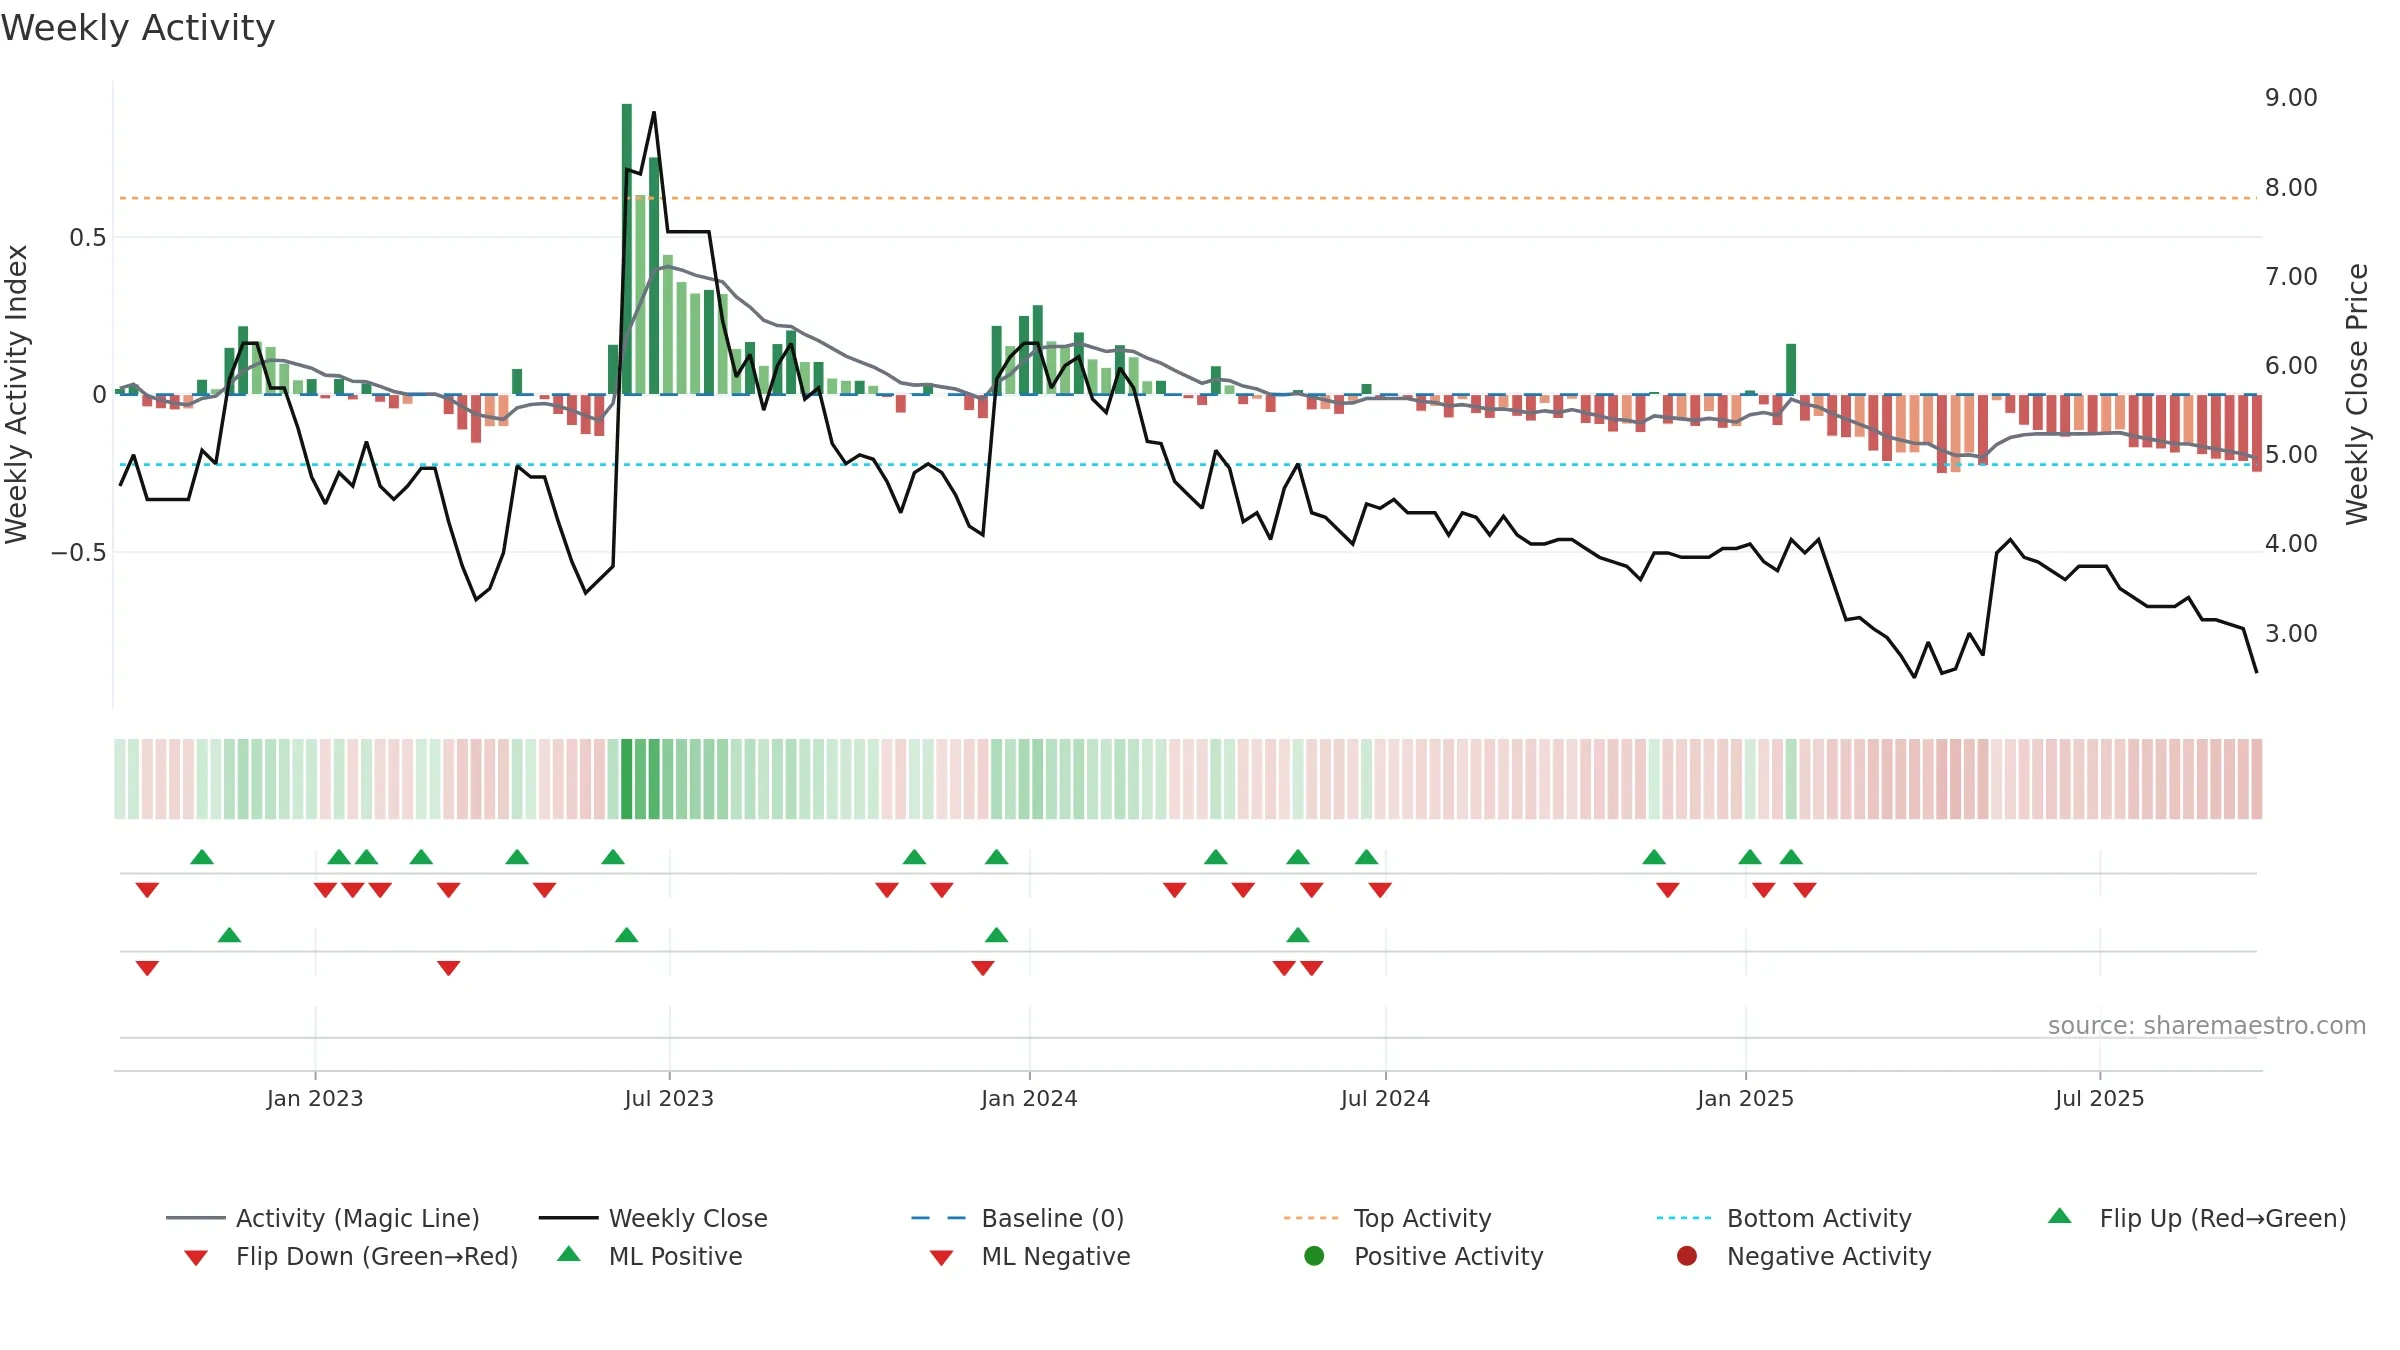
Gauge maps the trend signal to a 0–100 scale.
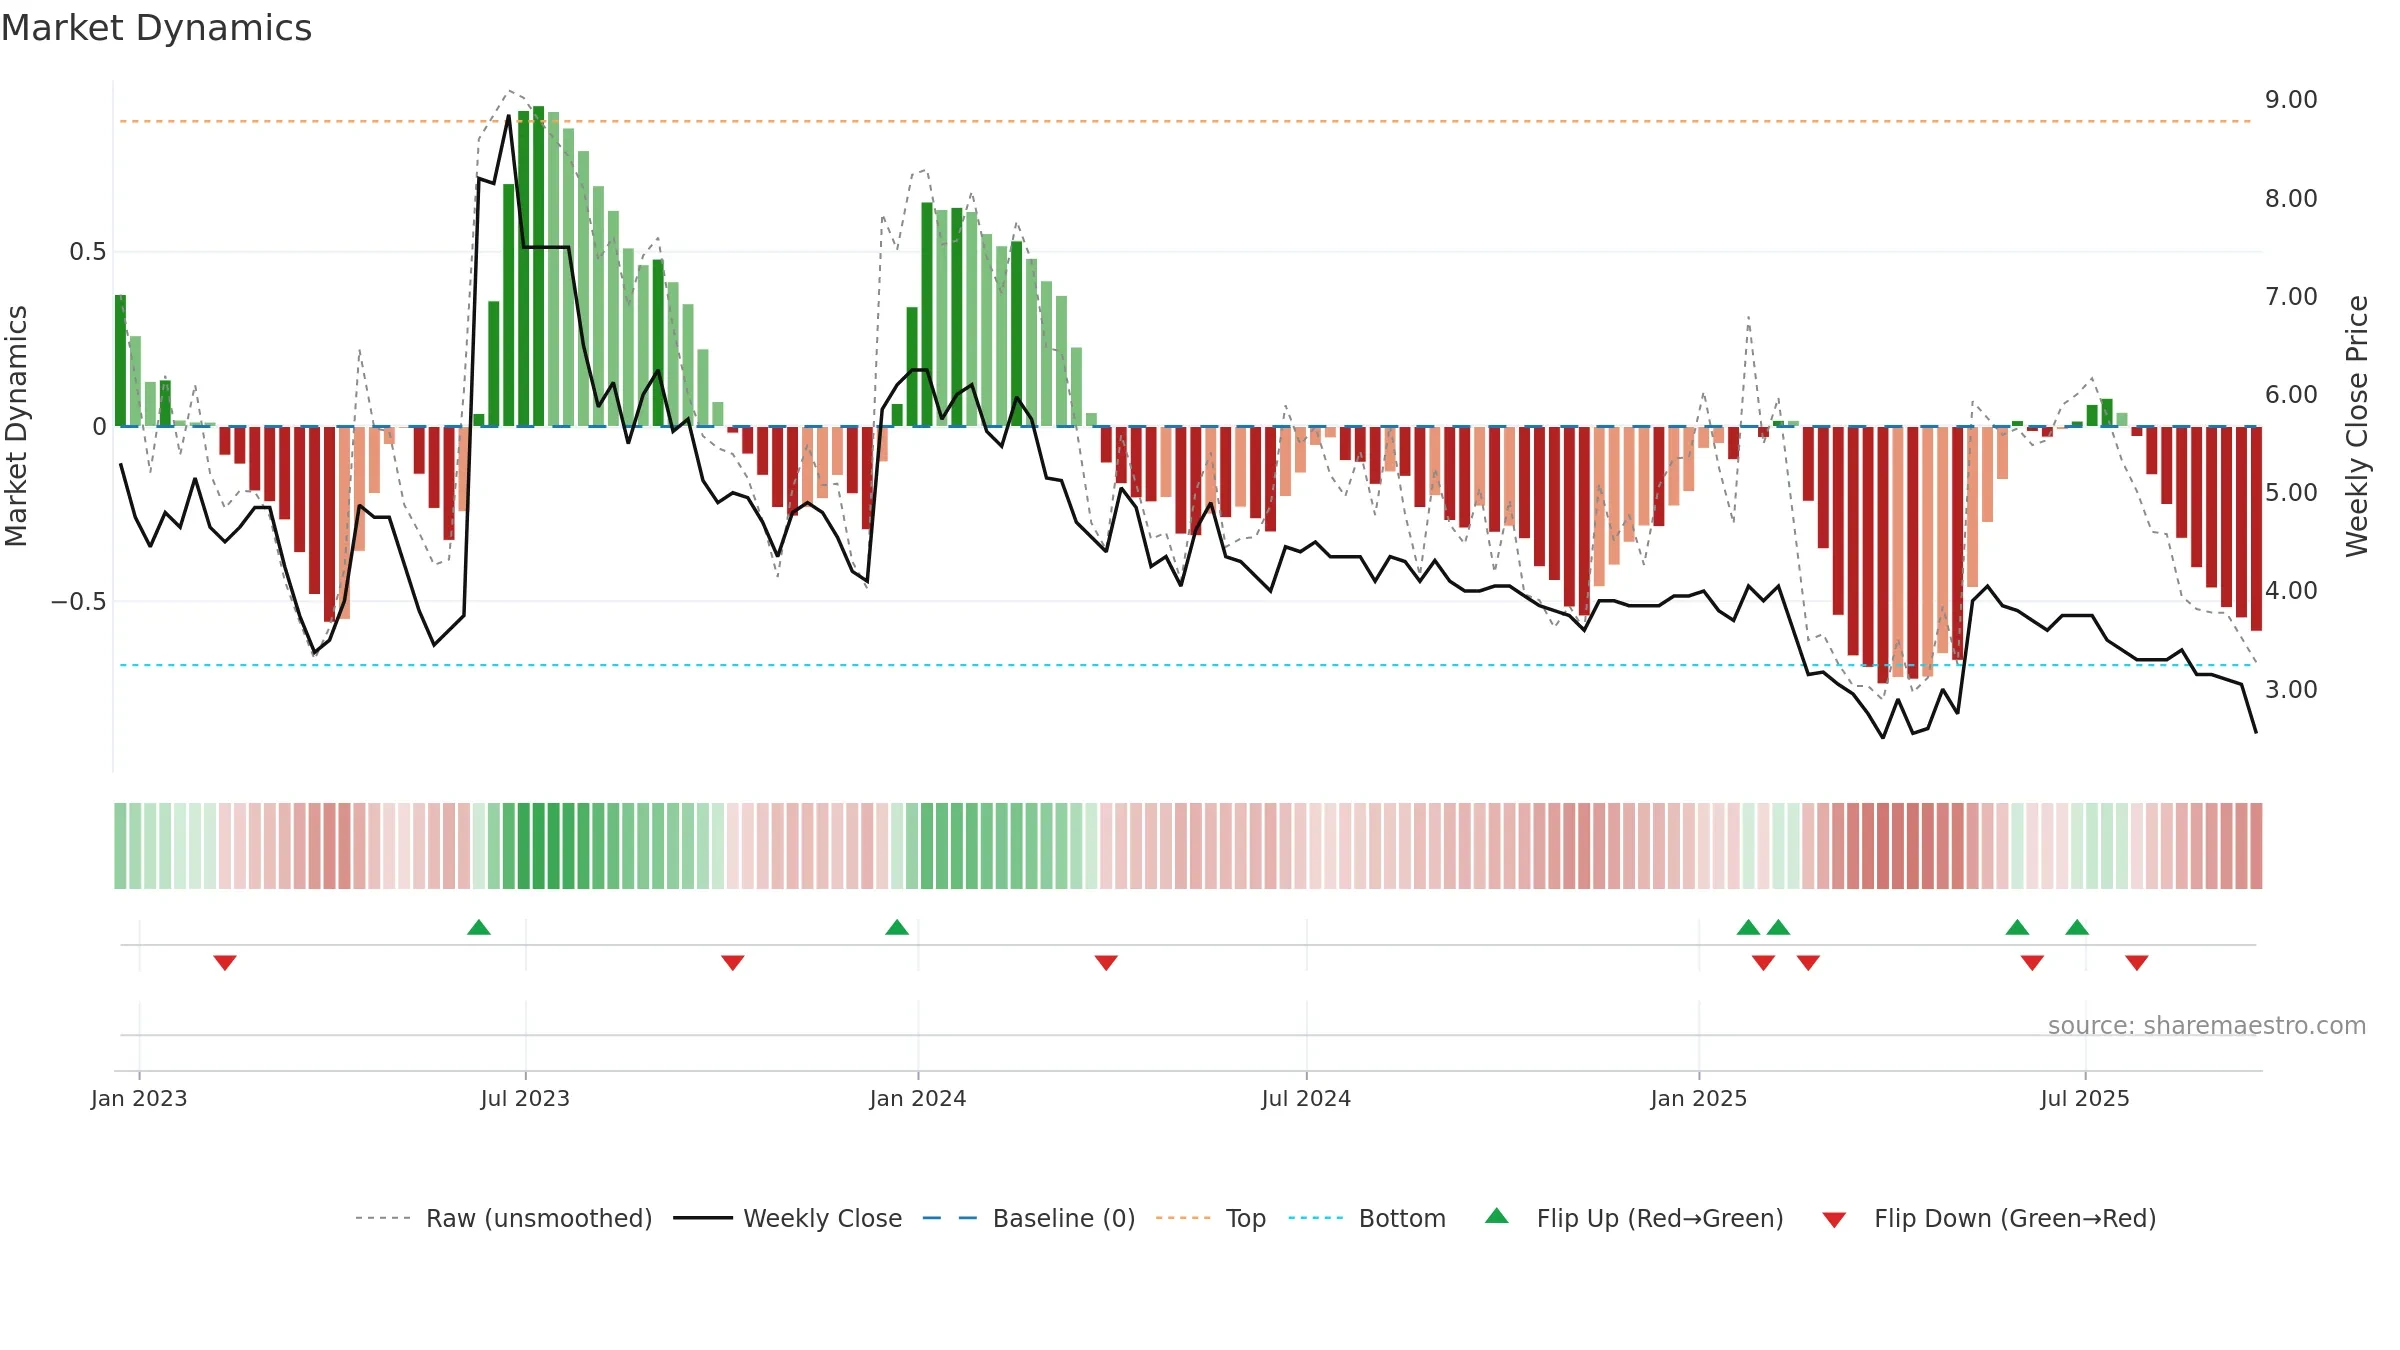
How to read this — Range-bound conditions; conviction is limited until a break or acceleration emerges. Loss of the ~0.50 midline after strength suggests regime shift.
Wait for a directional break or improving acceleration.
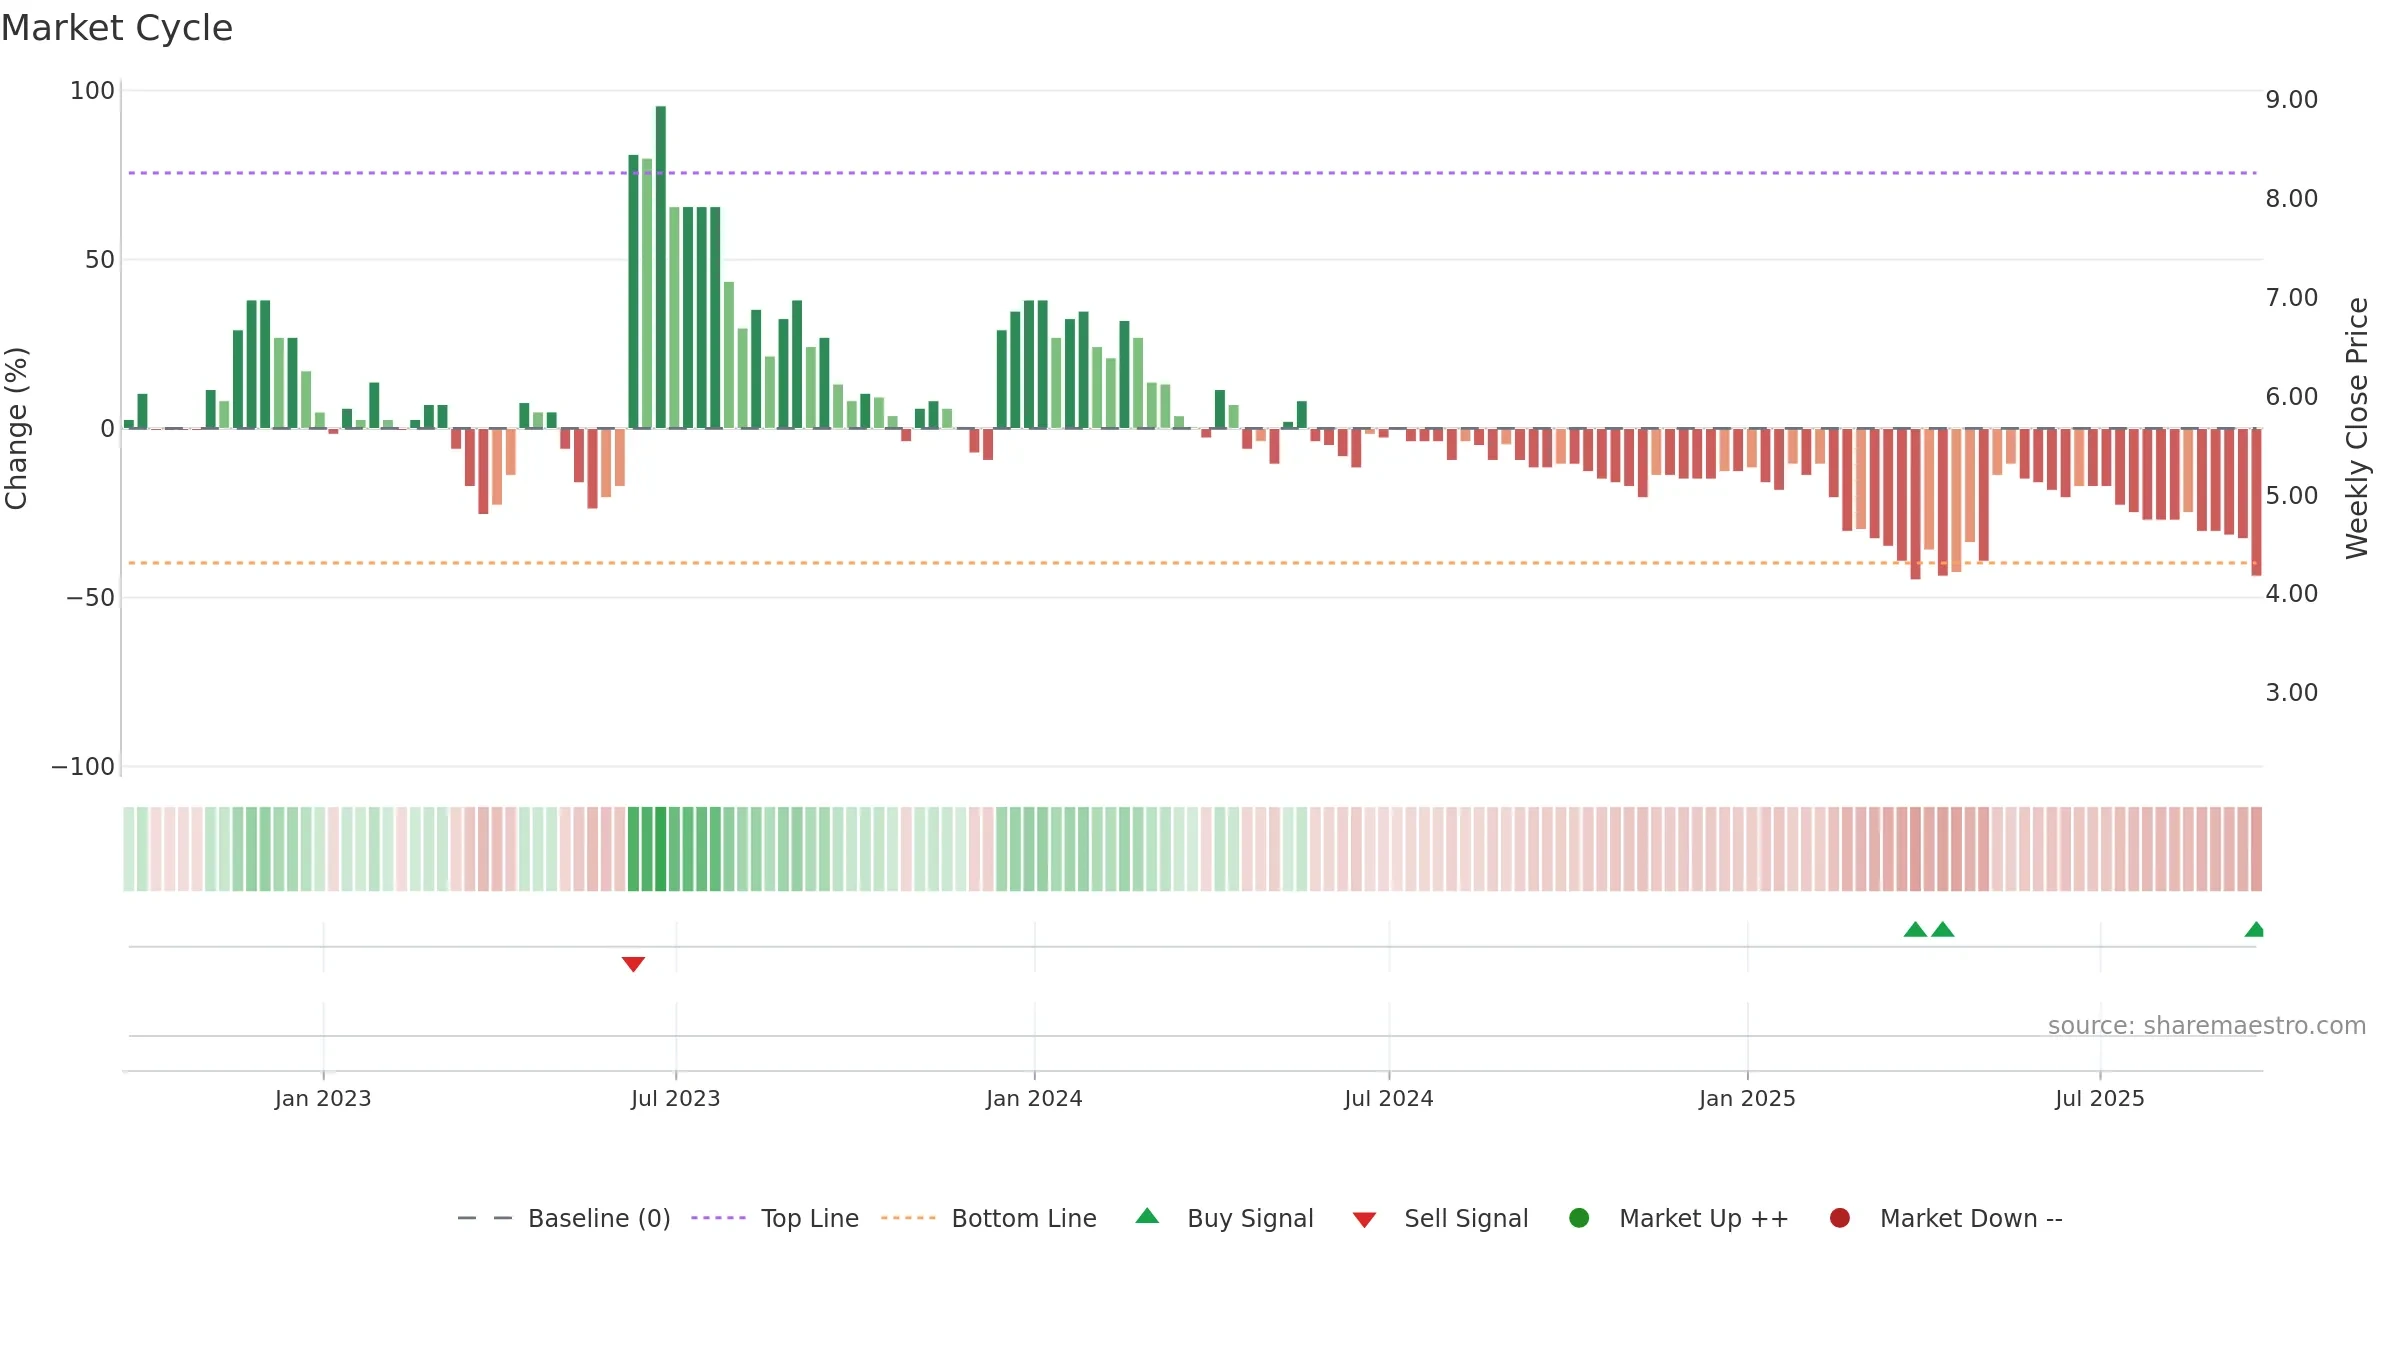
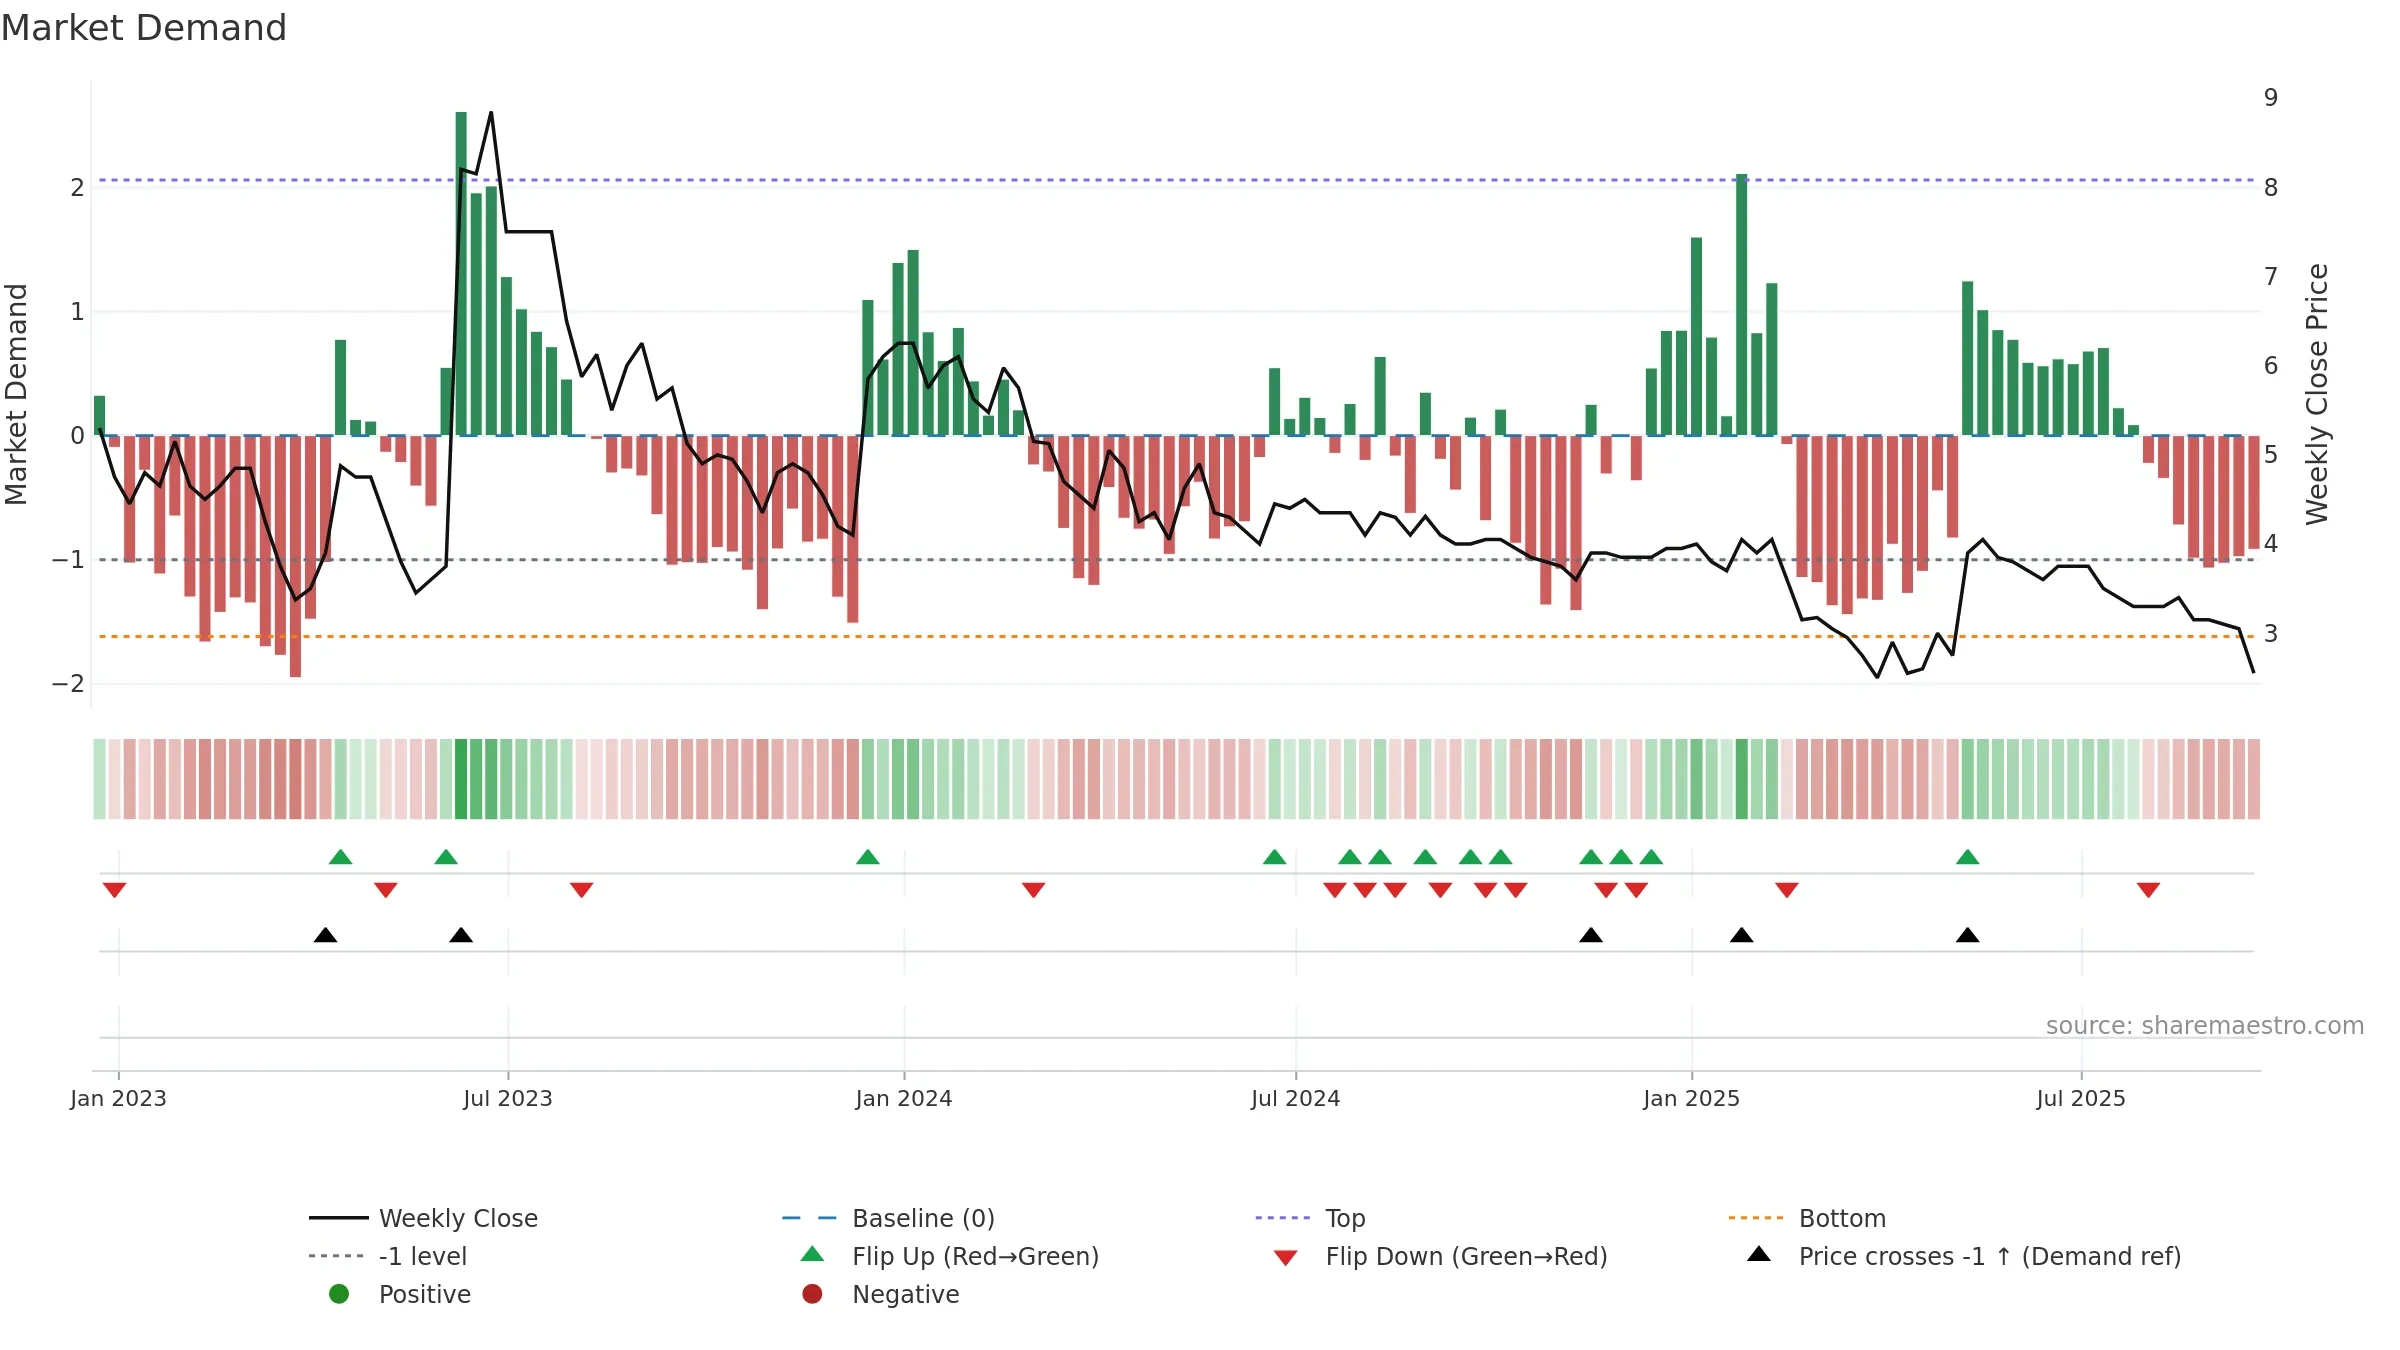
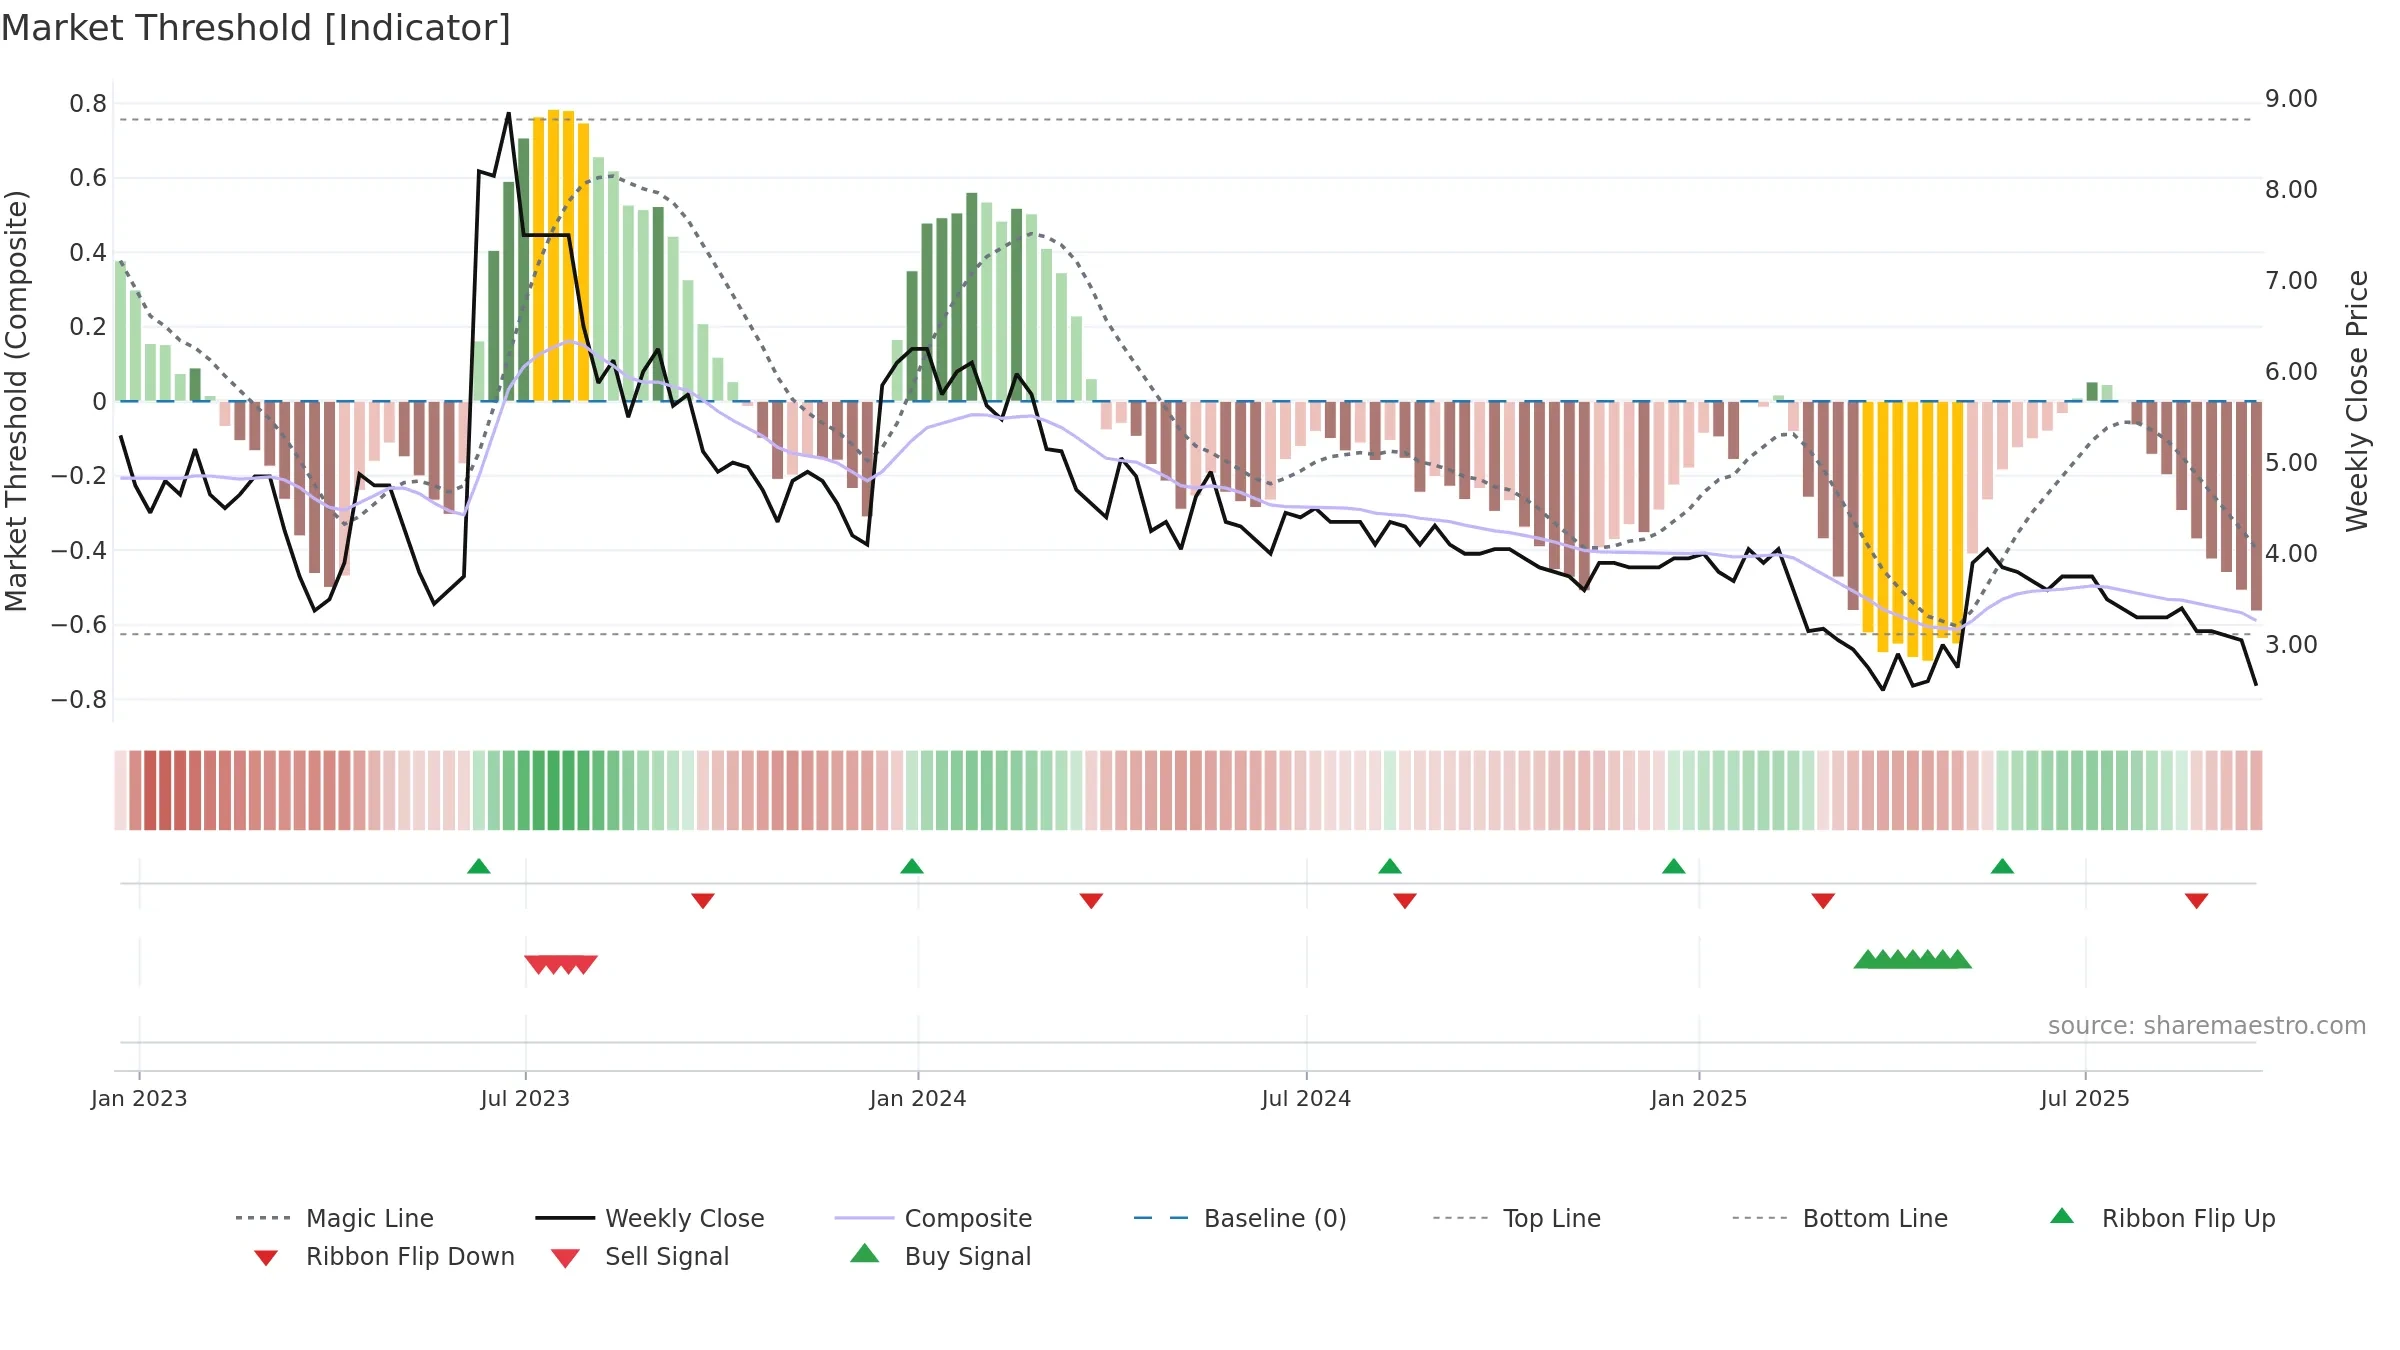
Conclusion
Neutral setup. ★★★☆☆ confidence. Price window: -22. Trend: Range / Neutral; gauge 42. In combination, liquidity diverges from price.
- Price is not above key averages
- Weak moving-average stack
- Liquidity diverges from price
- Negative multi-week performance
Why: Price window -22.73% over 8w. Close is -25.00% below the prior-window high. Volume trend rising. Liquidity divergence with price. Trend state range / neutral. MA stack weak. Momentum neutral and rising.
Tip: Most metrics include a hover tooltip where they appear in the report.