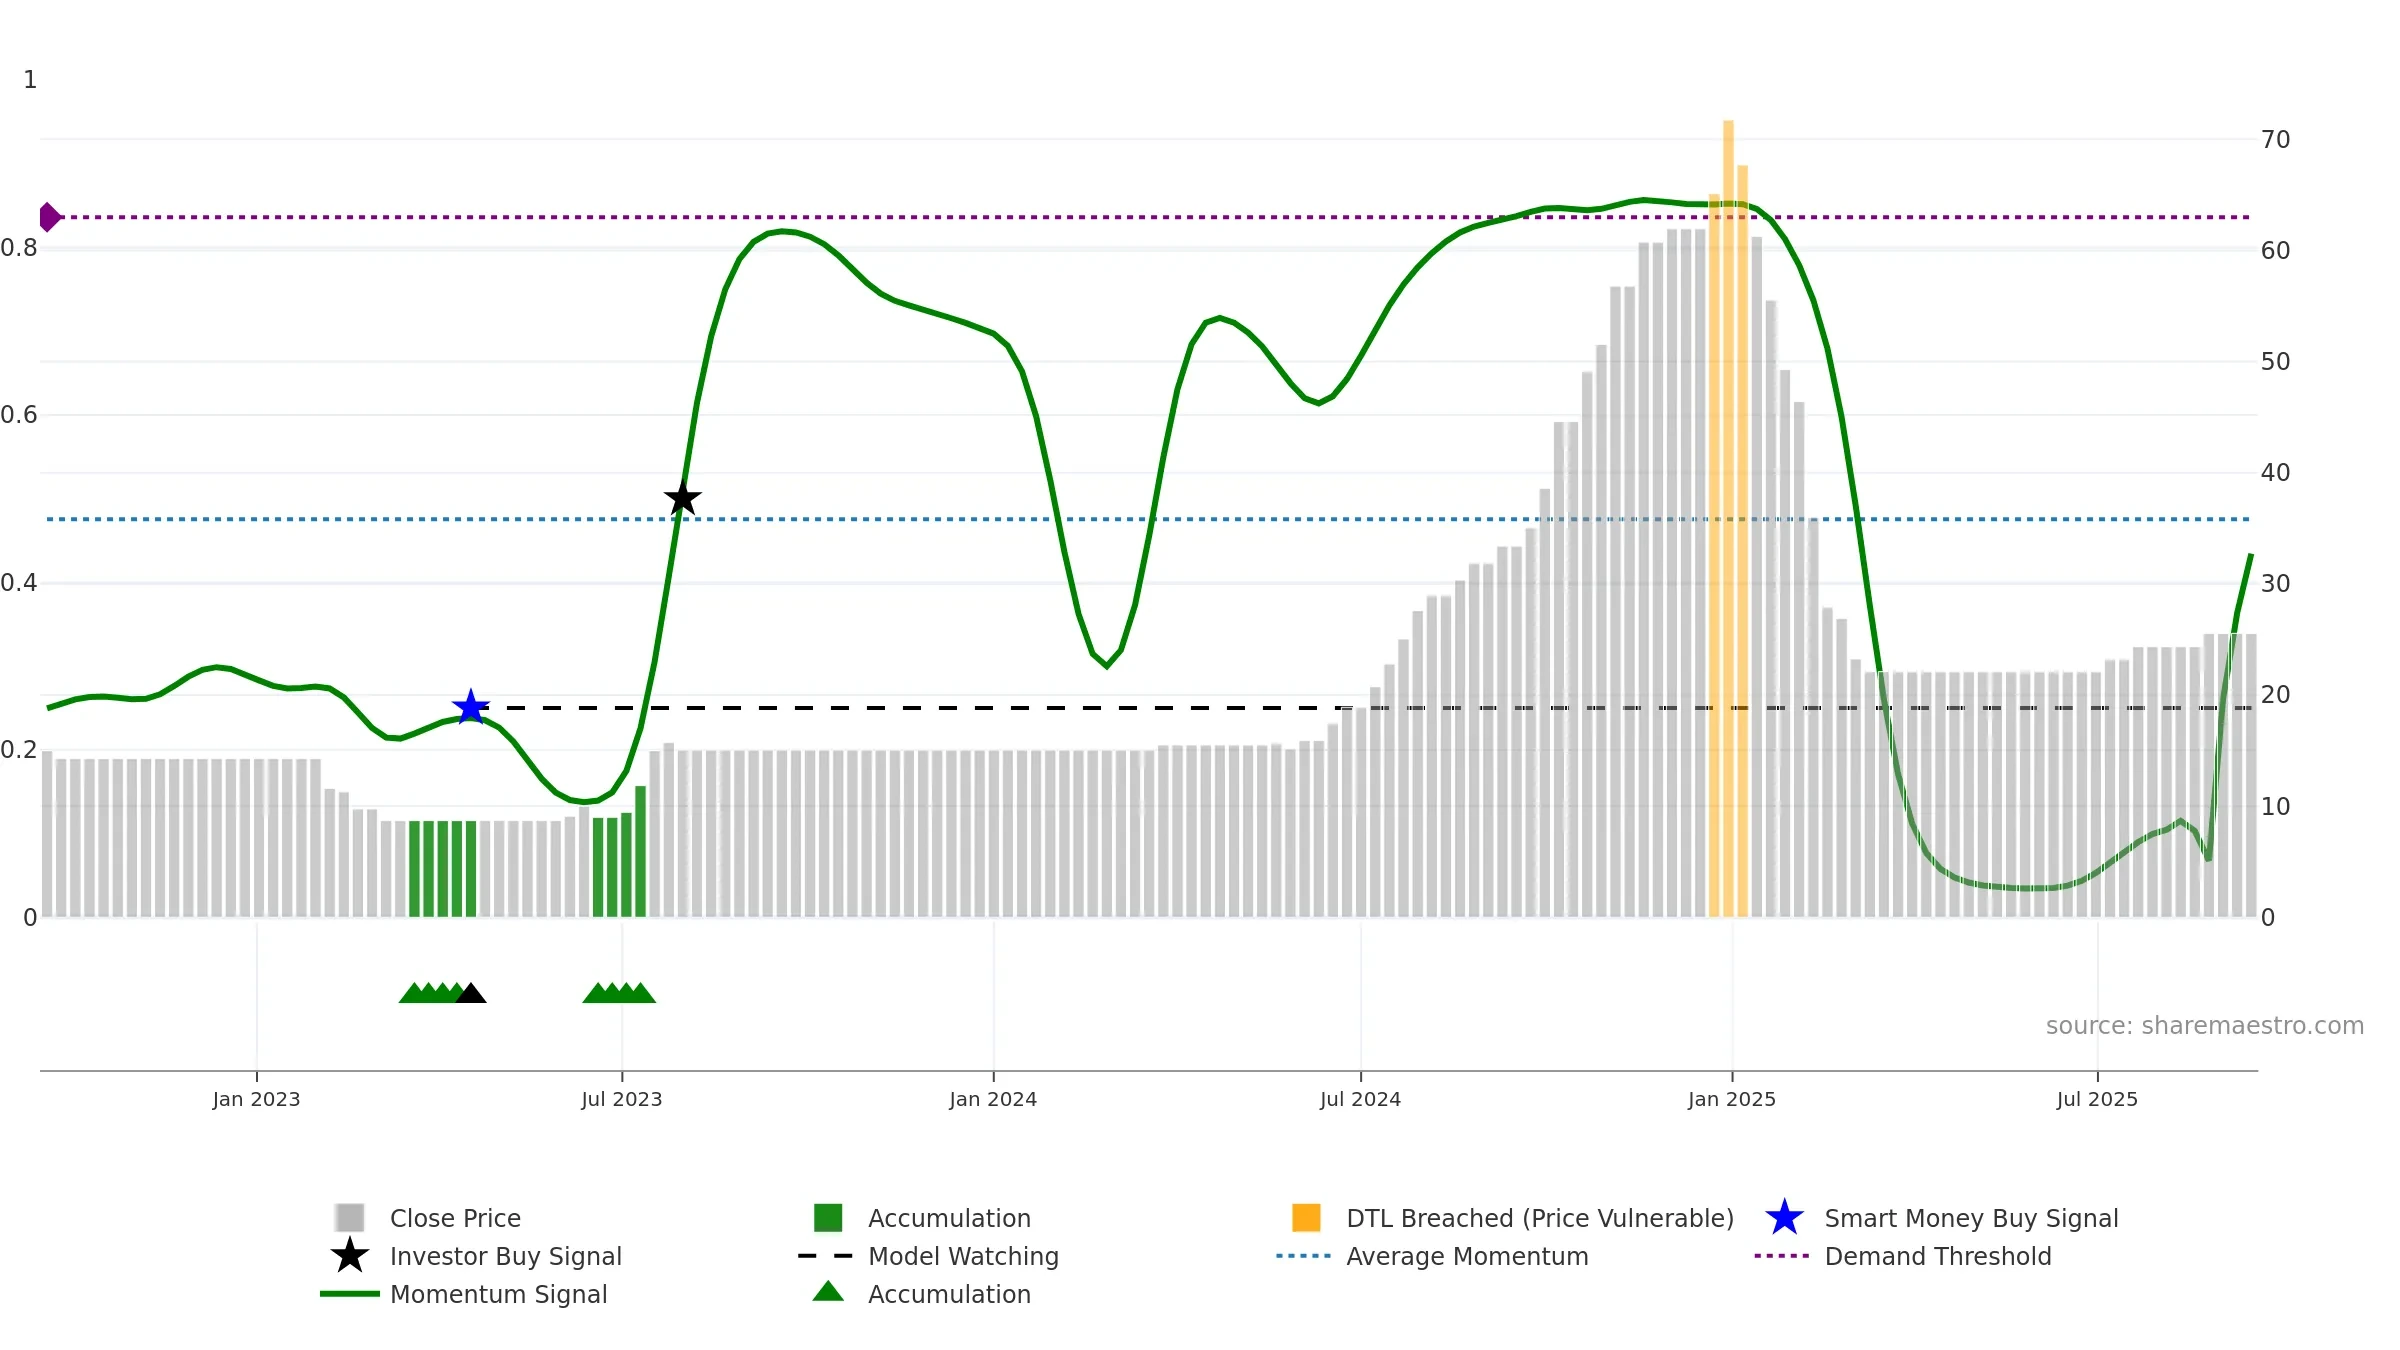
No results found.


Week Ending
Mon, 15 Sep 2025
Open
25.5500
Close
25.5500
High
25.5500
Low
25.5500
Trend
0.43436
Sharemaestro [Charts]
AHIMSA weekly Smart Money chart, closing 2025-09-15.
AHIMSA weekly Market Snapshot chart, closing 2025-09-15.
AHIMSA weekly Market Cycle chart, closing 2025-09-15.
AHIMSA weekly Market Demand chart, closing 2025-09-15.
AHIMSA weekly Market Strength chart, closing 2025-09-15.
AHIMSA weekly Activity chart, closing 2025-09-15.
AHIMSA weekly Market Dynamics chart, closing 2025-09-15.
AHIMSA weekly Market Threshold chart, closing 2025-09-15.

Weekly Report

None (AHIMSA) Week Ending: Mon, 15 Sep 2025 โ˜…โ˜…โ˜…โ˜…โ˜…
Weekly Report
Price
Weekly Close

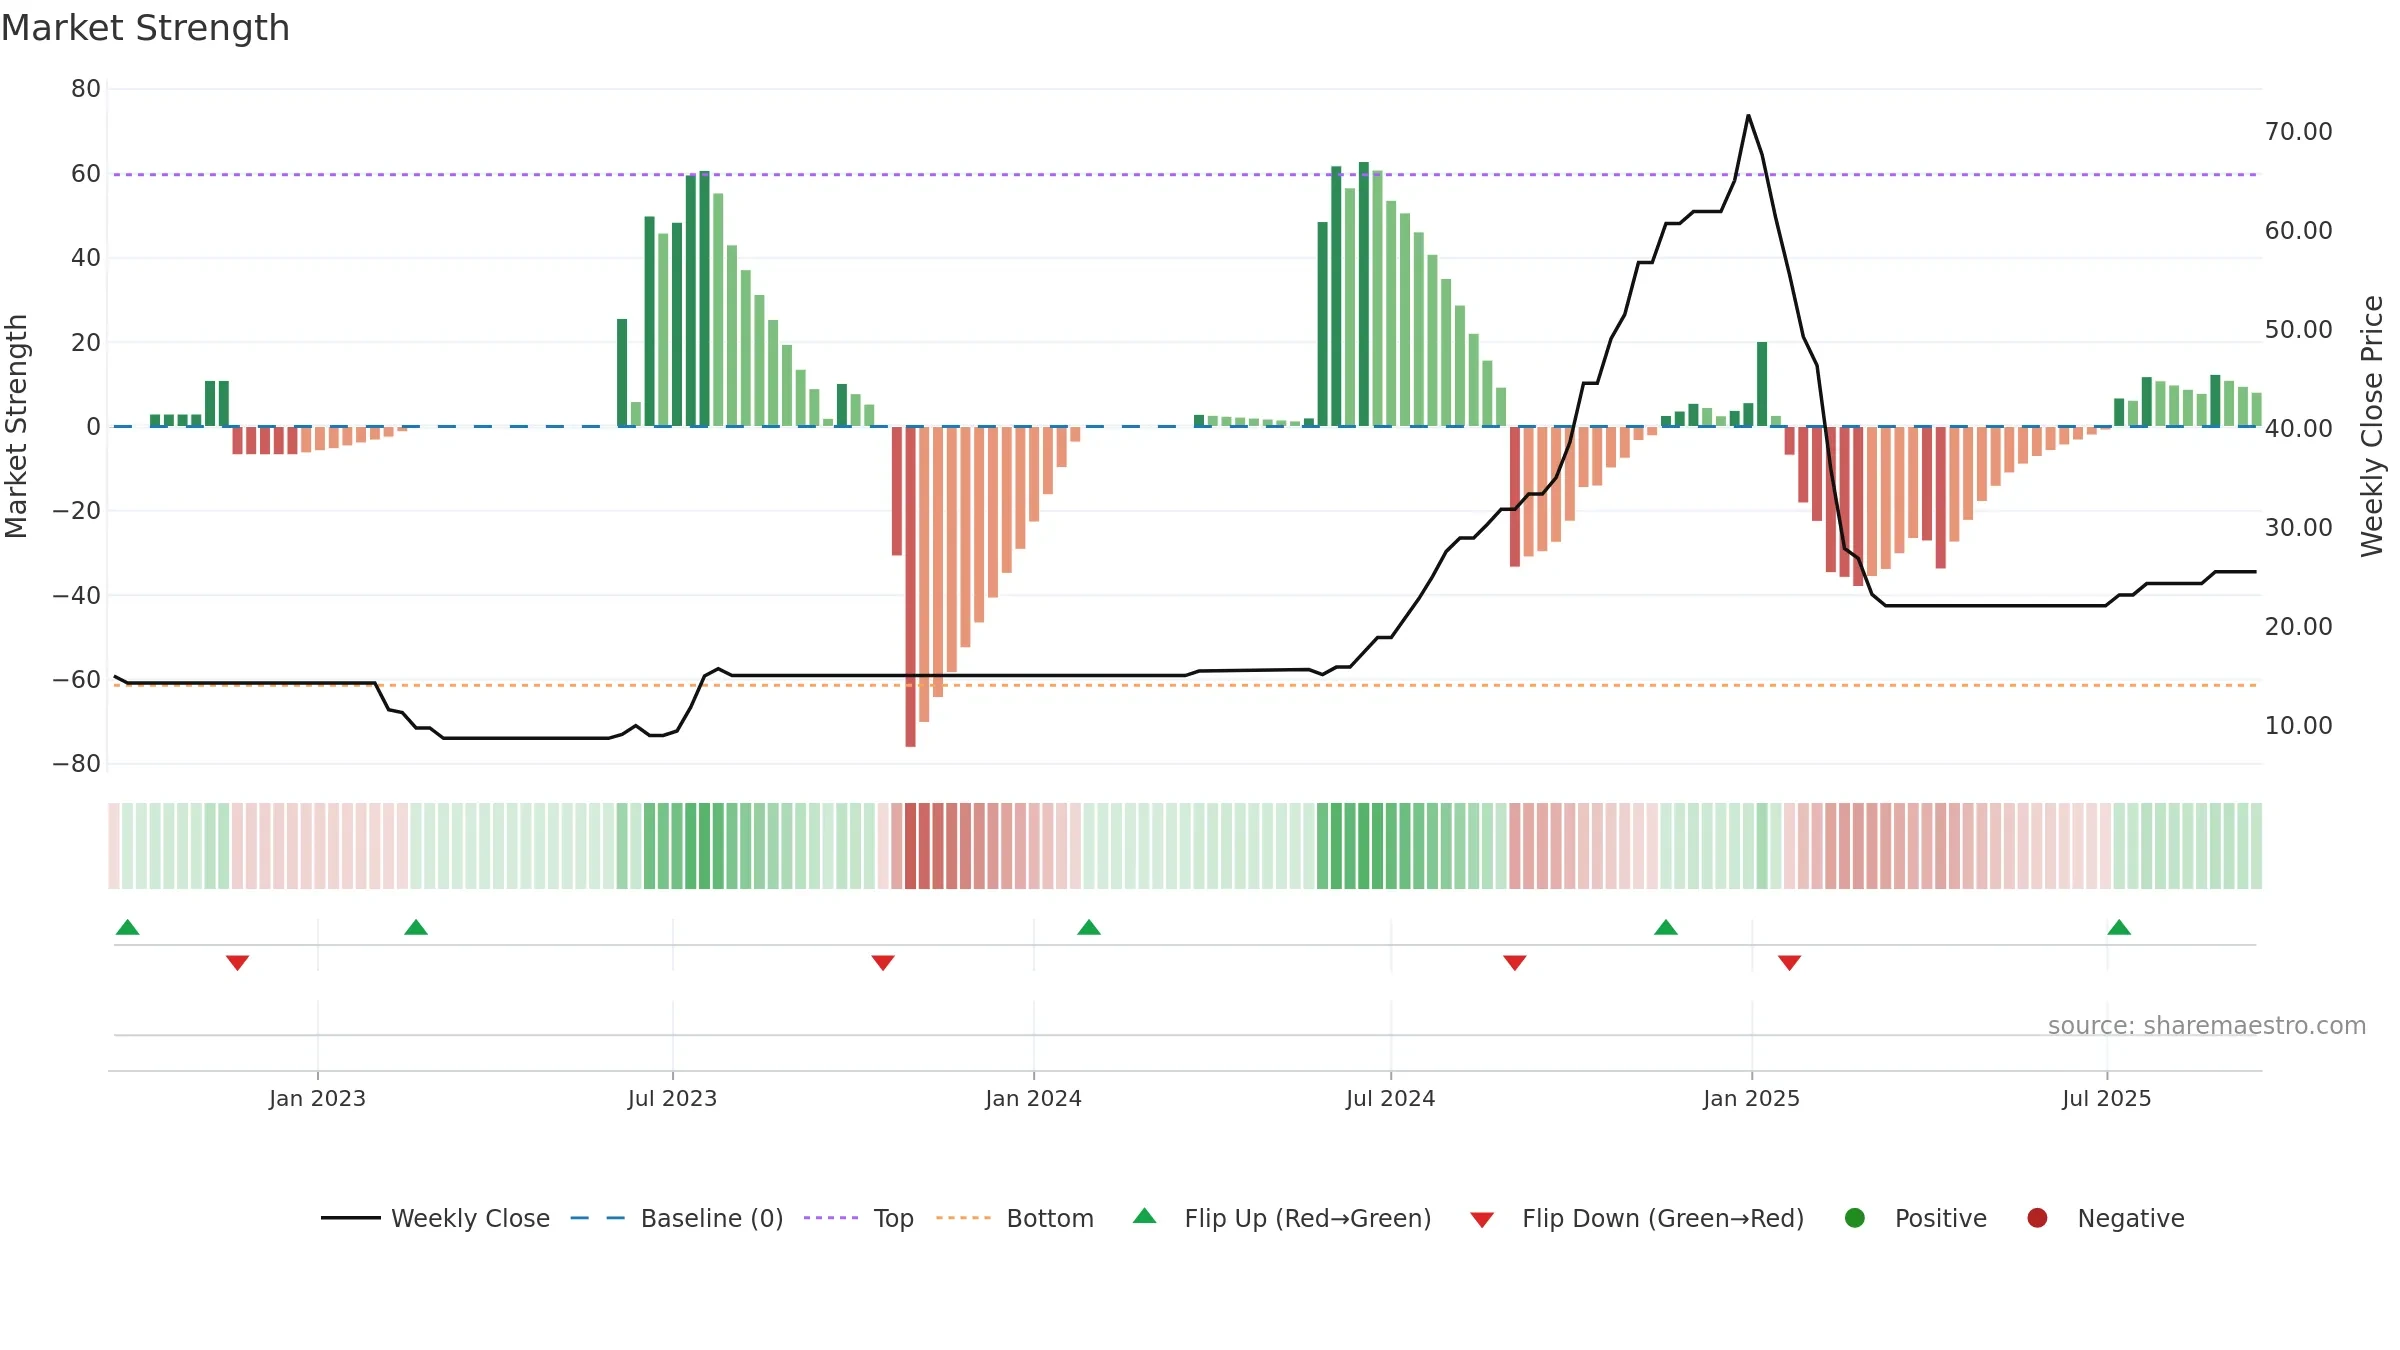
None closed at 25.5500 (0.00% WoW) . Data window ends Mon, 15 Sep 2025.

Price Window4.93% over 8w
Return Volatility0.00%
MA StackConstructive
Price vs MAsAbove
What stands out

How to read this โ€” Price slope is upward, indicating persistent buying over the window. Low weekly volatility favours steadier follow-through. Volume or price is flat; confirmation from liquidity is limited. Constructive MA stack supports the up-drift; pullbacks may find support at the 8โ€“13 week region. Price holds above key averages, indicating constructive participation.

What to watch

Up-slope supports buying interest; pullbacks may be contained if activity stays firm.
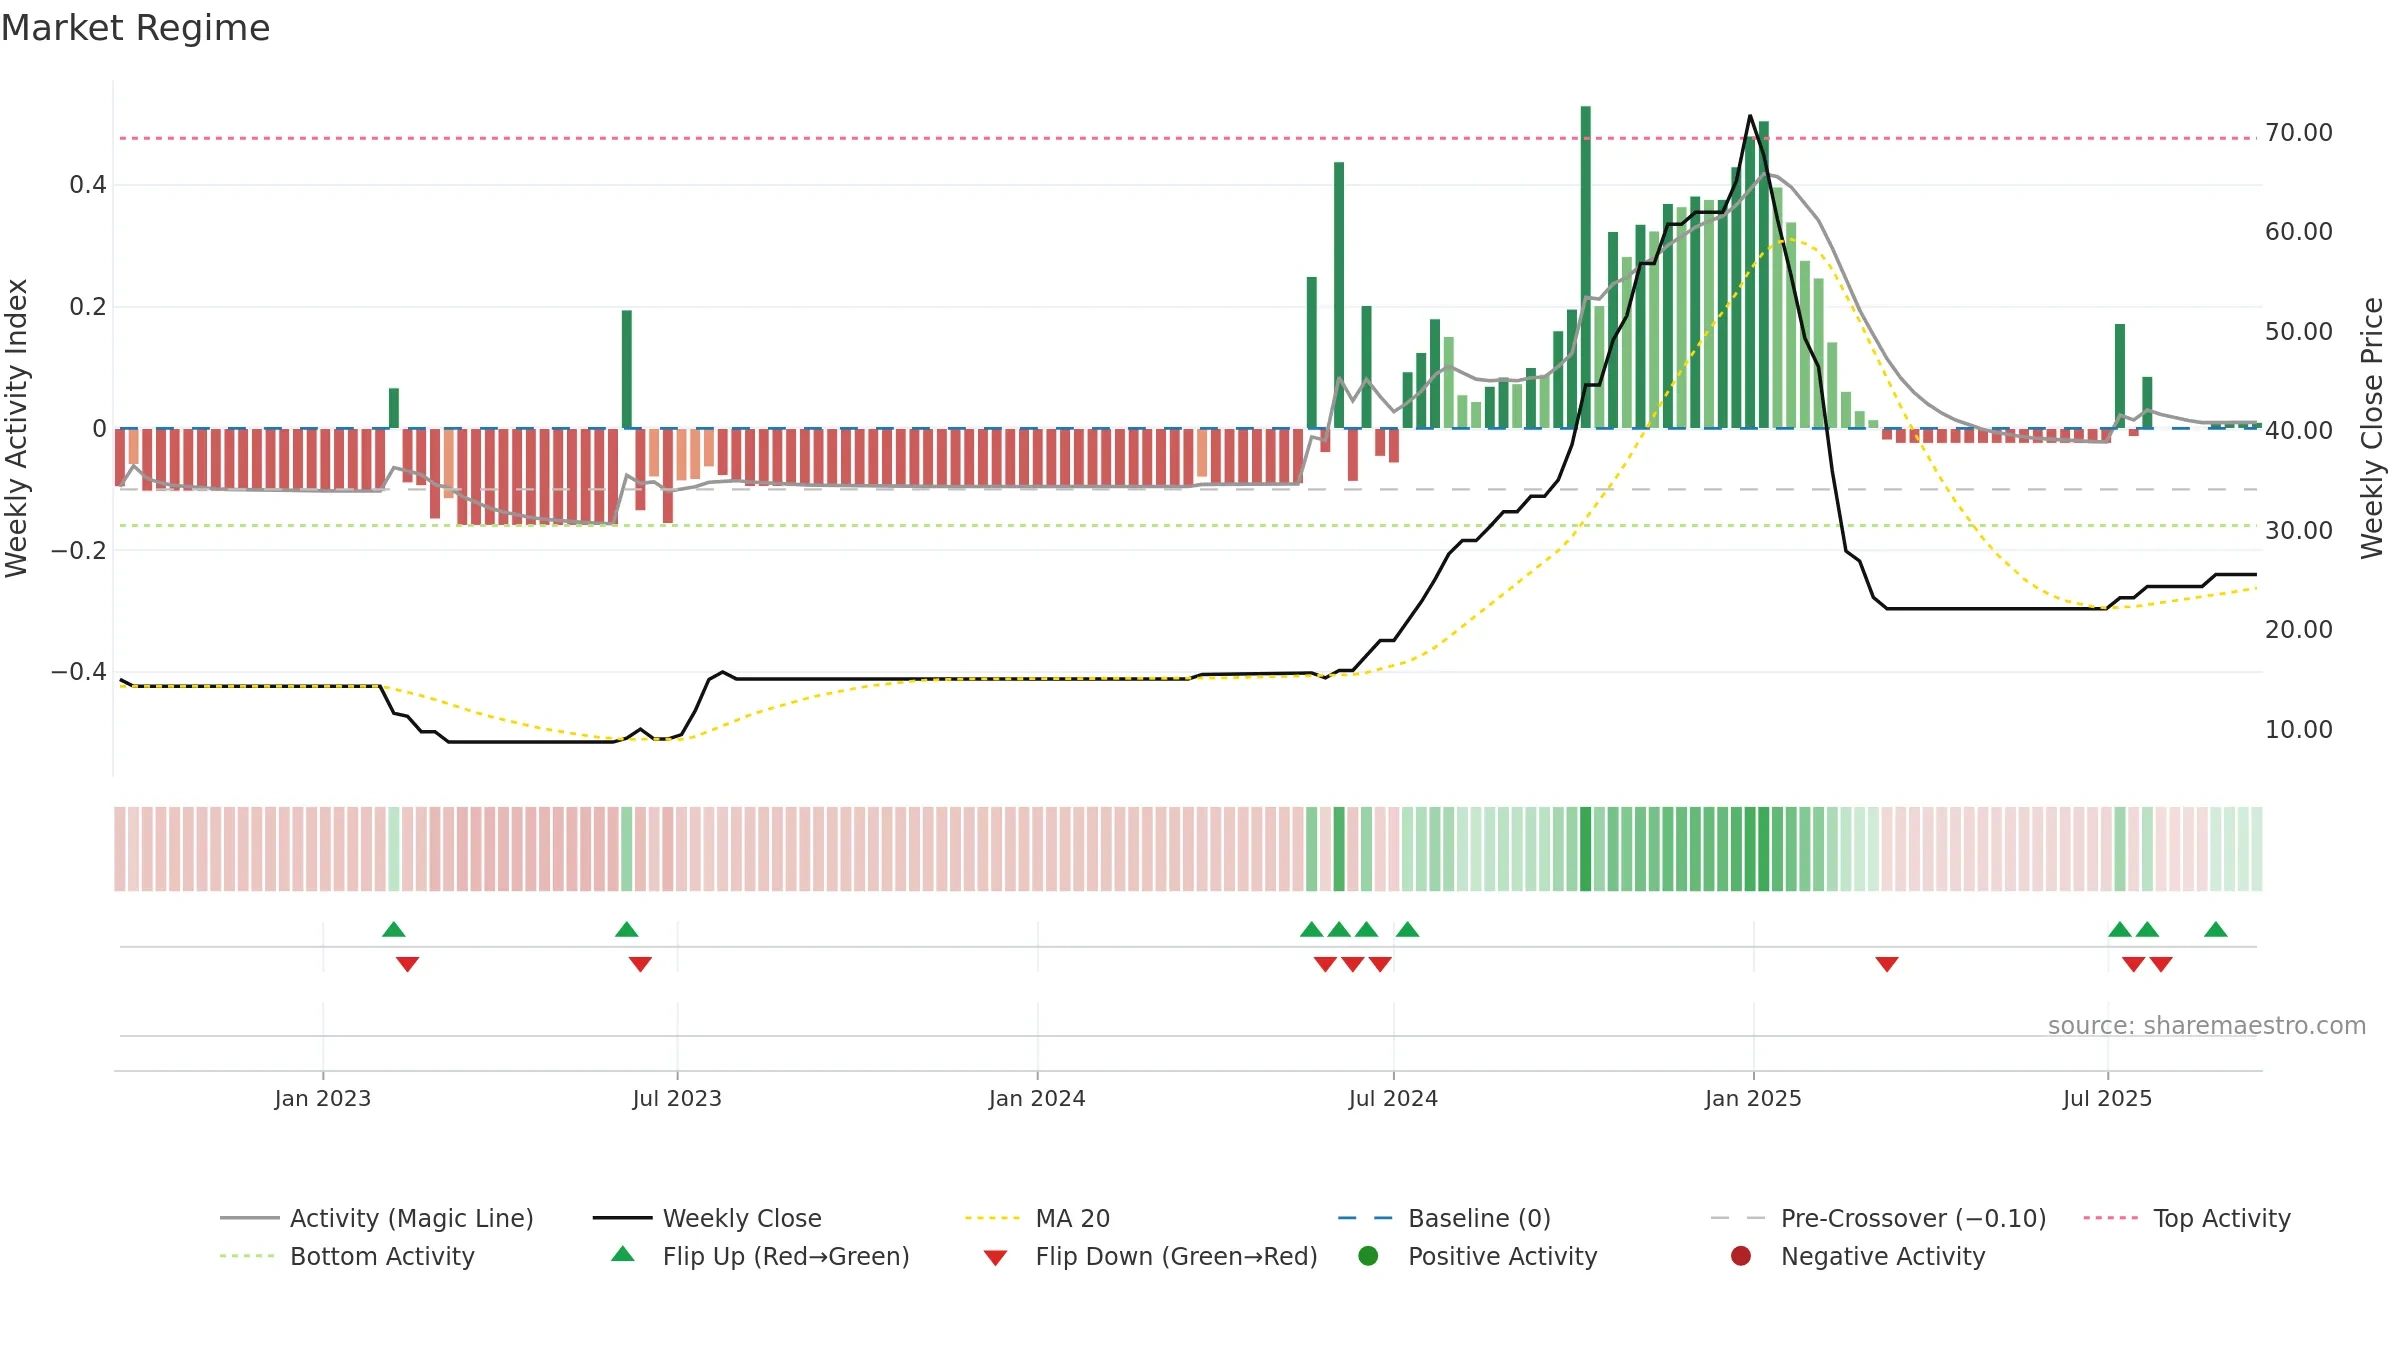
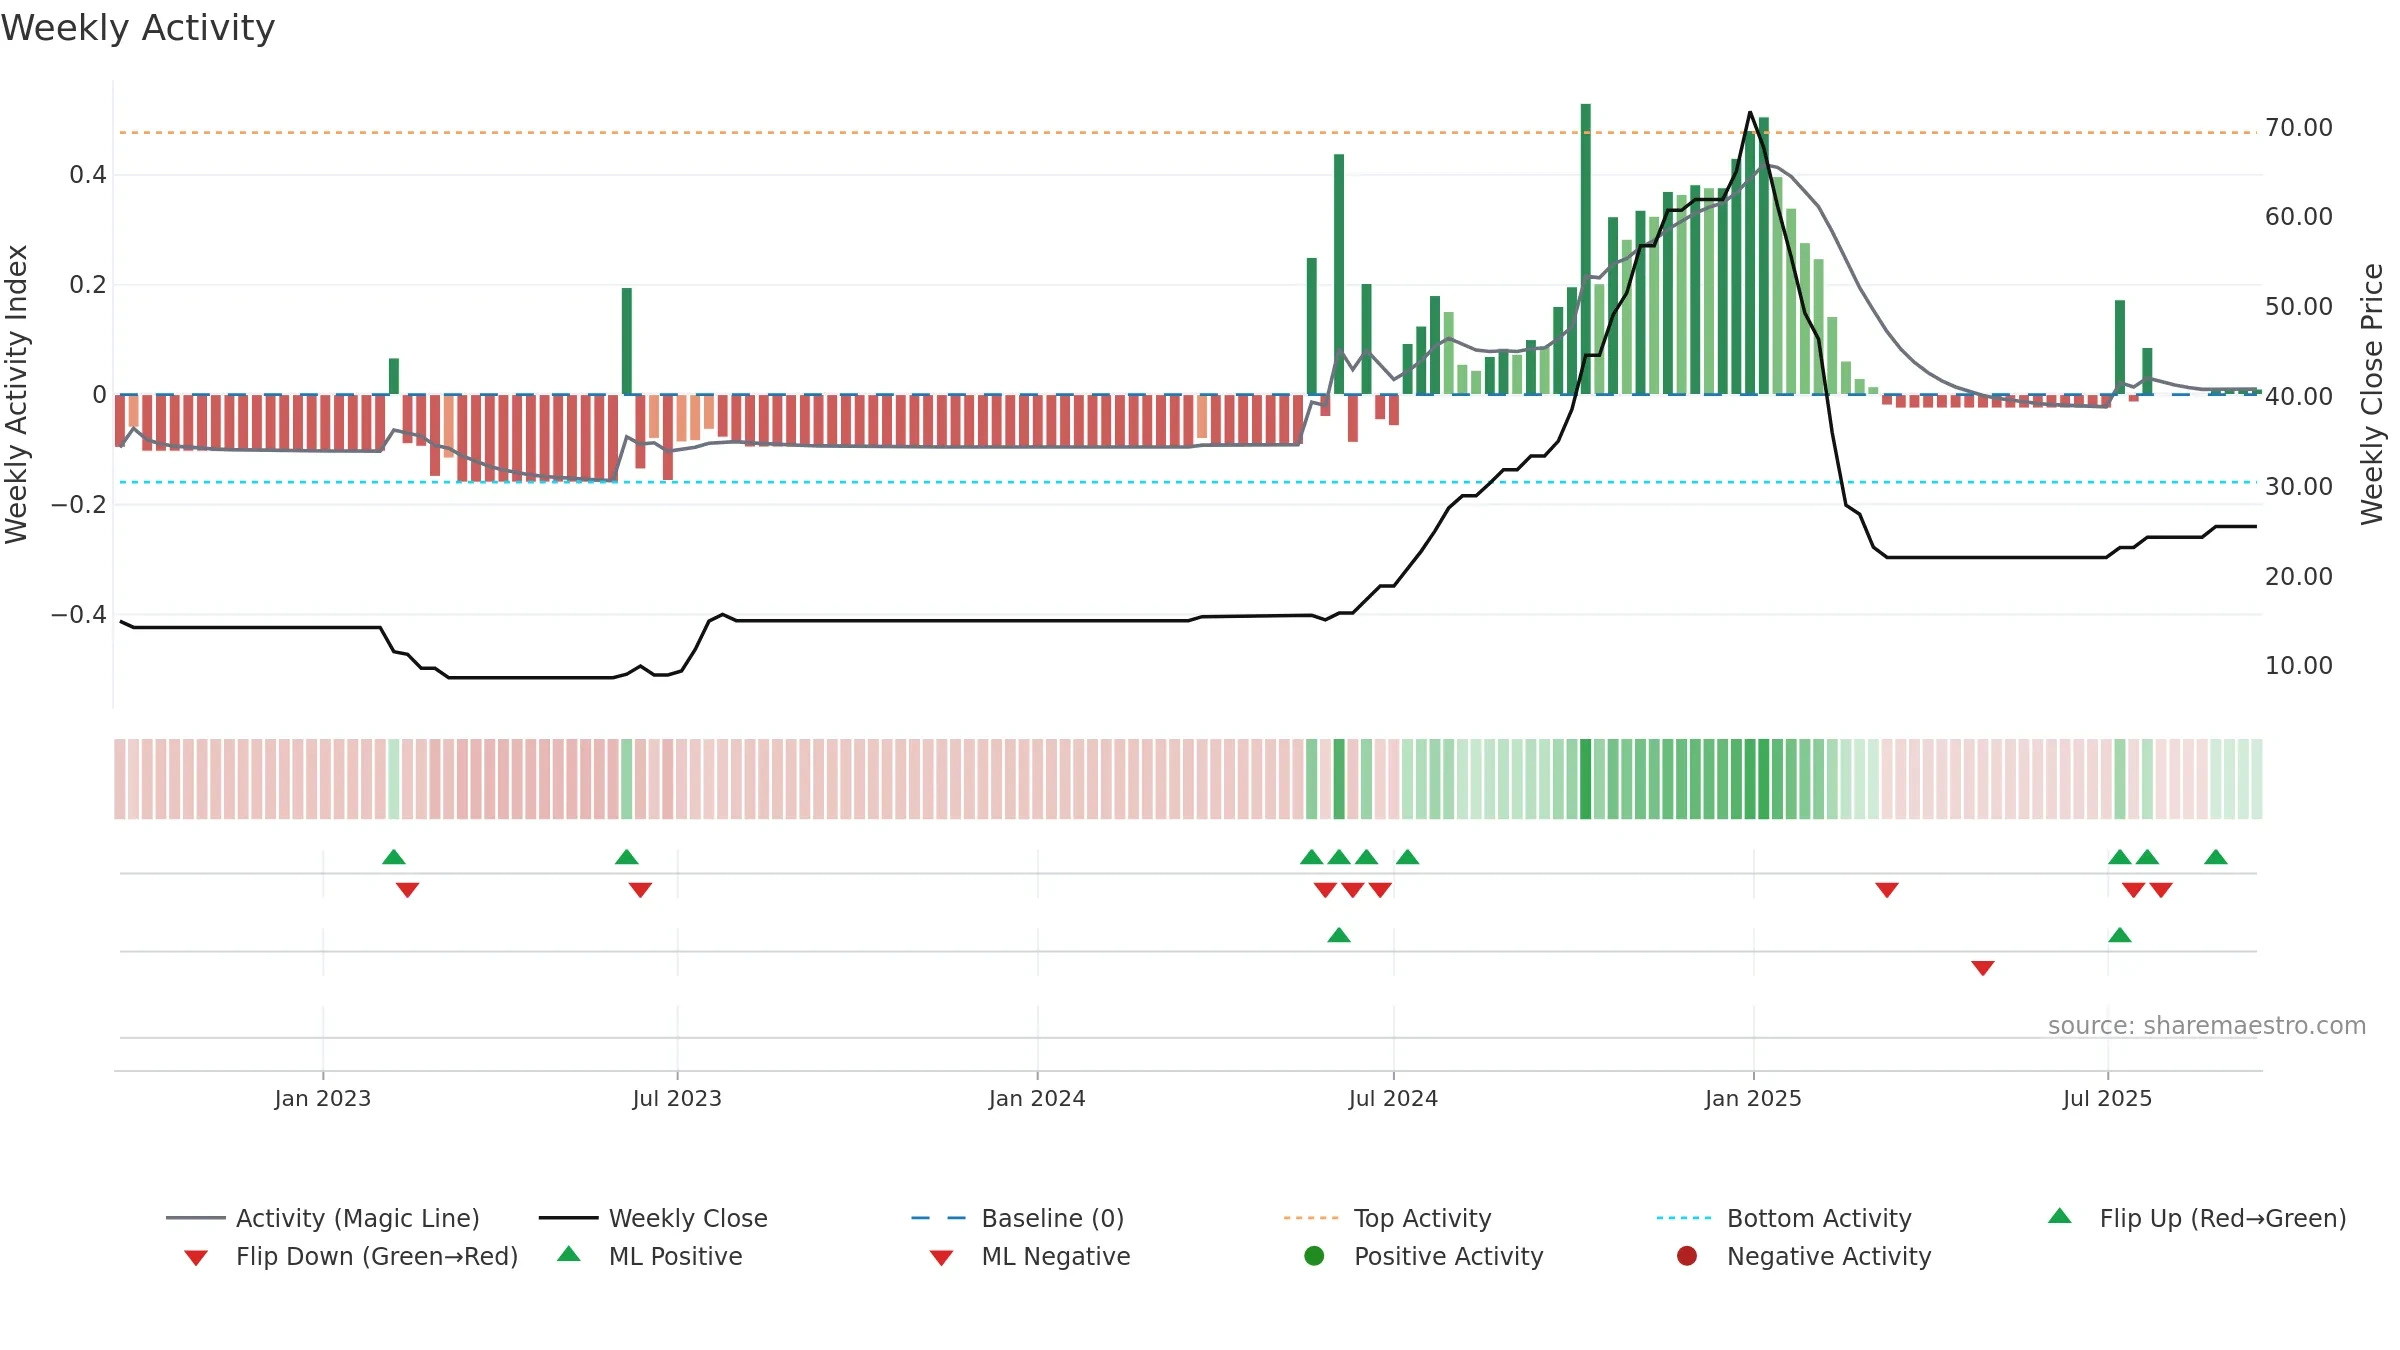
Trend
Sharemaestro Trend Line

Gauge maps the trend signal to a 0โ€“100 scale.

Gauge Reading43.4/100
DirectionRising
Accelerationaccelerating
Gauge VolatilityHigh
Trend StateRange / Neutral
Low-Regime Accumulation 3/5 (60.0%) โ€ข Accumulating
What stands out

How to read this โ€” Range-bound conditions; conviction is limited until a break or acceleration emerges.

What to watch

Wait for a directional break or improving acceleration.

Conclusion

Positive โ˜…โ˜…โ˜…โ˜…โ˜…

Positive setup. โ˜…โ˜…โ˜…โ˜…โ˜… confidence. Price window: 4. Trend: Range / Neutral; gauge 43. In combination, liquidity confirmation is mixed.

Strengths
  • Price holds above 8w & 26w averages
  • Constructive moving-average stack
  • Low return volatility supports durability
  • Buyers step in at depressed levels (accumulation)

Why: Price window 4.93% over 8w. Return volatility 0.00%. Liquidity flat with price. Trend state range / neutral. Low-regime (โ‰ค0.25) upticks 3/5 (60.0%) โ€ข Accumulating. MA stack constructive. Momentum neutral and rising.

Price Window Endpoint return over the last N weeks using weekly closes: (Closelast โˆ’ Closefirst)/Closefirst ร— 100.
Return Volatility Std-dev of weekly returns (%). Higher = choppier.
Volume Trend Slope of weekly volume across the window (rising / falling / flat).
Vs N-week High % distance of latest close from the highest close in the window.
Accumulation Weeks Weeks price rose on higher volume than the prior week.
Distribution Weeks Weeks price fell on higher volume than the prior week.
MA Stack Relative order of short/intermediate/long MAs. Short > long is constructive.
4โ€“8 Crossover Latest cross of 4-week vs 8-week MA (bullish / bearish / none).
Price vs MAs Whether the close is above/below key averages (8w & 26w).
Baseline Deviation % distance from the market-cycle baseline (fair-value track).
Gauge Reading Smoothed trend signal mapped to 0โ€“100.
Direction Slope sign of the gauge across the window (rising / falling).
Acceleration Change in the slope of the gauge (accelerating / decelerating).
Gauge Volatility Variability of the gauge (low / normal / high).
Zone Label Classification by level (Bullish / Neutral / Bearish).
Target Price (Flag) If flagged: Positive/Negative stance. Otherwise: numeric fair value.
Composite Score Overall model score (0โ€“10).
Hybrid Efficiency Efficiency of growth ร— quality (0โ€“10).
Rating Modelโ€™s verdict for the snapshot.
Weekly Close Sparkline of the last 52 weekly closing prices.
Trend Line Sparkline of the smoothed trend signal over the last 52 weeks.

Tip: Most metrics include a hover tooltip where they appear in the report.

Week Ending: September 15, 2025