Jain Irrigation Systems Limited
JISLDVREQS NSE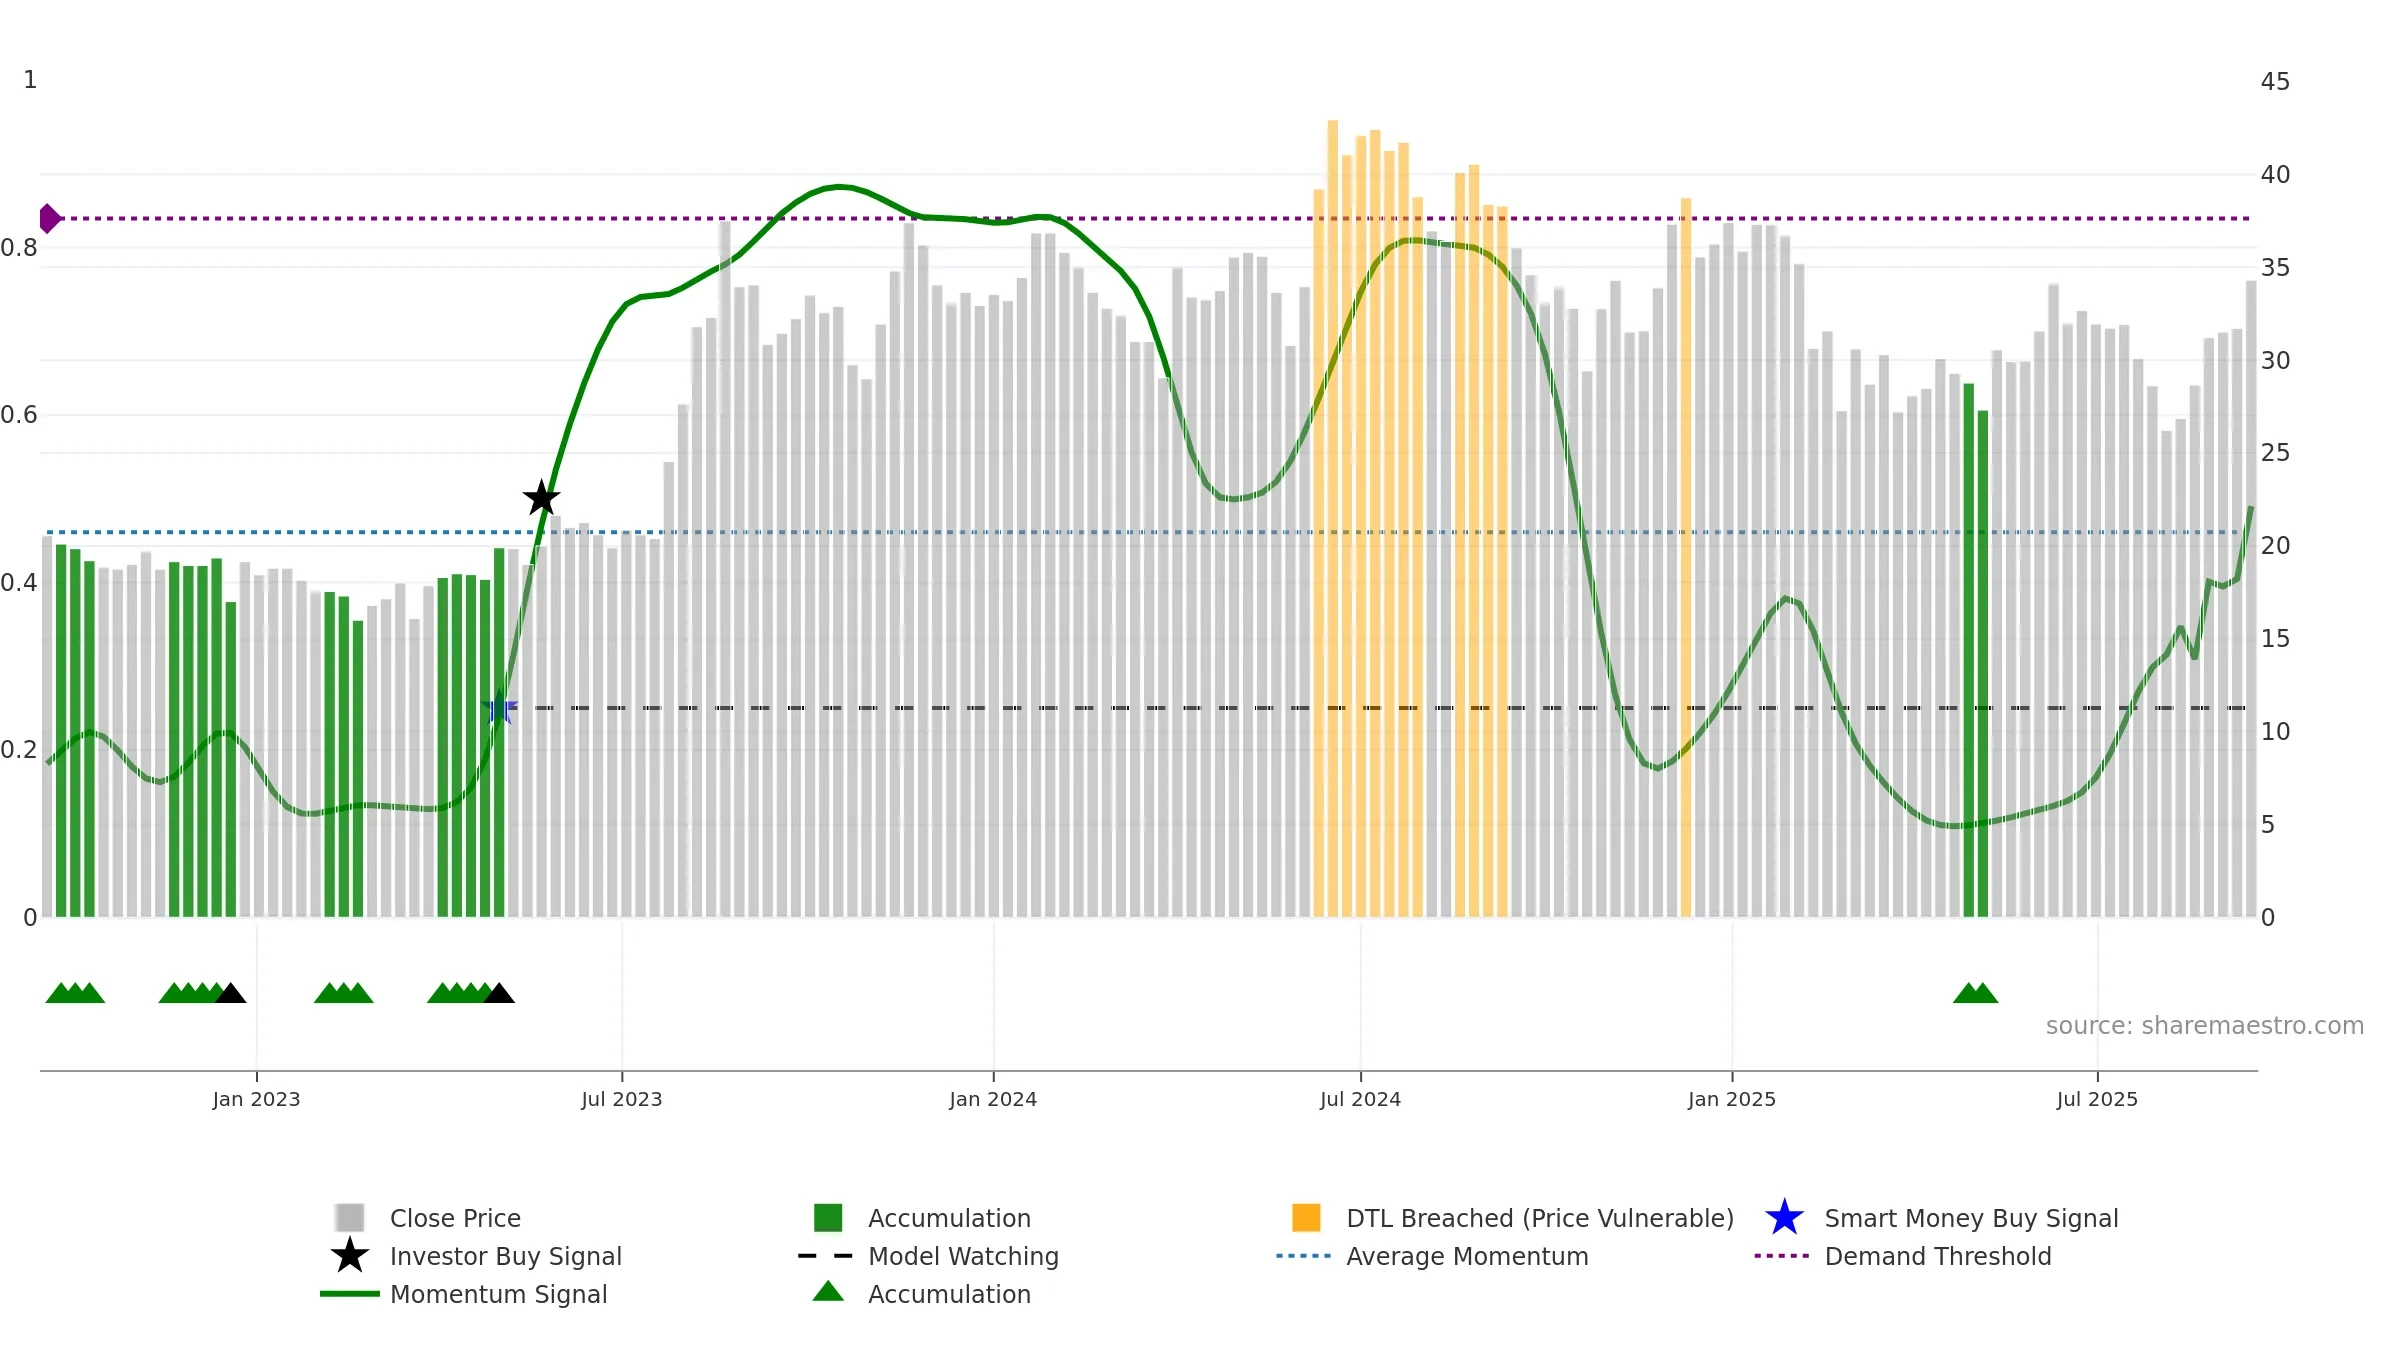
Weekly Report
Jain Irrigation Systems Limited closed at 34.3100 (0.32% WoW) . Data window ends Mon, 15 Sep 2025.
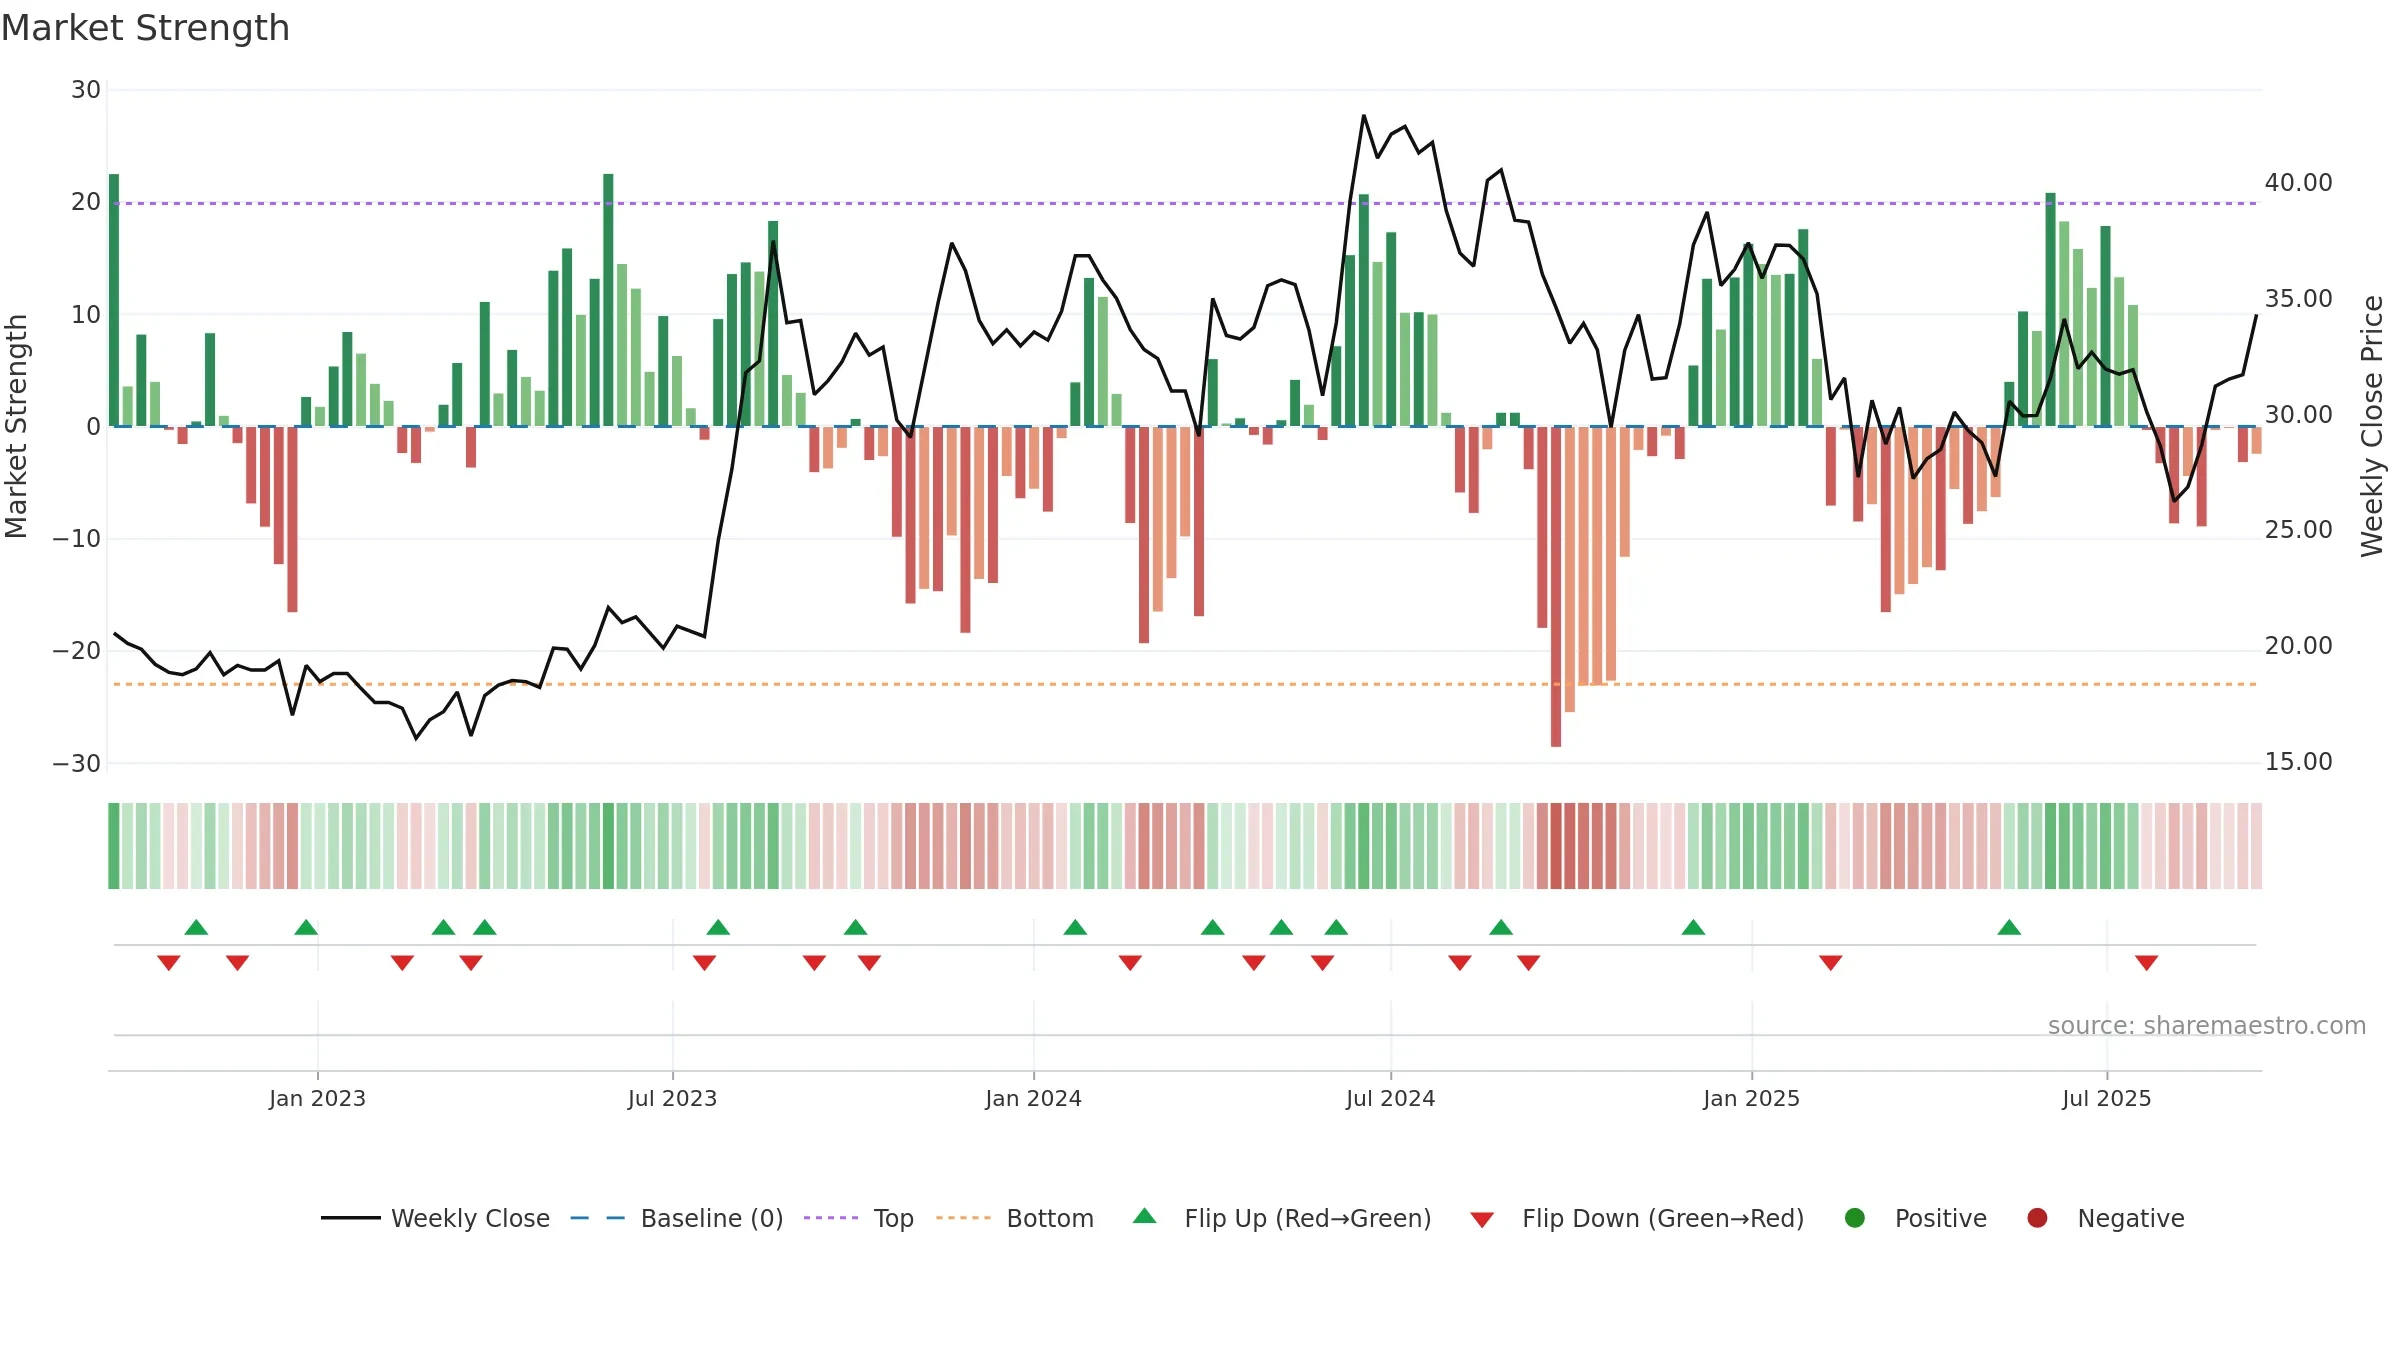
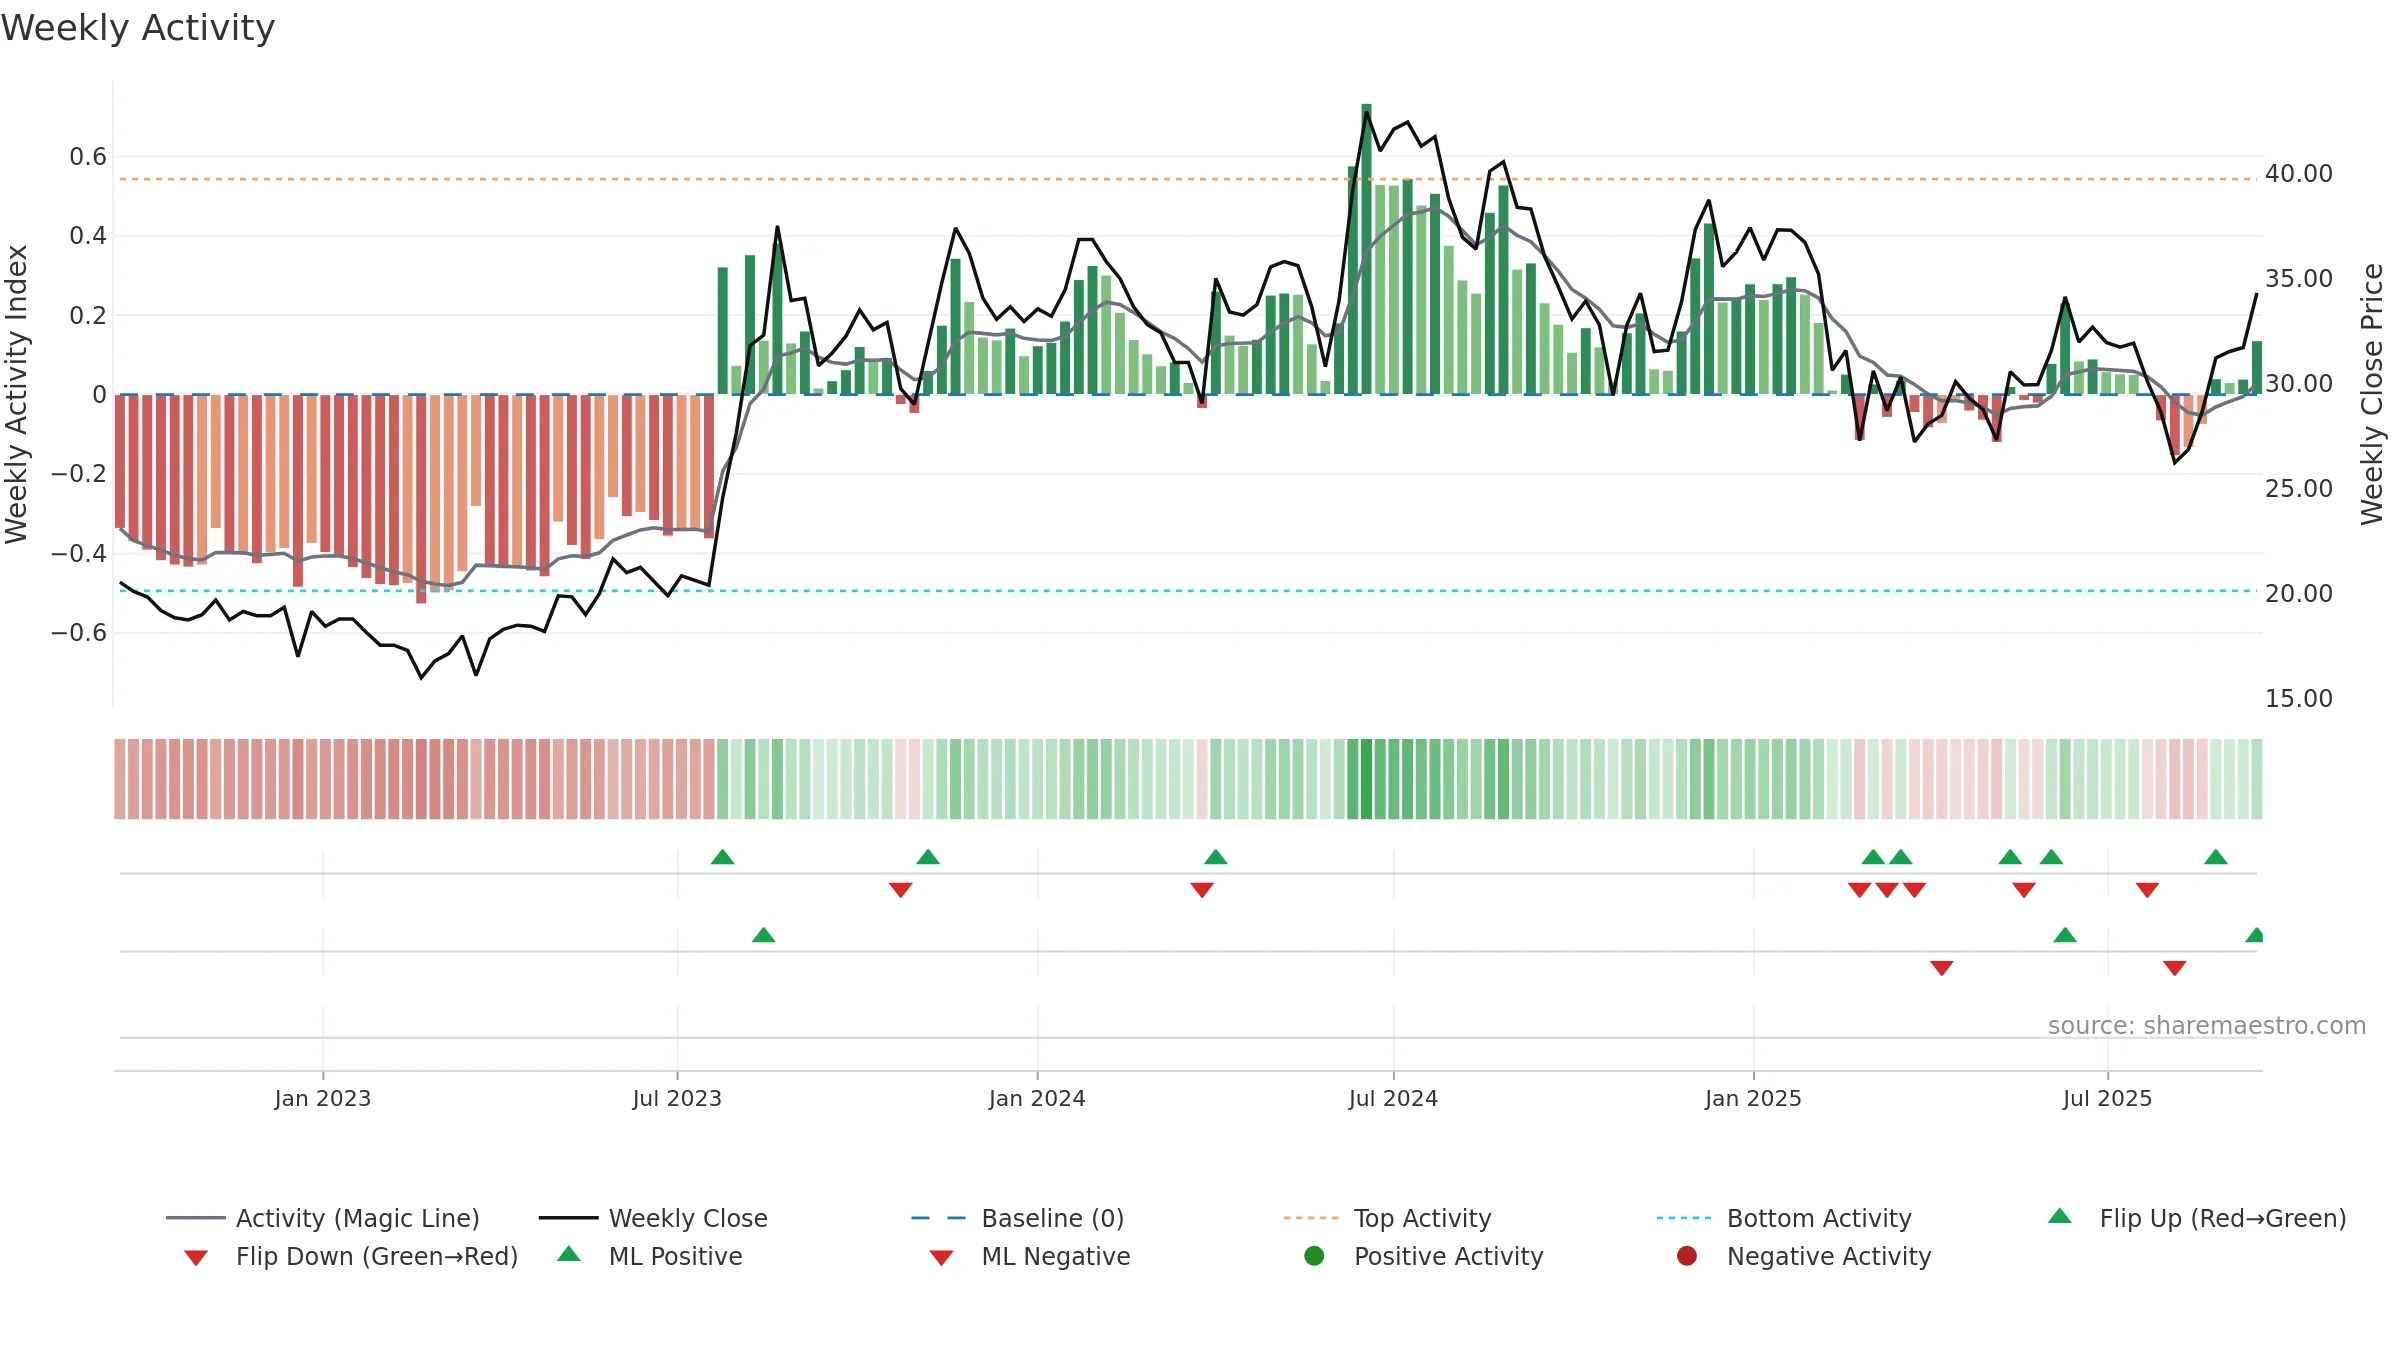
How to read this — Price slope is upward, indicating persistent buying over the window. Volume trend diverges from price — watch for fatigue or rotation. Price is stretched above its baseline; consolidation risk rises if activity fades. Price holds above key averages, indicating constructive participation.
Up-slope supports buying interest; pullbacks may be contained if activity stays firm. Because liquidity isn’t confirming, prefer evidence of fresh demand before chasing moves.
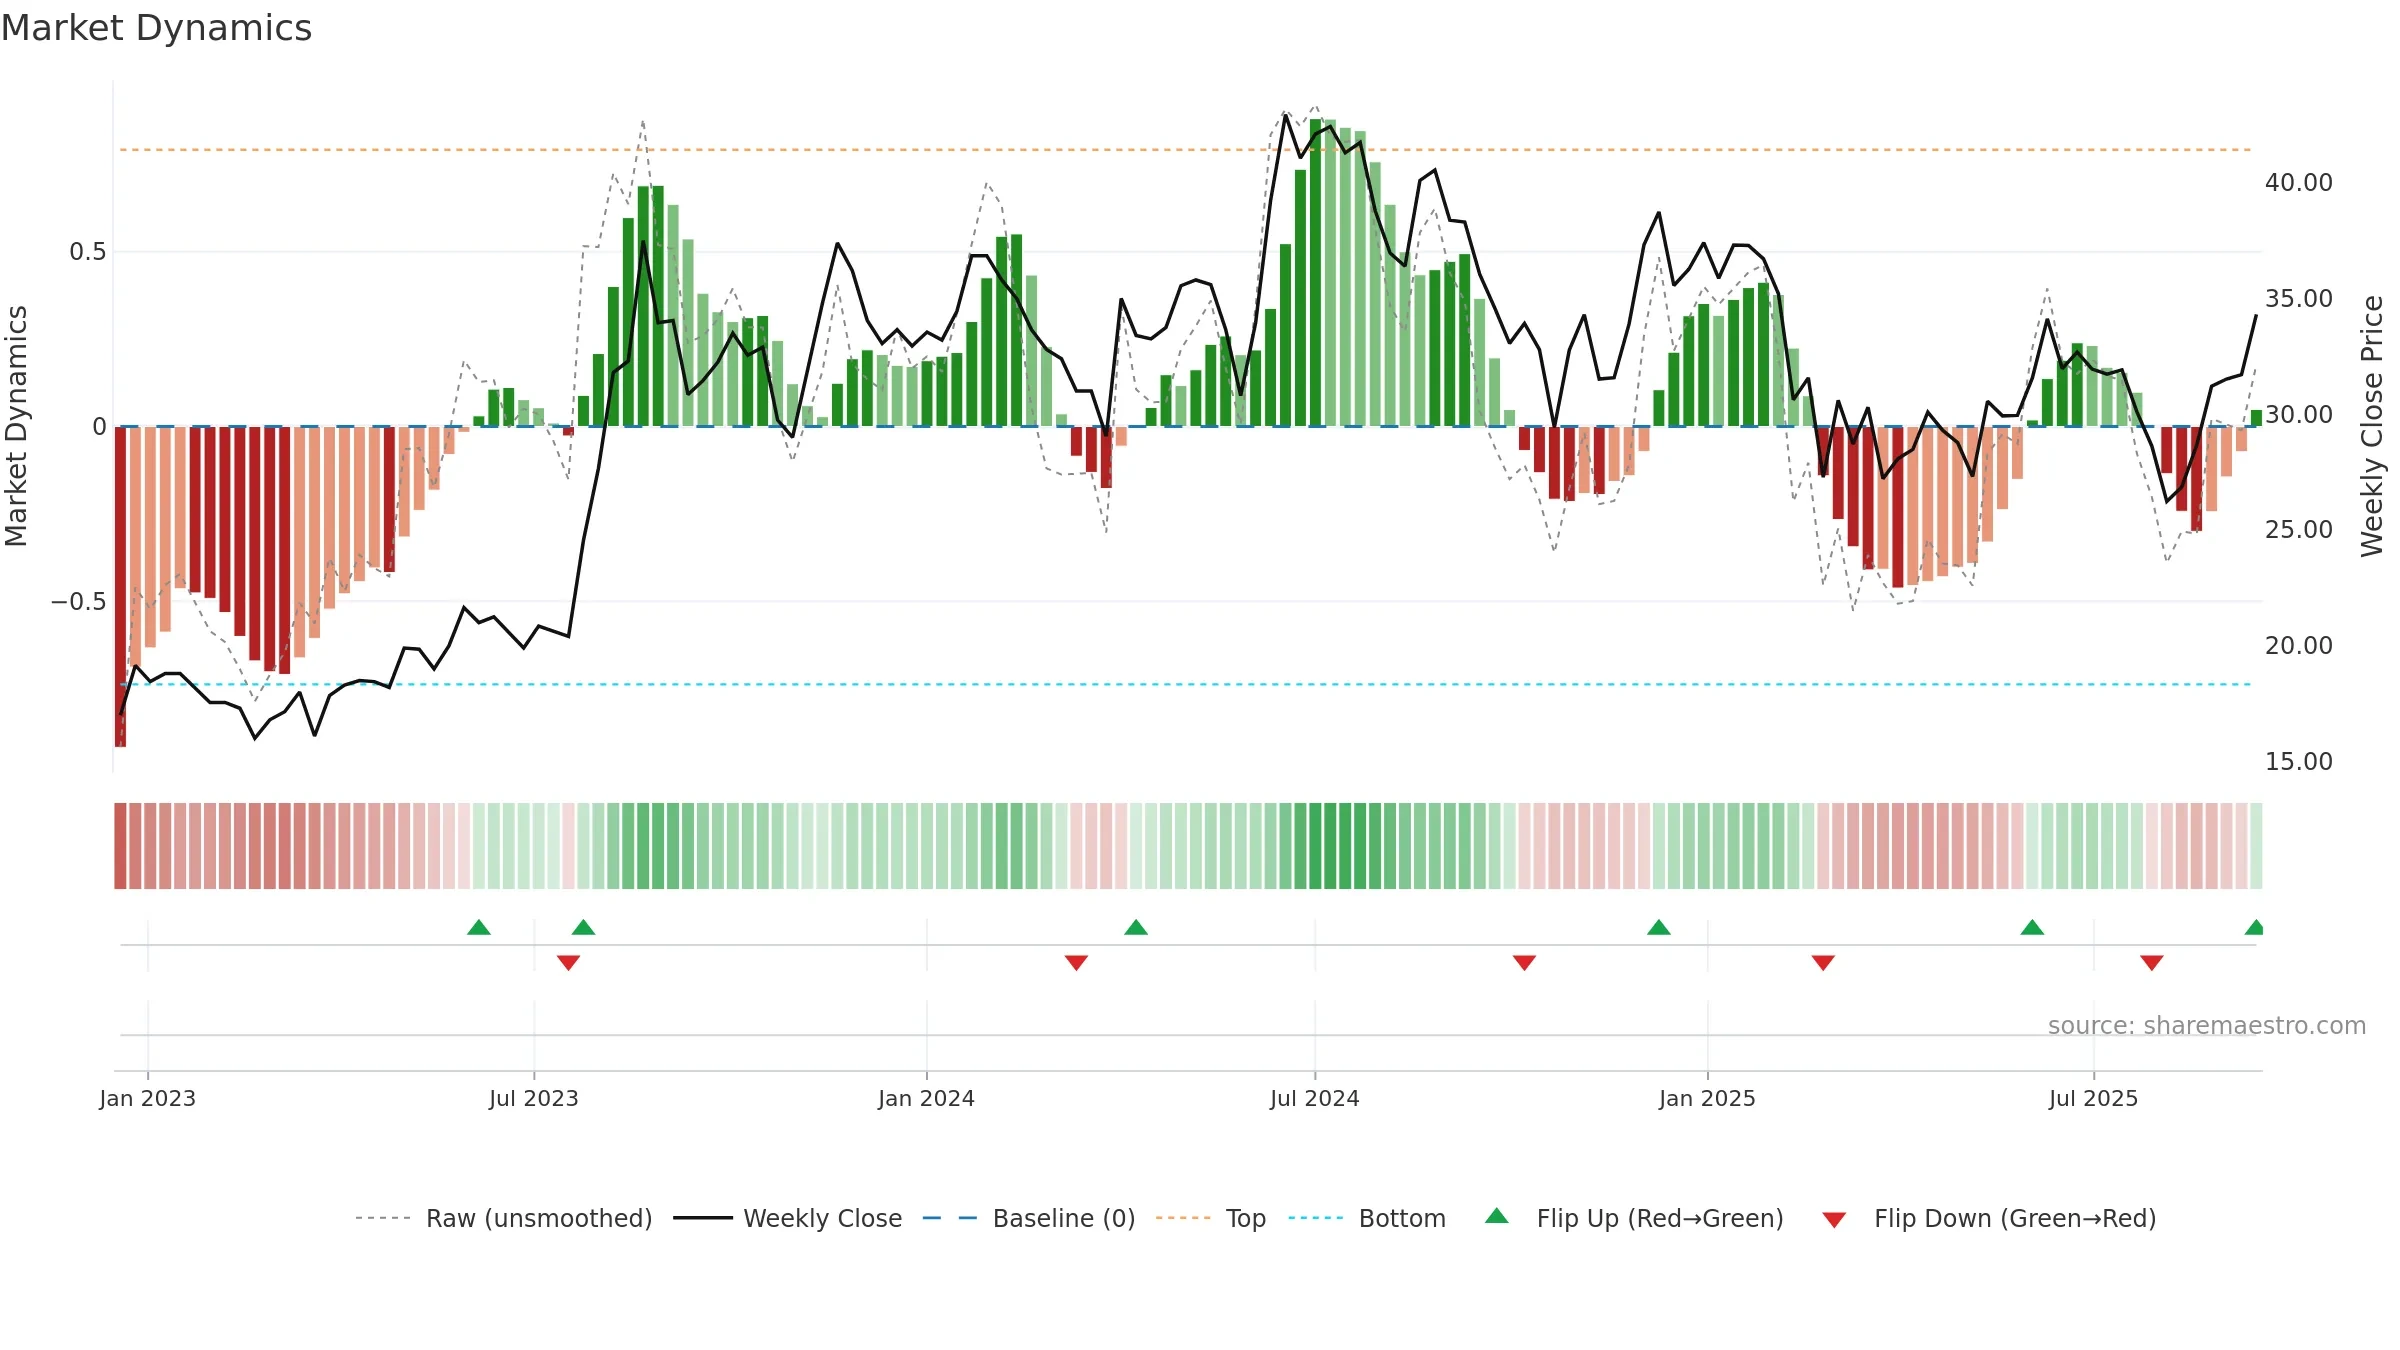
Gauge maps the trend signal to a 0–100 scale.
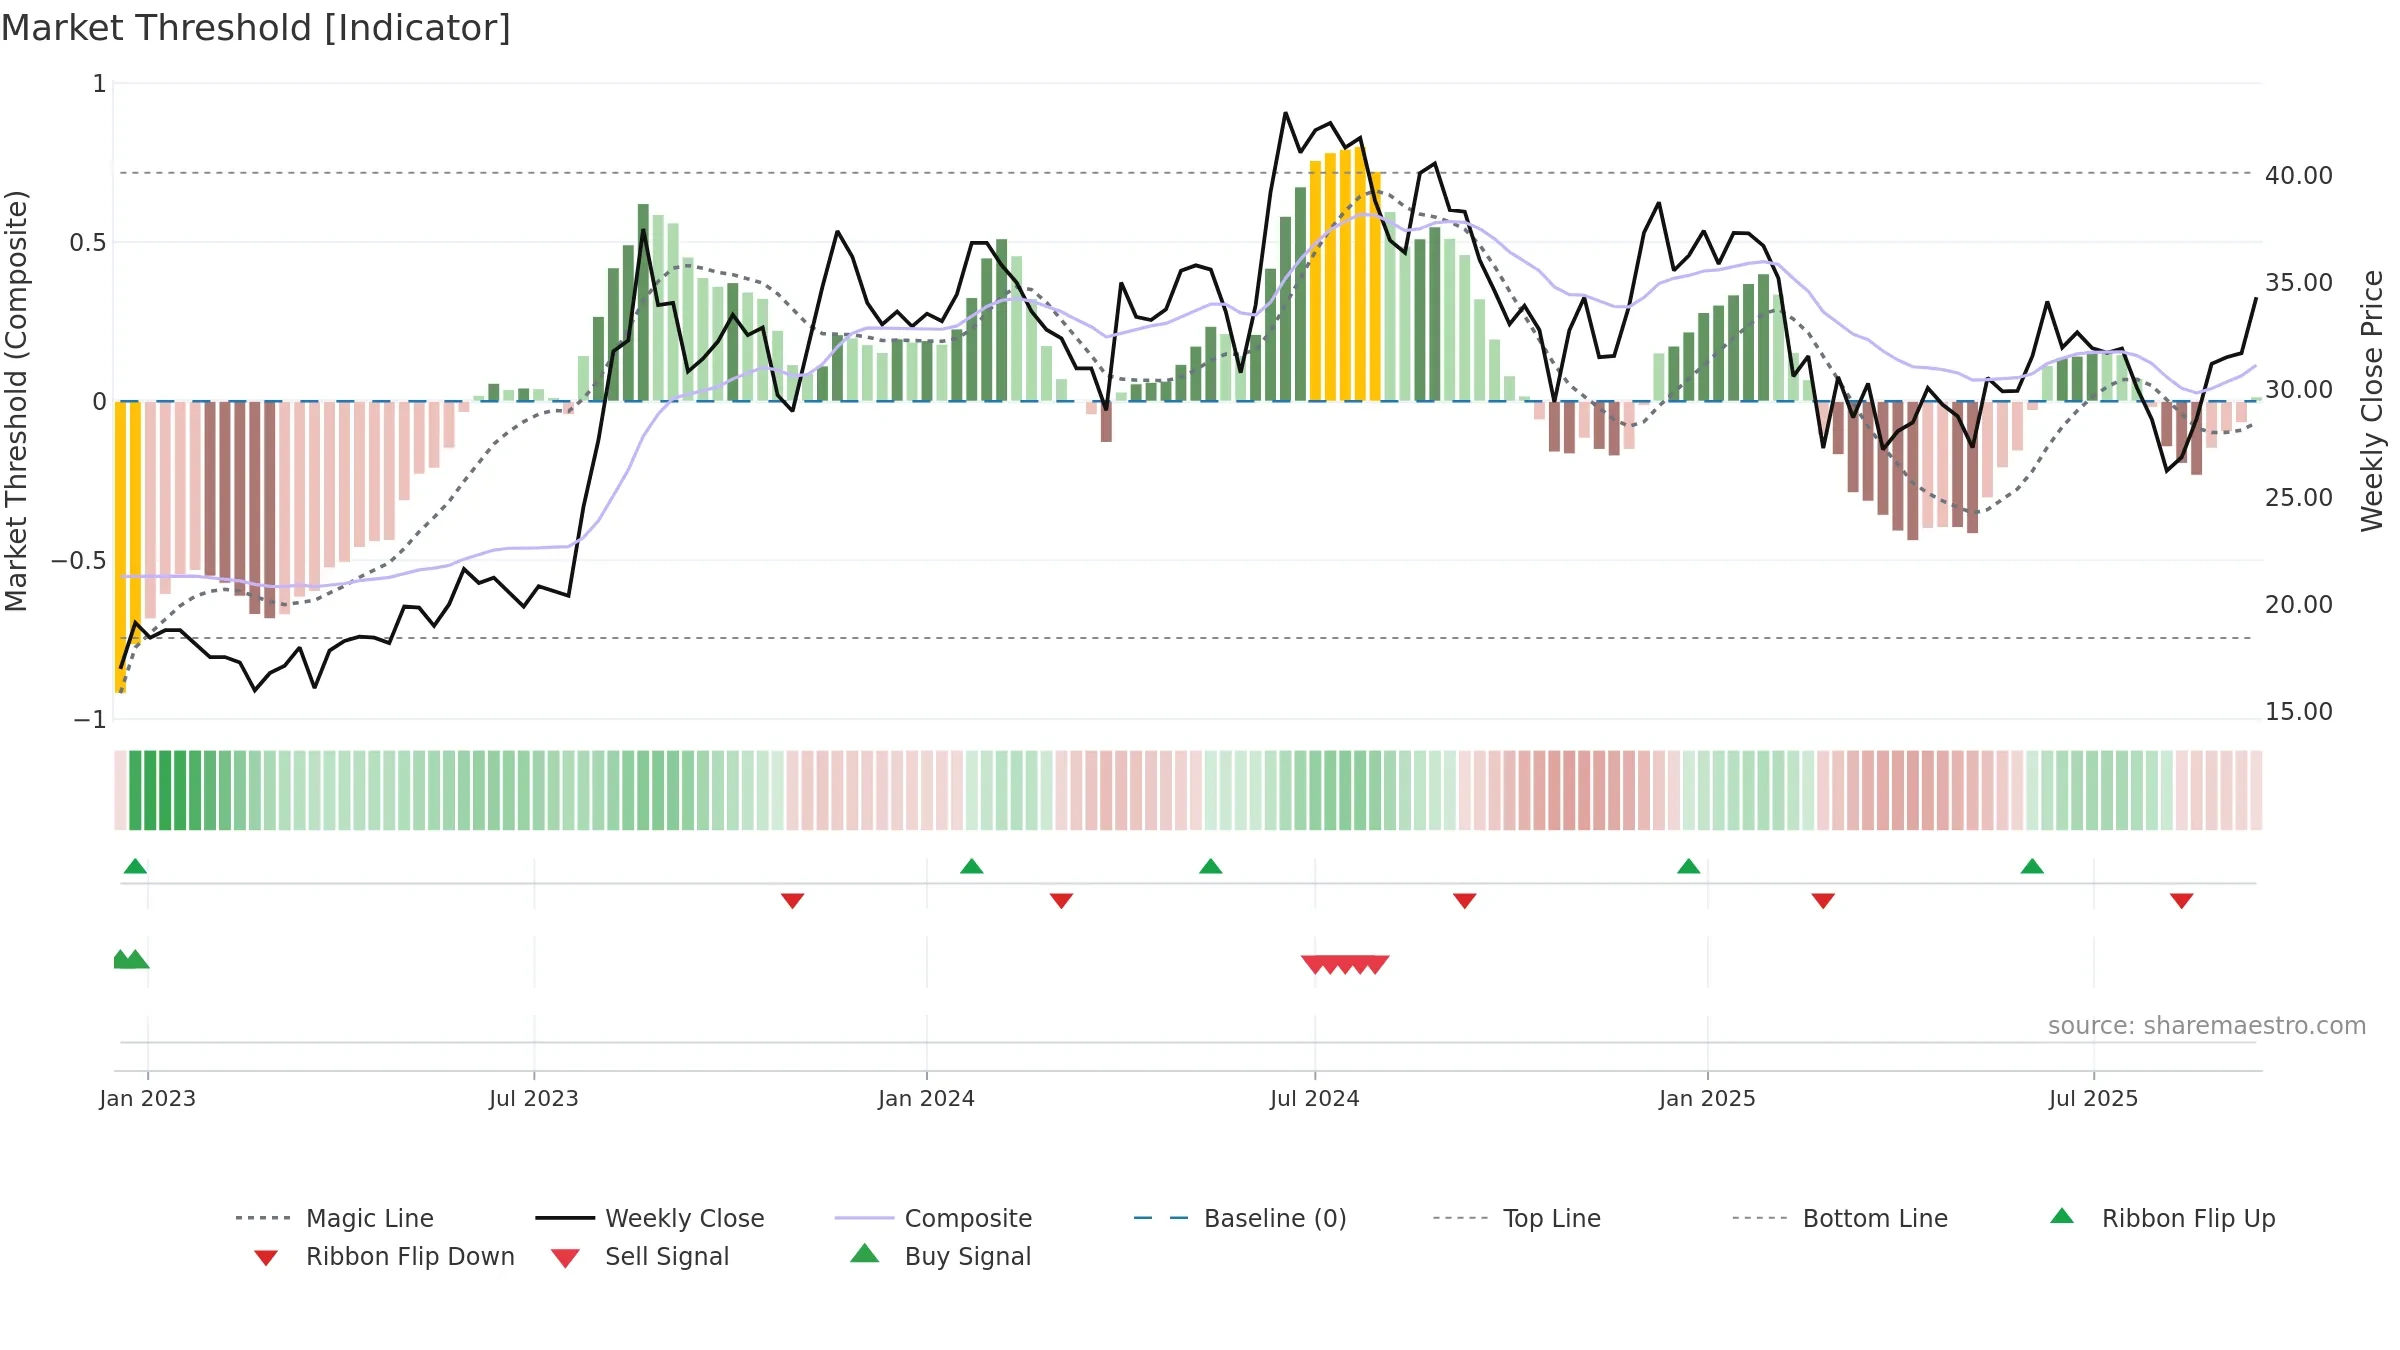
How to read this — Range-bound conditions; conviction is limited until a break or acceleration emerges. Sub-0.40 print confirms downside control.
Wait for a directional break or improving acceleration.
Price is above fair value; upside may be capped without catalysts.
Conclusion
Positive setup. ★★★★☆ confidence. Price window: 19. Trend: Range / Neutral; gauge 49. In combination, liquidity diverges from price.
- Price holds above 8w & 26w averages
- Solid multi-week performance
- Liquidity diverges from price
- Sub-0.40 print confirms bear control
Why: Price window 19.88% over 8w. Close is 8.20% above the prior-window high. Volume trend falling. Liquidity divergence with price. Trend state range / neutral. Momentum neutral and rising. Valuation limited upside without catalysts.
Tip: Most metrics include a hover tooltip where they appear in the report.