Beijing Oriental Jicheng Co., Ltd.
002819 SHE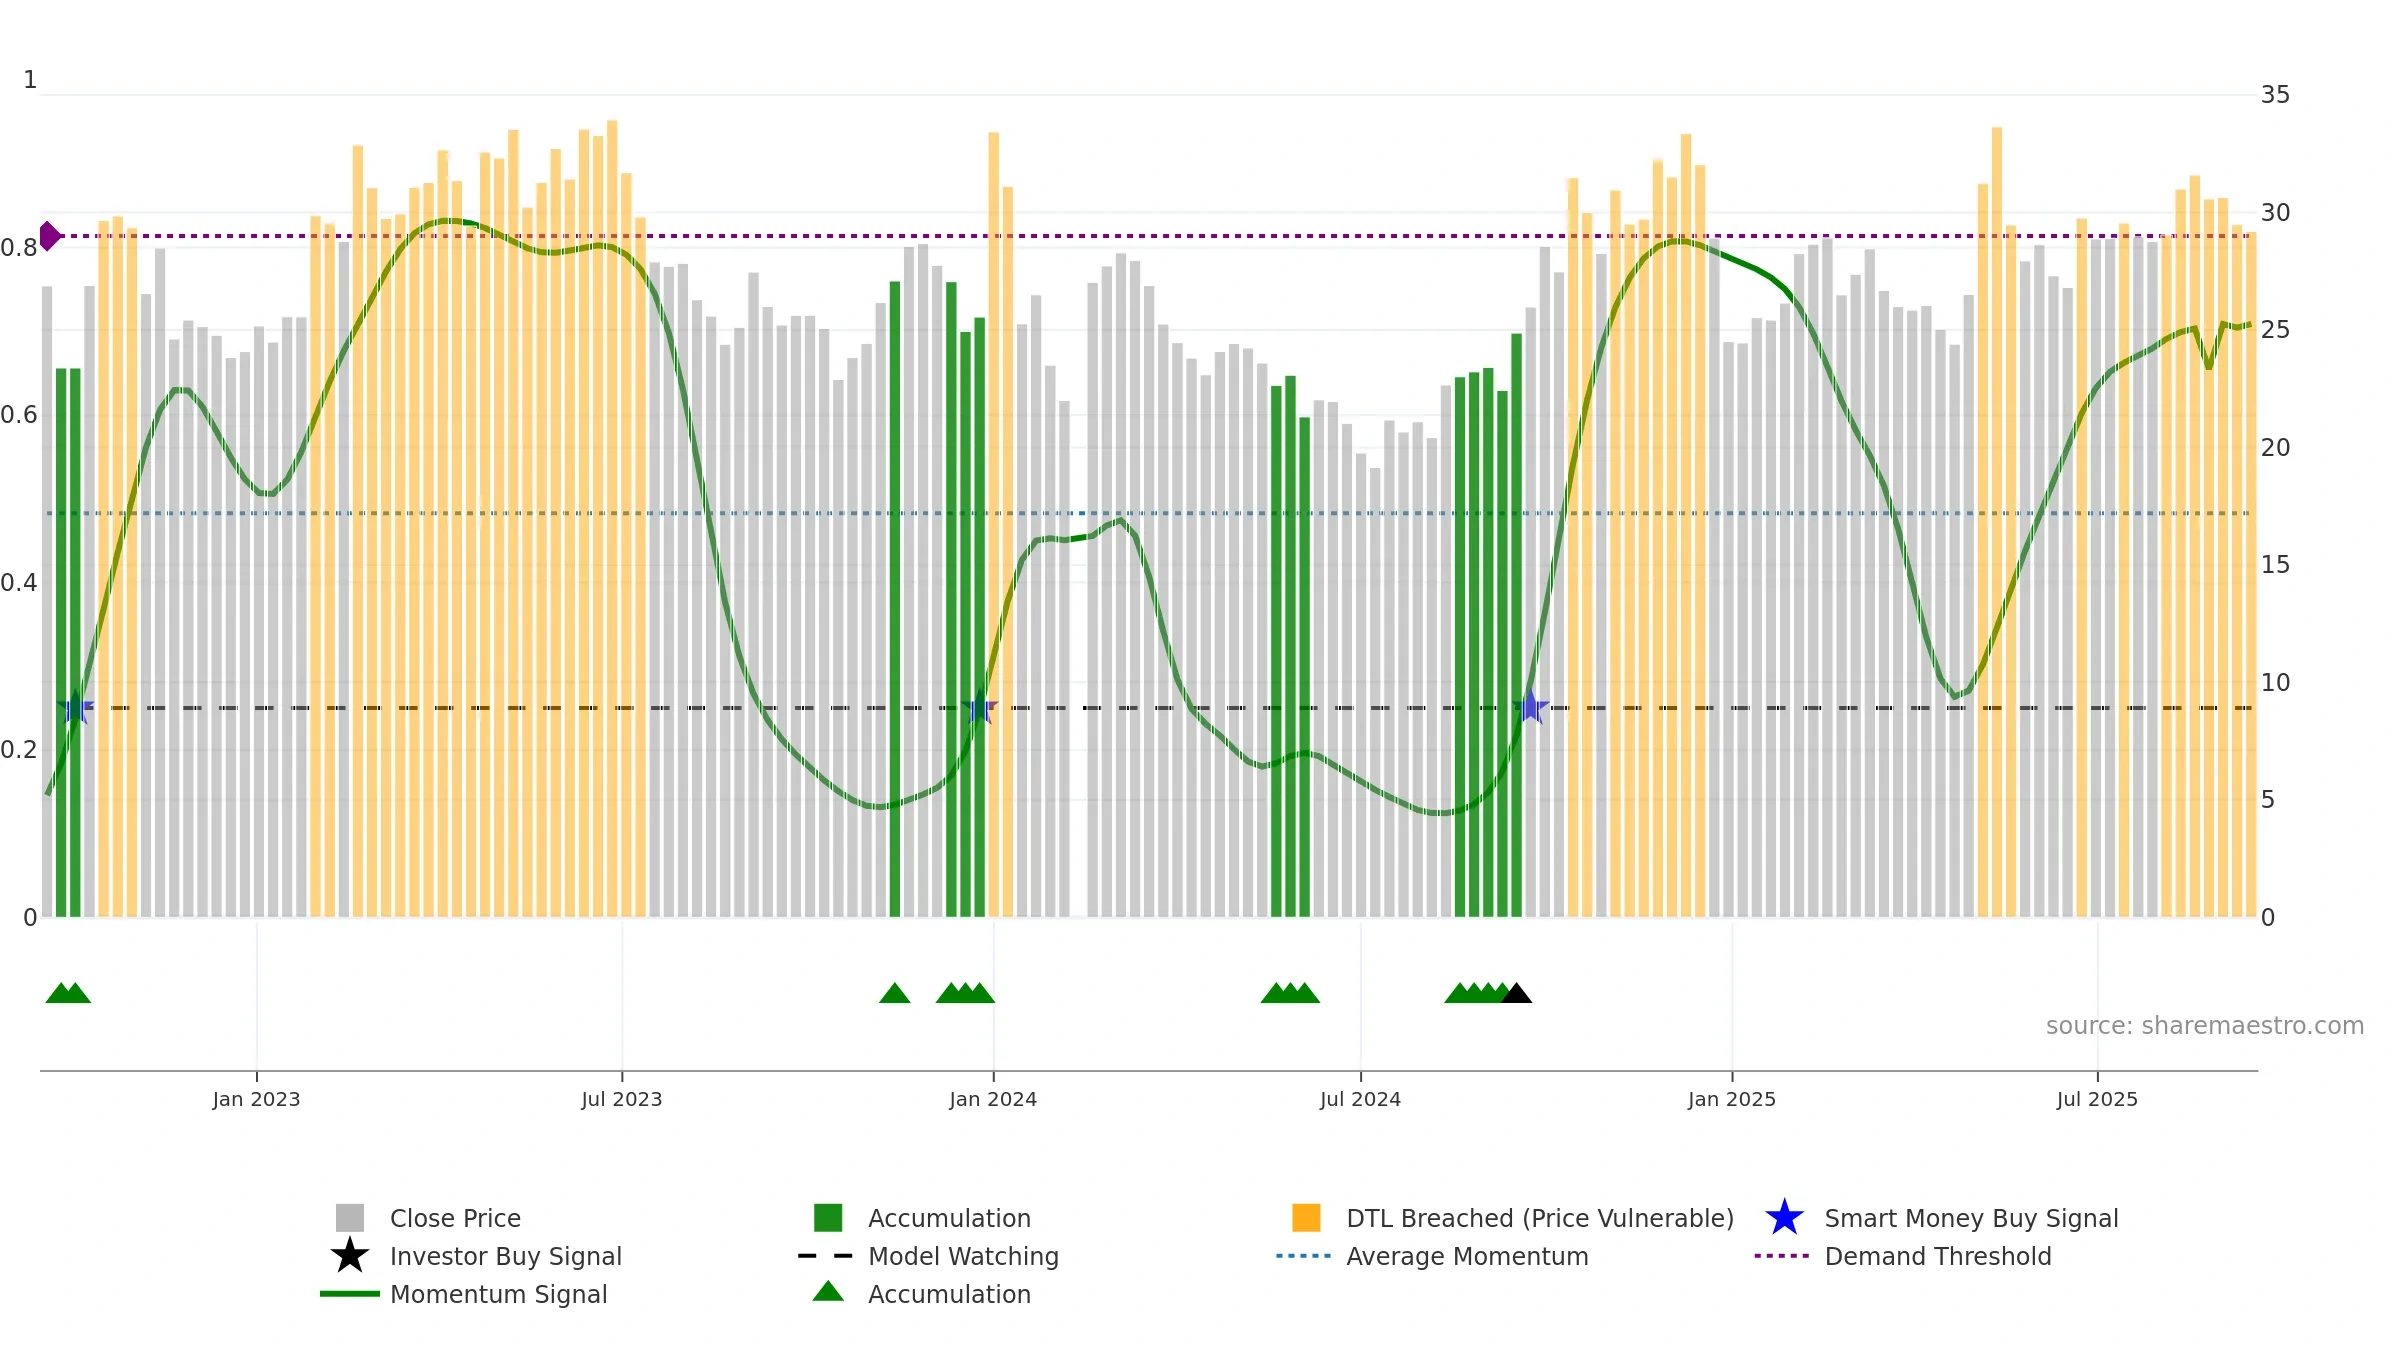
Weekly Report
Beijing Oriental Jicheng Co., Ltd. closed at 29.1900 (-1.12% WoW) . Data window ends Mon, 15 Sep 2025.
How to read this — Price slope is upward, indicating persistent buying over the window. Volume trend diverges from price — watch for fatigue or rotation. Fresh short-term downside crossover weakens near-term tone.
Up-slope supports buying interest; pullbacks may be contained if activity stays firm. Because liquidity isn’t confirming, prefer evidence of fresh demand before chasing moves.
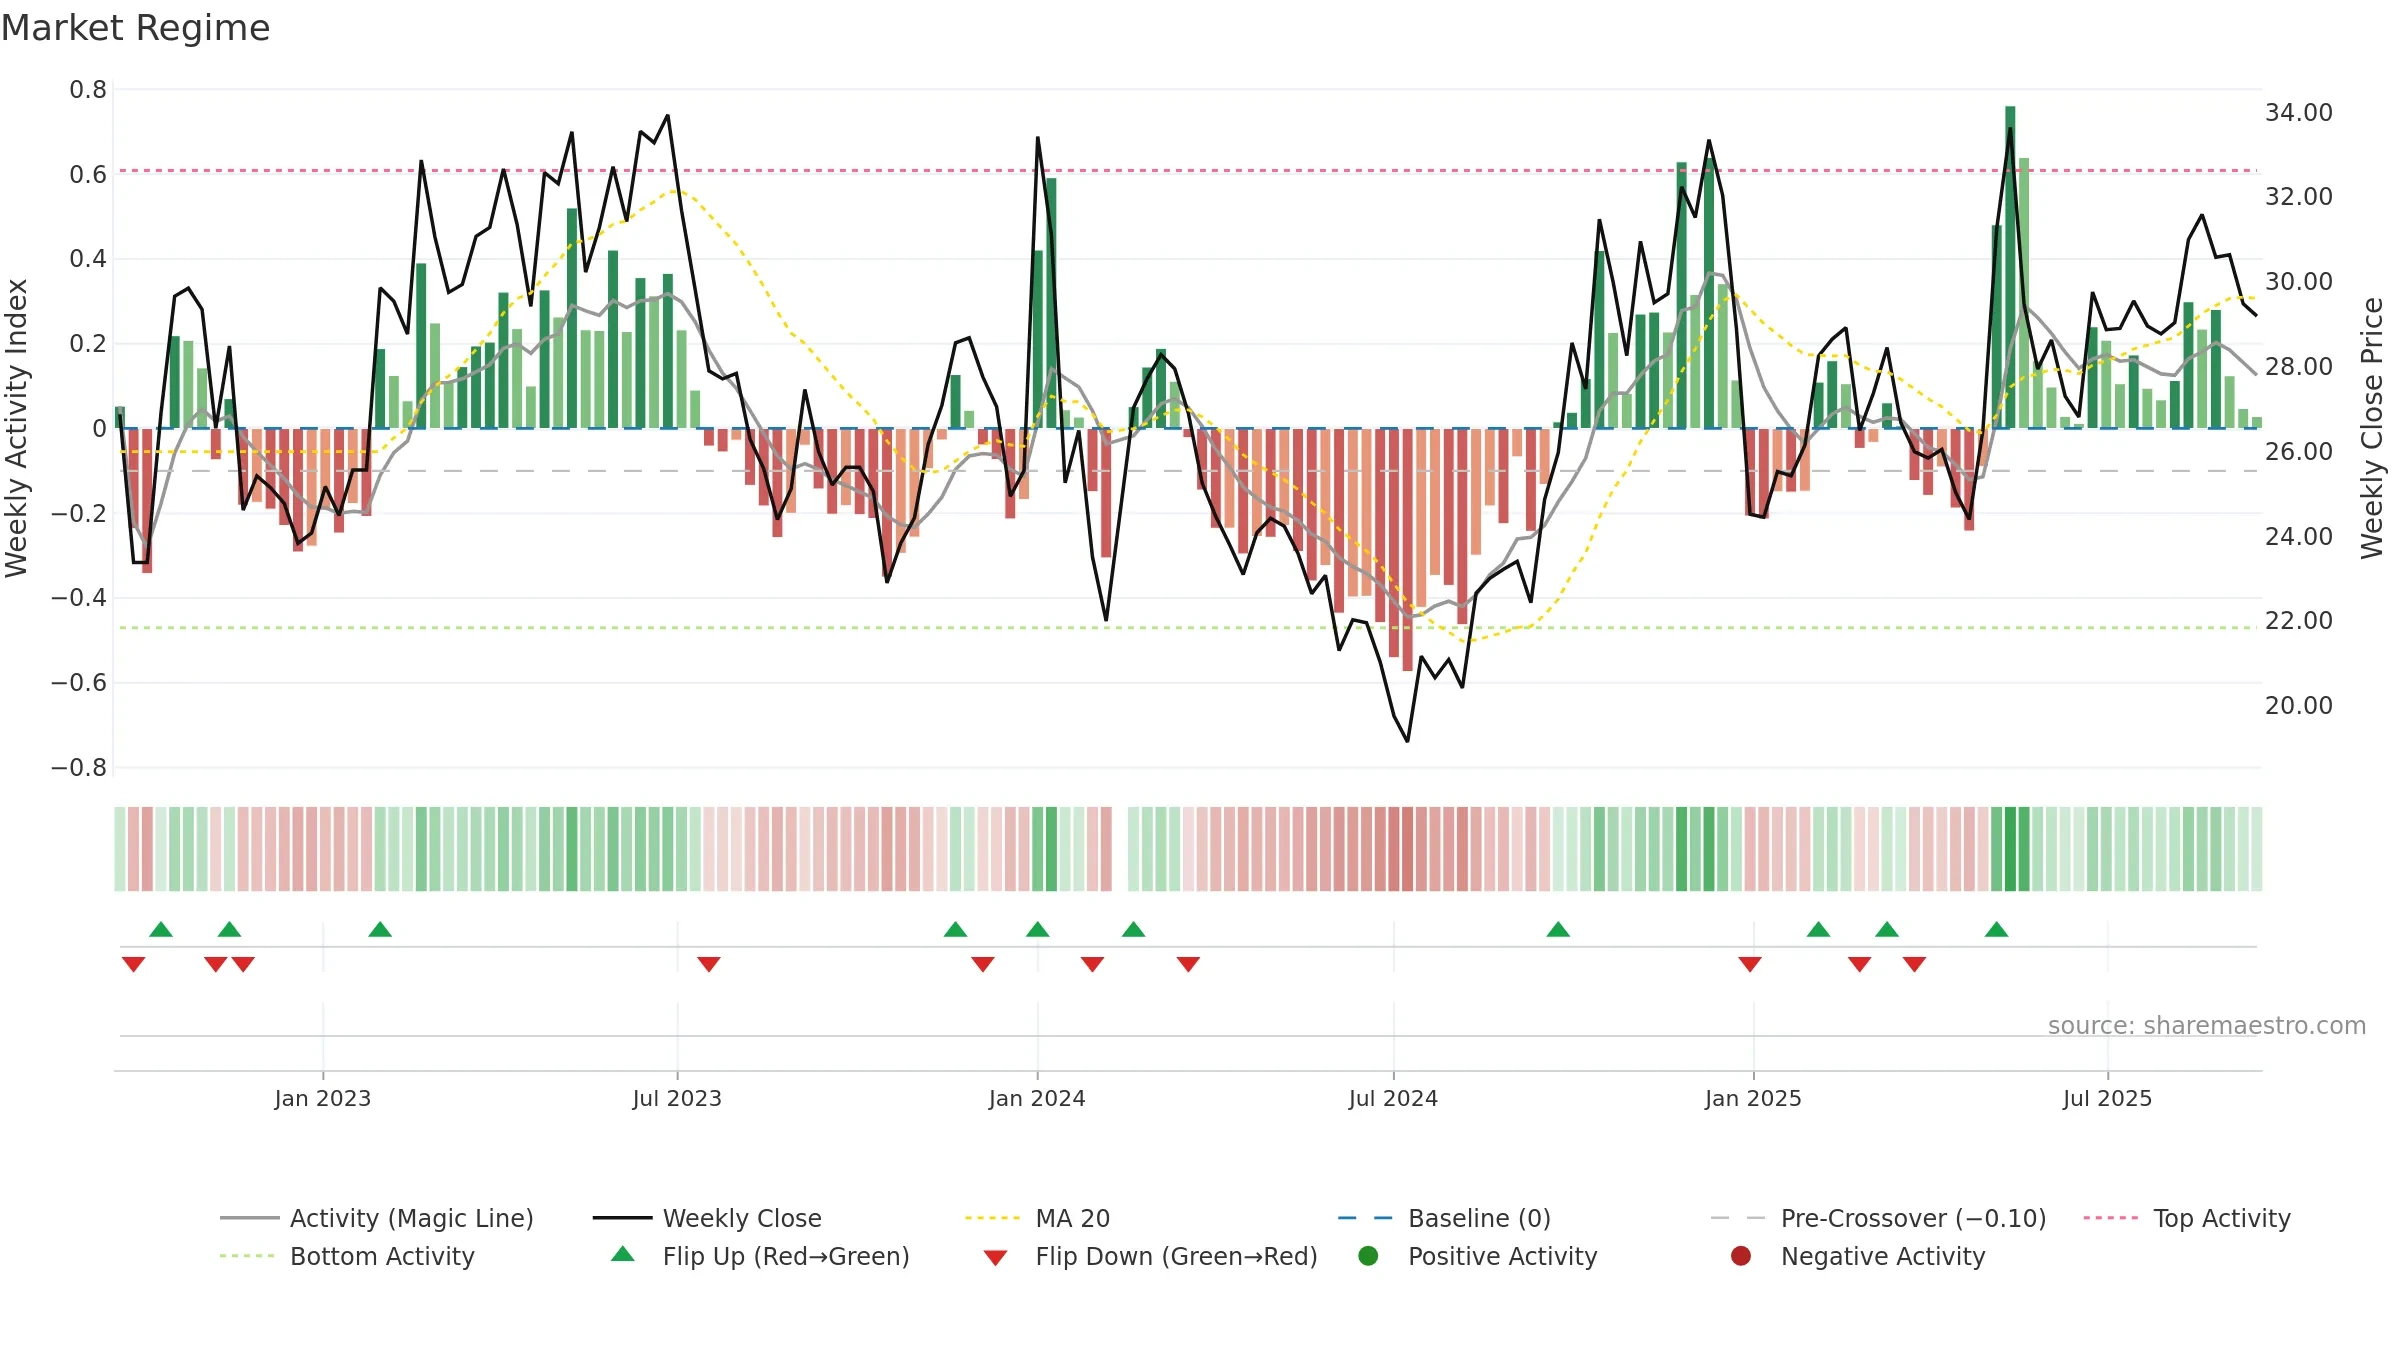
Gauge maps the trend signal to a 0–100 scale.
How to read this — High gauge and rising momentum — buyers in control.
Bias remains higher; pullbacks could be buyable if participation holds.
Conclusion
Neutral setup. ★★★☆☆ confidence. Price window: 1. Trend: Strong Uptrend; gauge 70. In combination, liquidity diverges from price.
- High gauge with rising momentum (strong uptrend)
- Momentum is bullish and rising
- Price is not above key averages
- Liquidity diverges from price
Why: Price window 1.46% over 8w. Close is -7.60% below the prior-window high. Volume trend falling. Liquidity divergence with price. Trend state strong uptrend. 4–8w crossover bearish. Momentum bullish and rising.
Tip: Most metrics include a hover tooltip where they appear in the report.