Marriott International, Inc.
MAR NASDAQ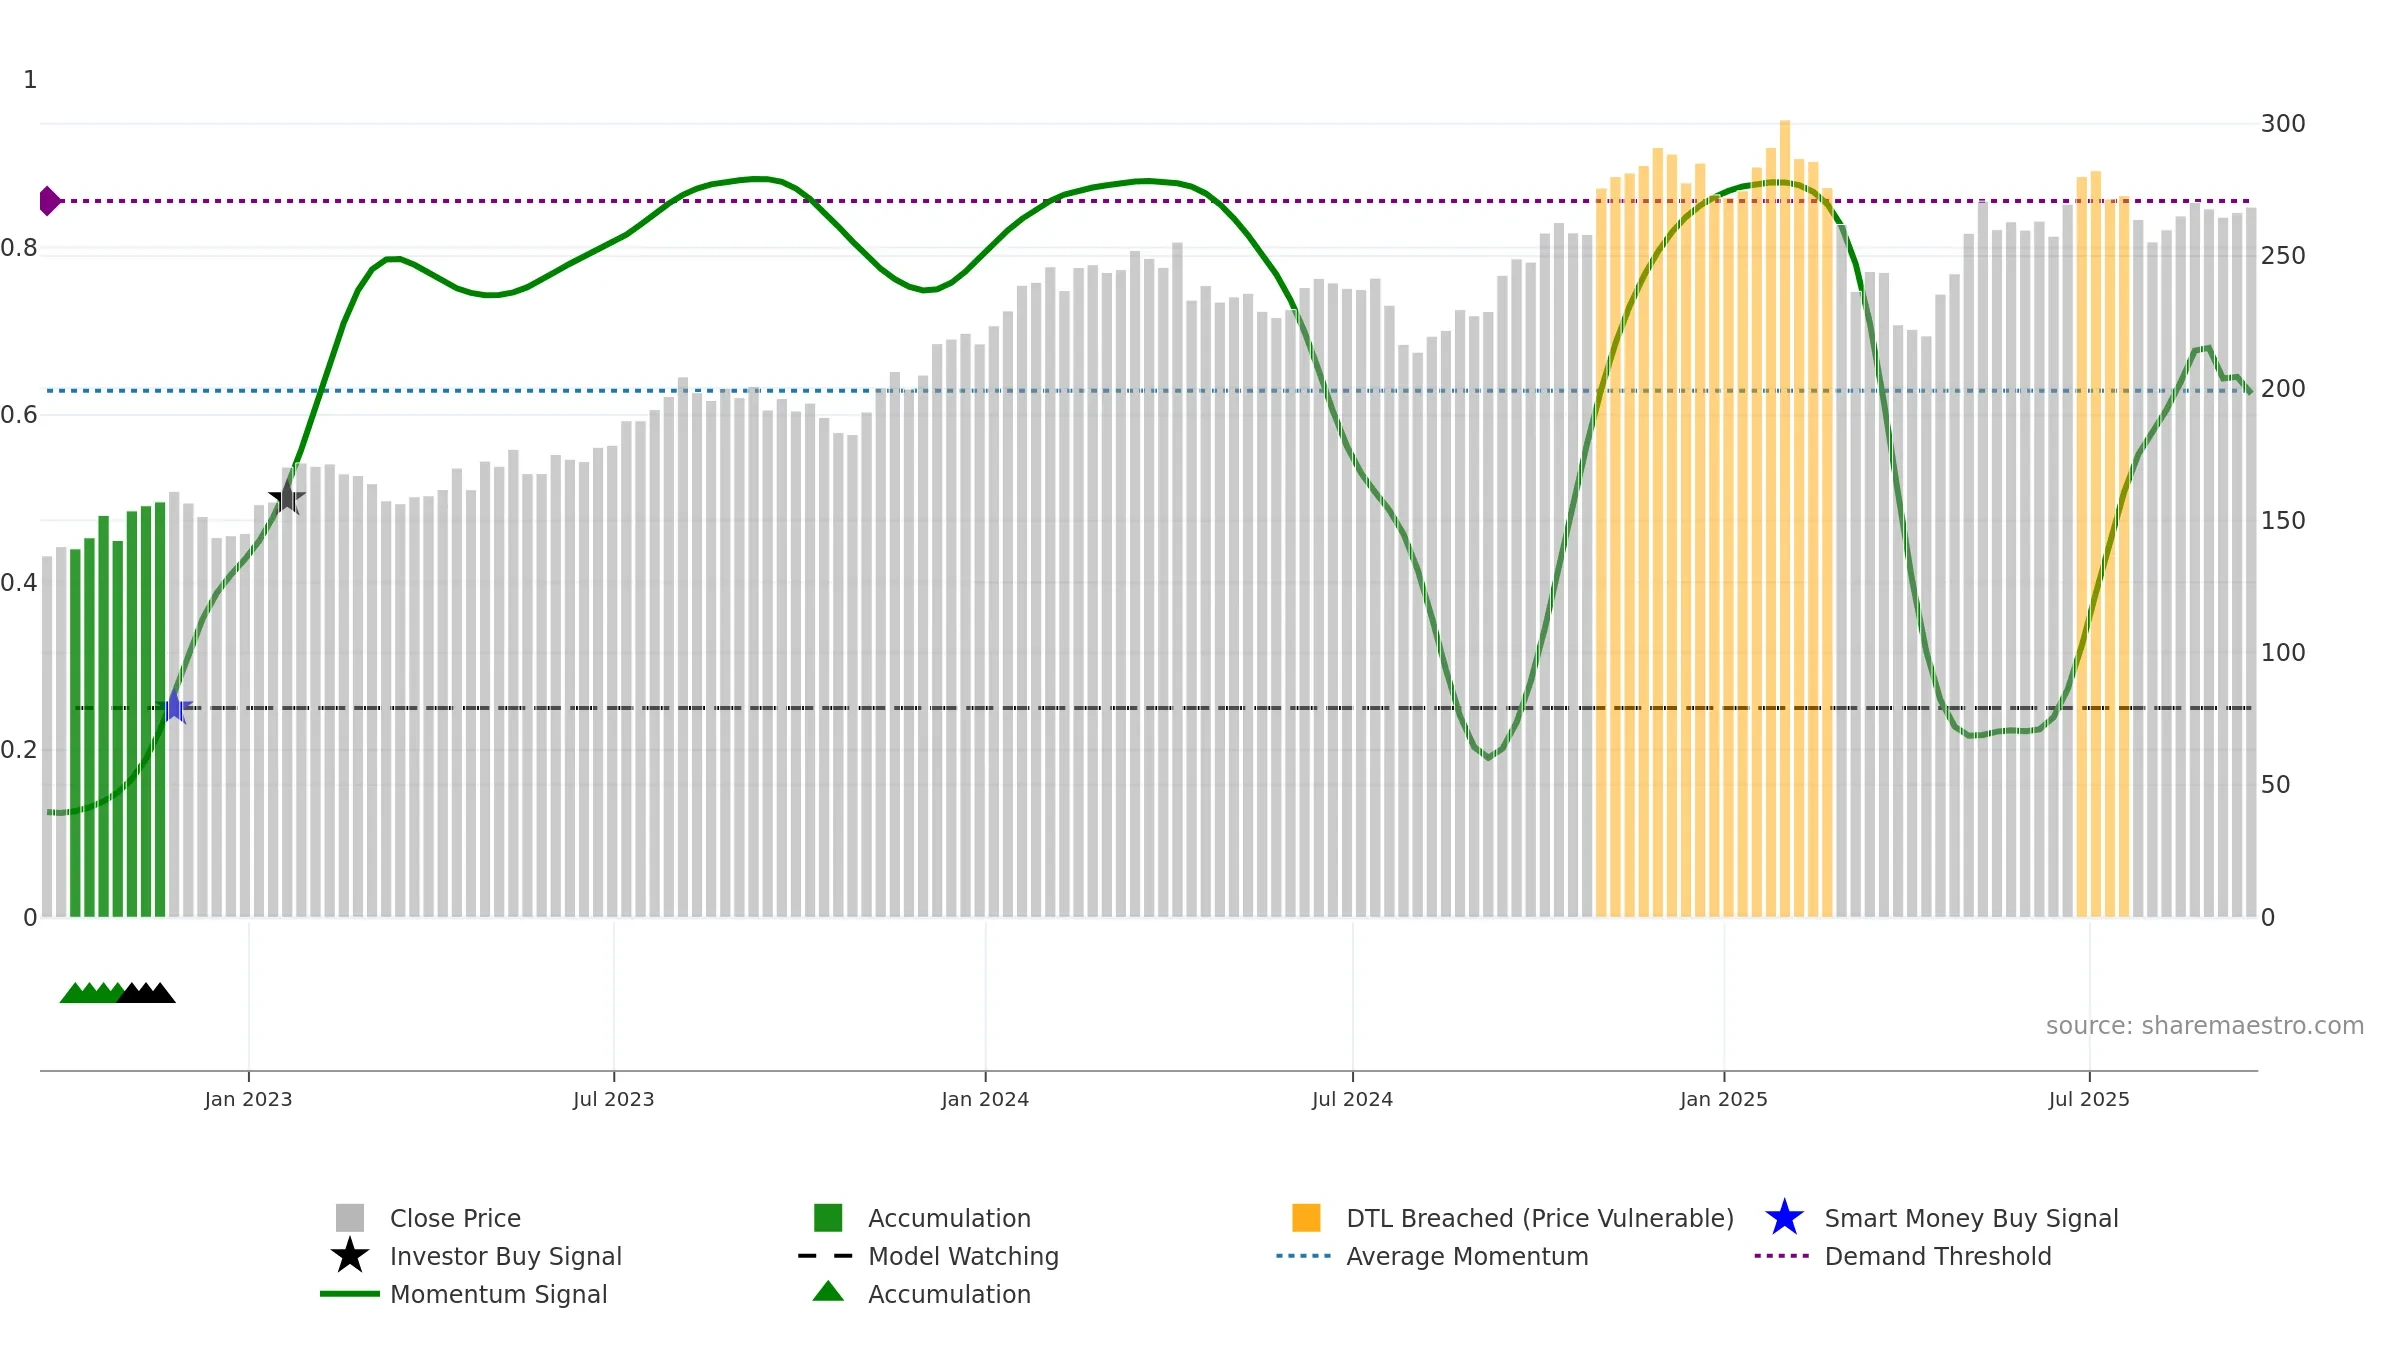
Weekly Report
Marriott International, Inc. closed at 268.5200 (1.18% WoW) . Data window ends Fri, 19 Sep 2025.
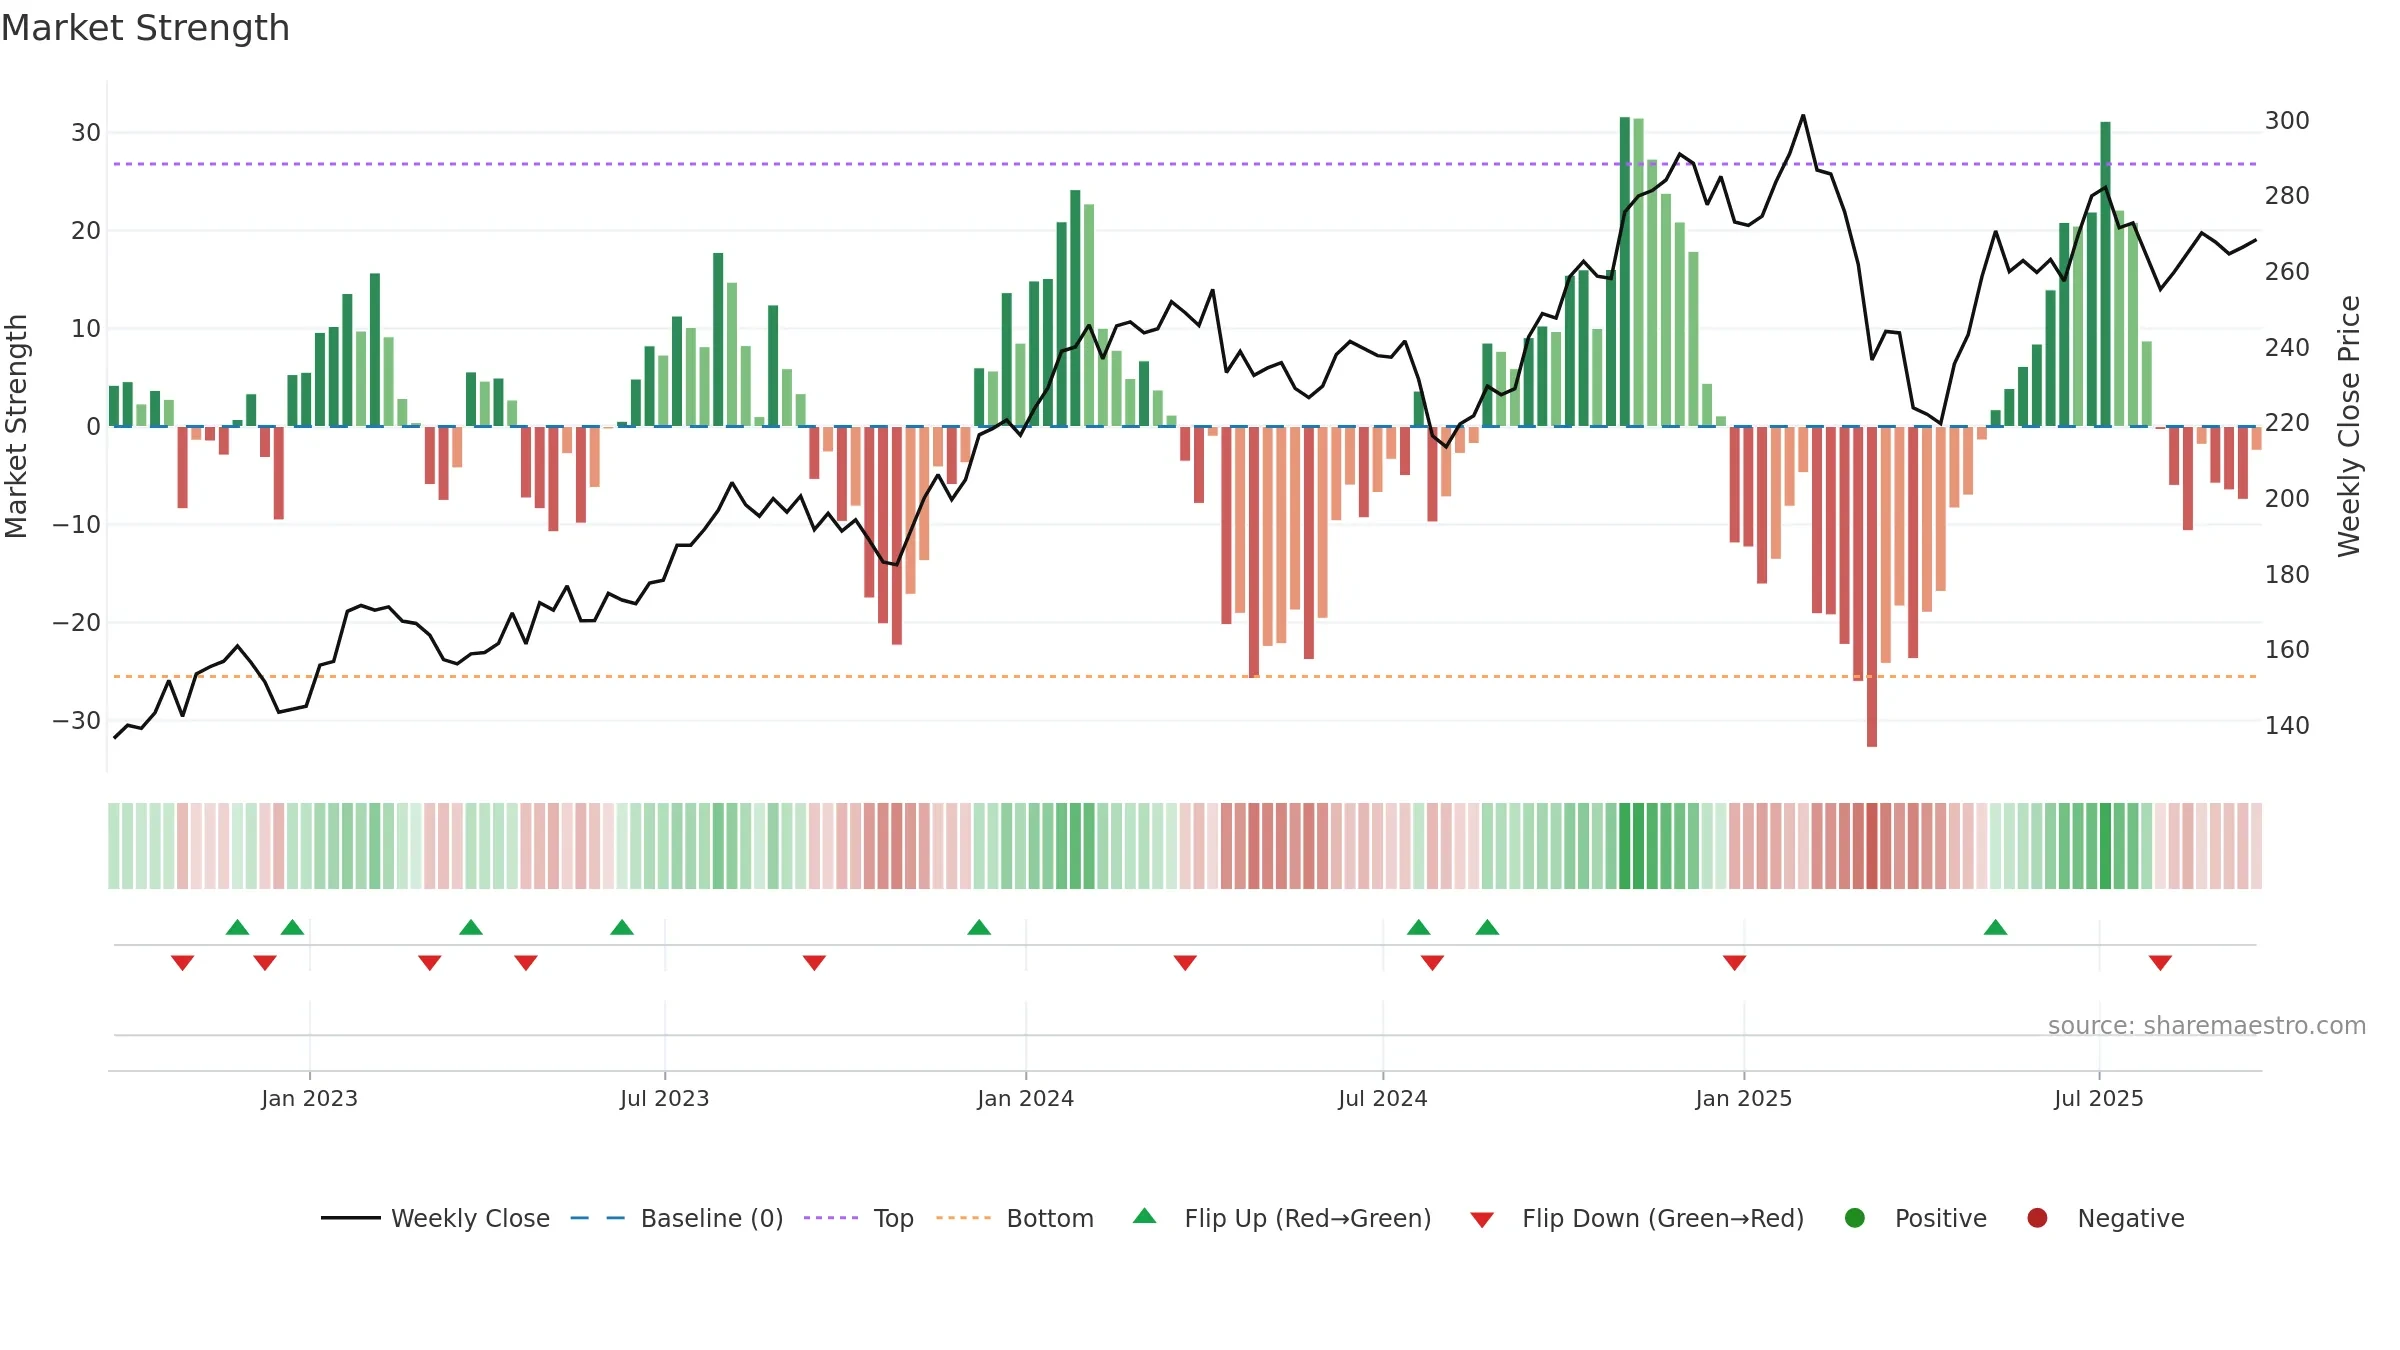
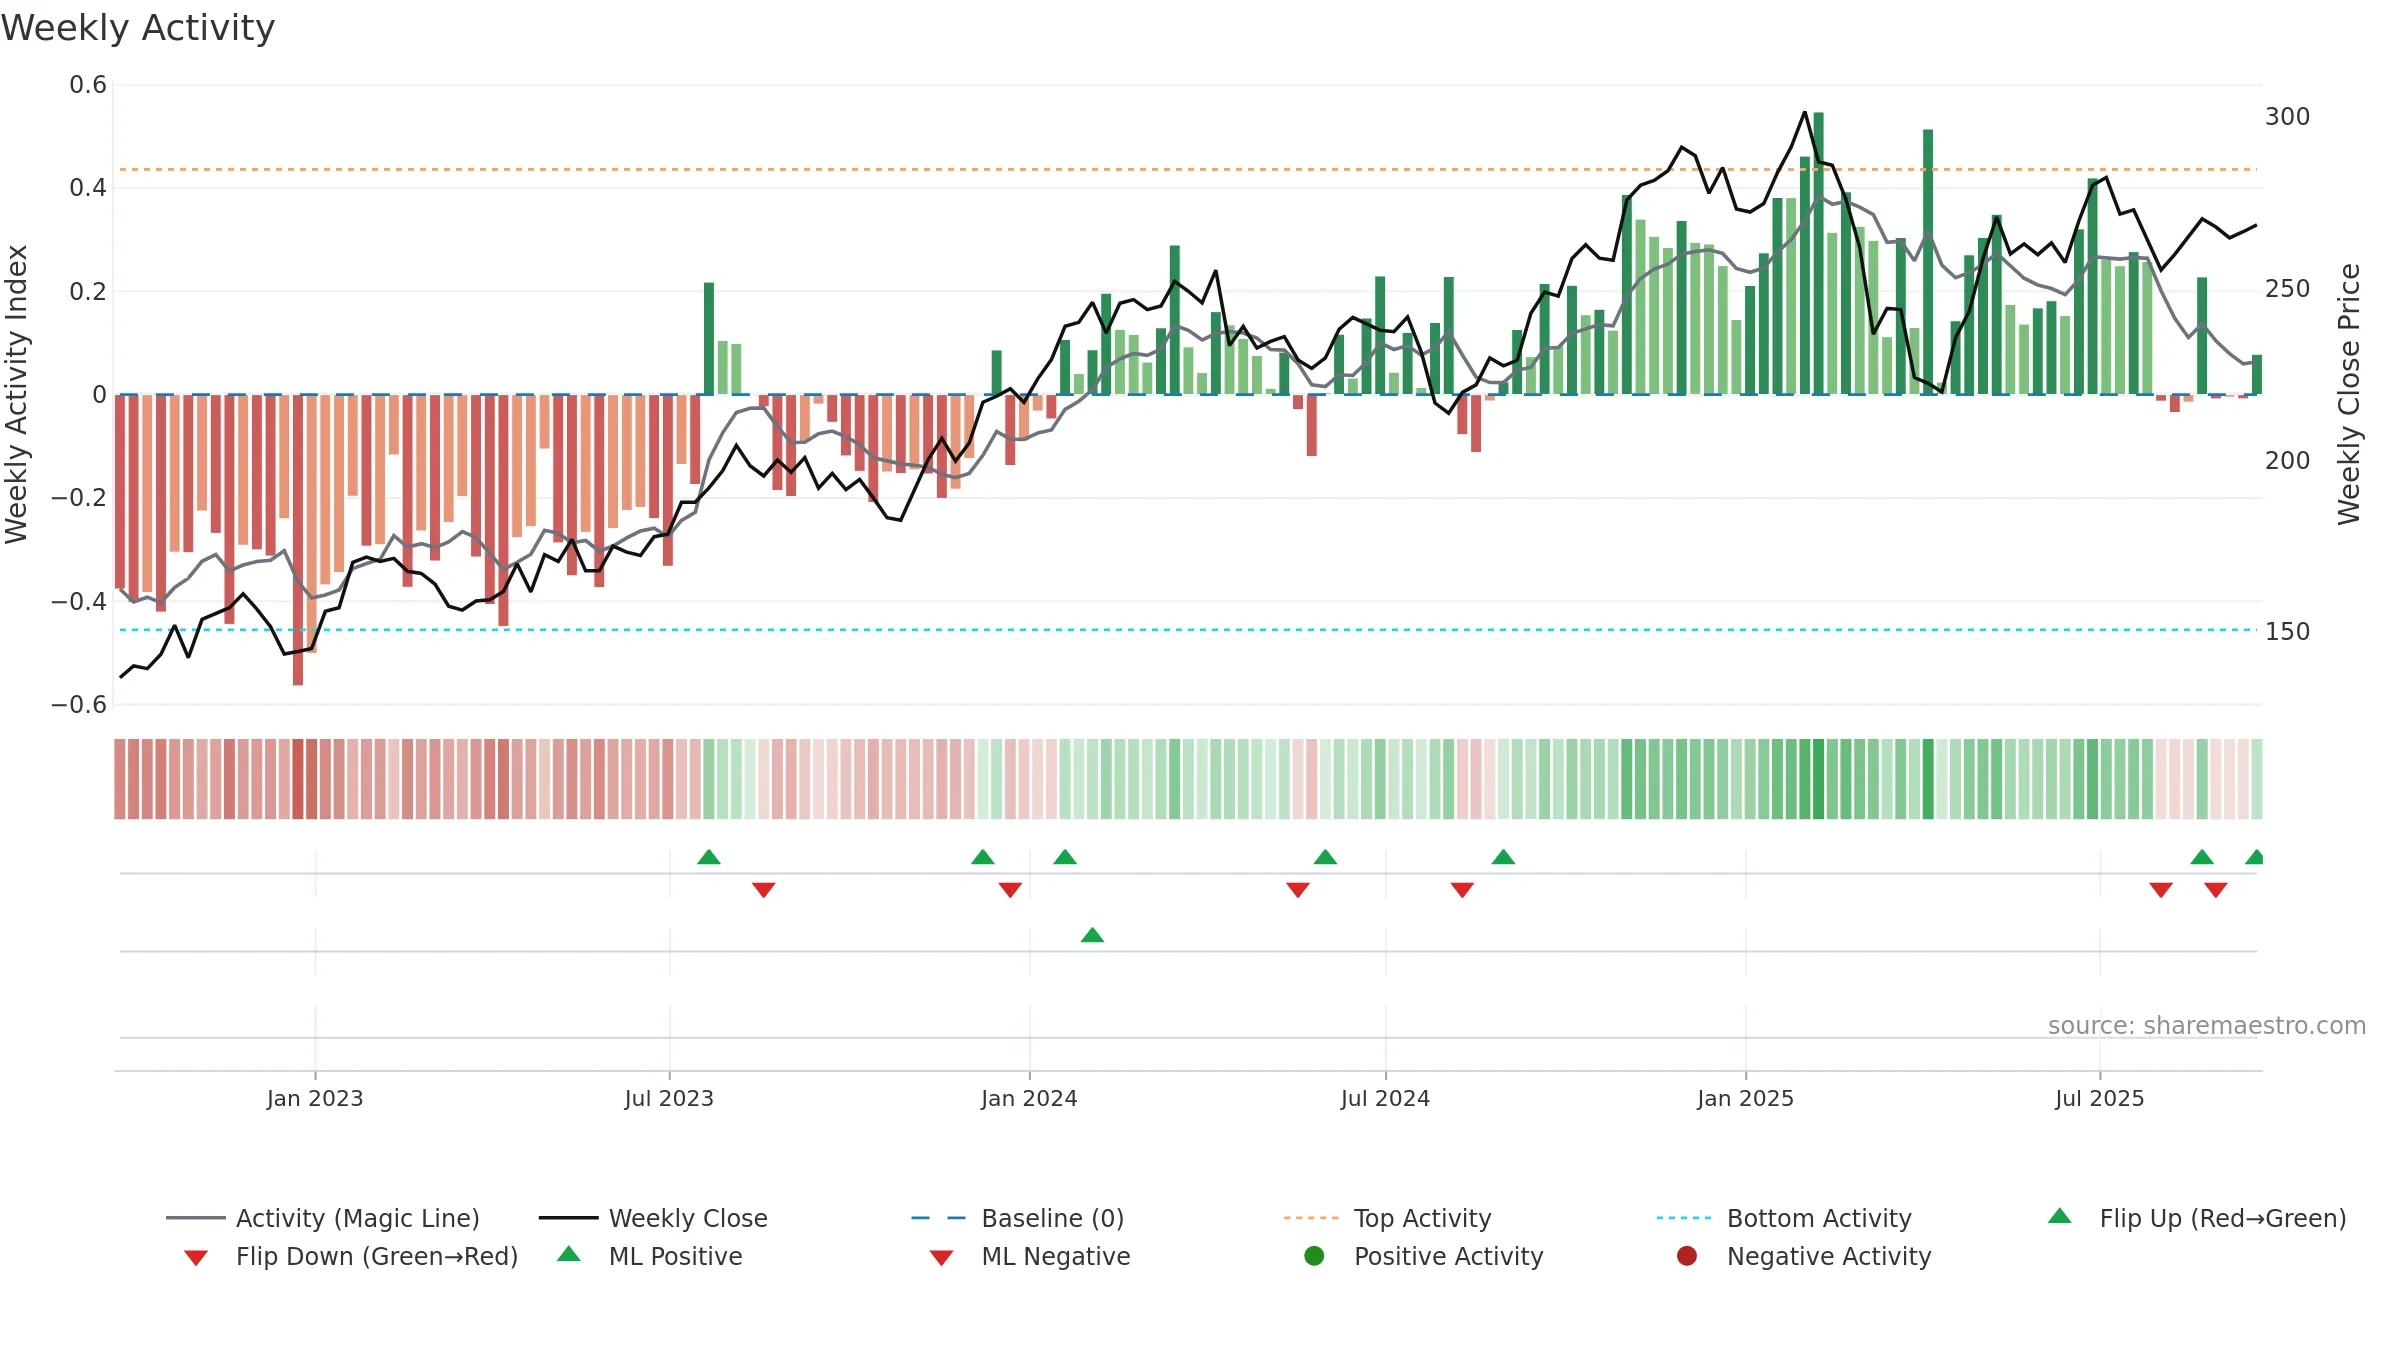
How to read this — Price slope is upward, indicating persistent buying over the window. Low weekly volatility favours steadier follow-through. Volume trend diverges from price — watch for fatigue or rotation. Returns are positively correlated with volume — strength tends to arrive on higher activity. Distance to baseline is narrowing — reverting closer to its fair-value track. Price holds above key averages, indicating constructive participation.
Up-slope supports buying interest; pullbacks may be contained if activity stays firm. Because liquidity isn’t confirming, prefer evidence of fresh demand before chasing moves.
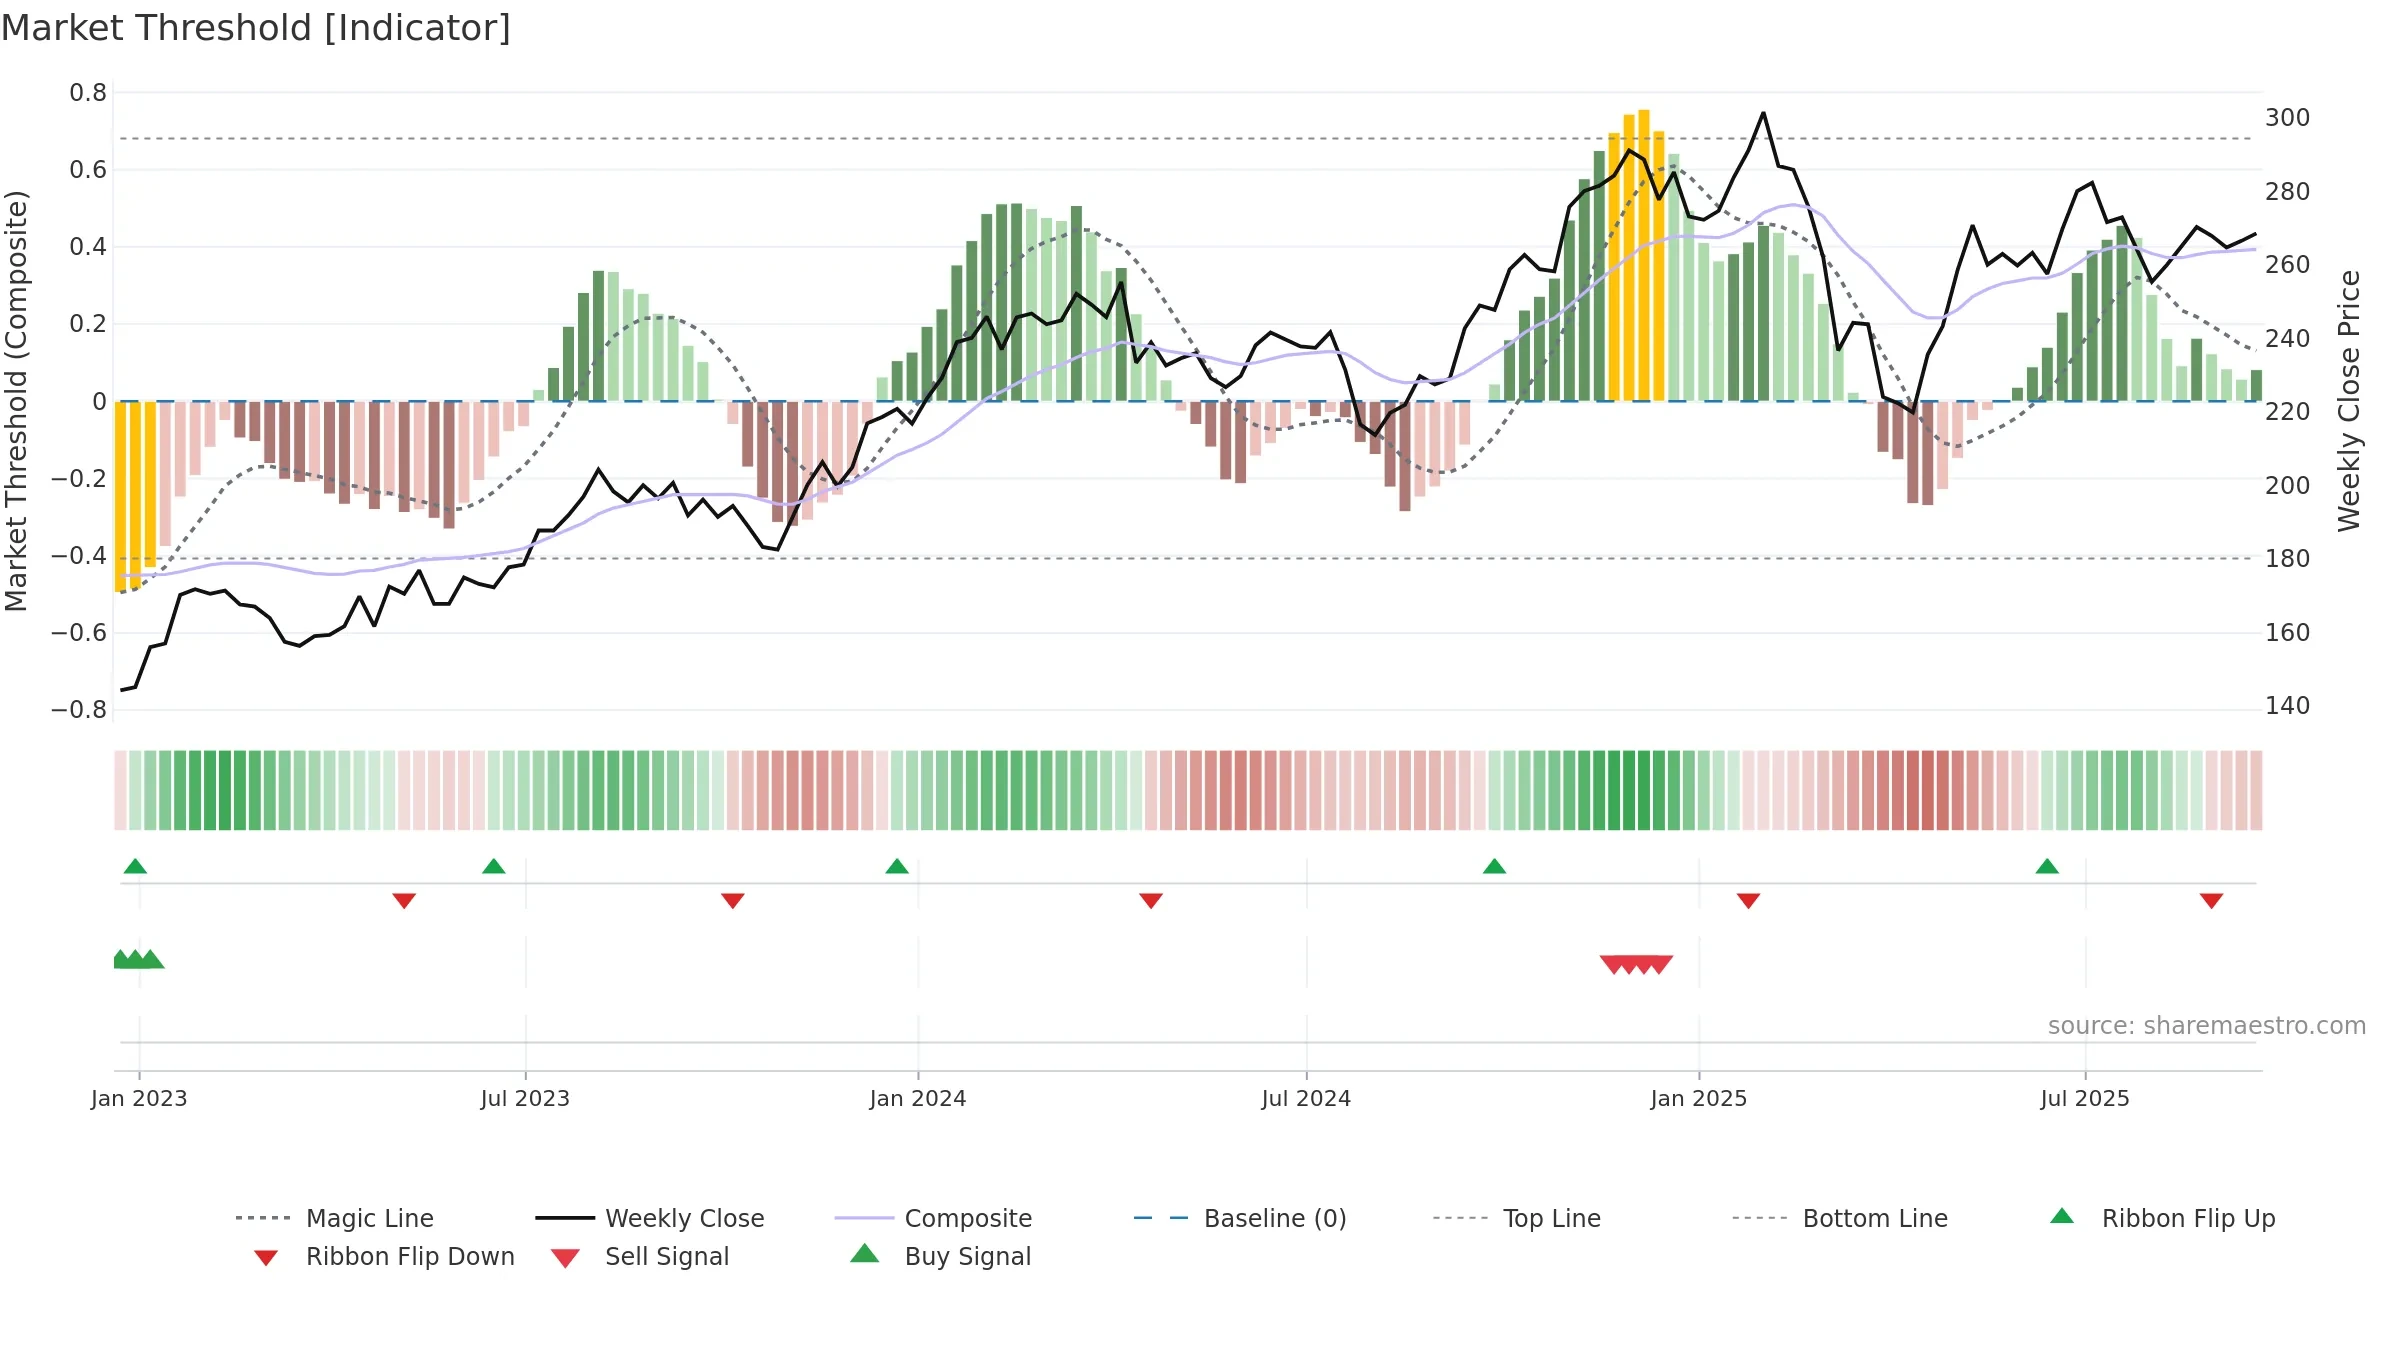
Gauge maps the trend signal to a 0–100 scale.
How to read this — Gauge is elevated but momentum is rolling over; topping risk is rising.
Stay alert: protect gains or seek confirmation before adding risk.
Conclusion
Neutral setup. ★★★☆☆ confidence. Price window: 5. Trend: Uptrend at Risk; gauge 62. In combination, liquidity diverges from price.
- Momentum is bullish and rising
- Price holds above 8w & 26w averages
- Low return volatility supports durability
- High-level but rolling over (topping risk)
- Liquidity diverges from price
Why: Price window 5.16% over 8w. Close is -0.64% below the prior-window high. Return volatility 1.49%. Volume trend falling. Liquidity divergence with price. Trend state uptrend at risk. Momentum bullish and rising.
Tip: Most metrics include a hover tooltip where they appear in the report.