Babcock & Wilcox Enterprises, Inc.
BW NYSE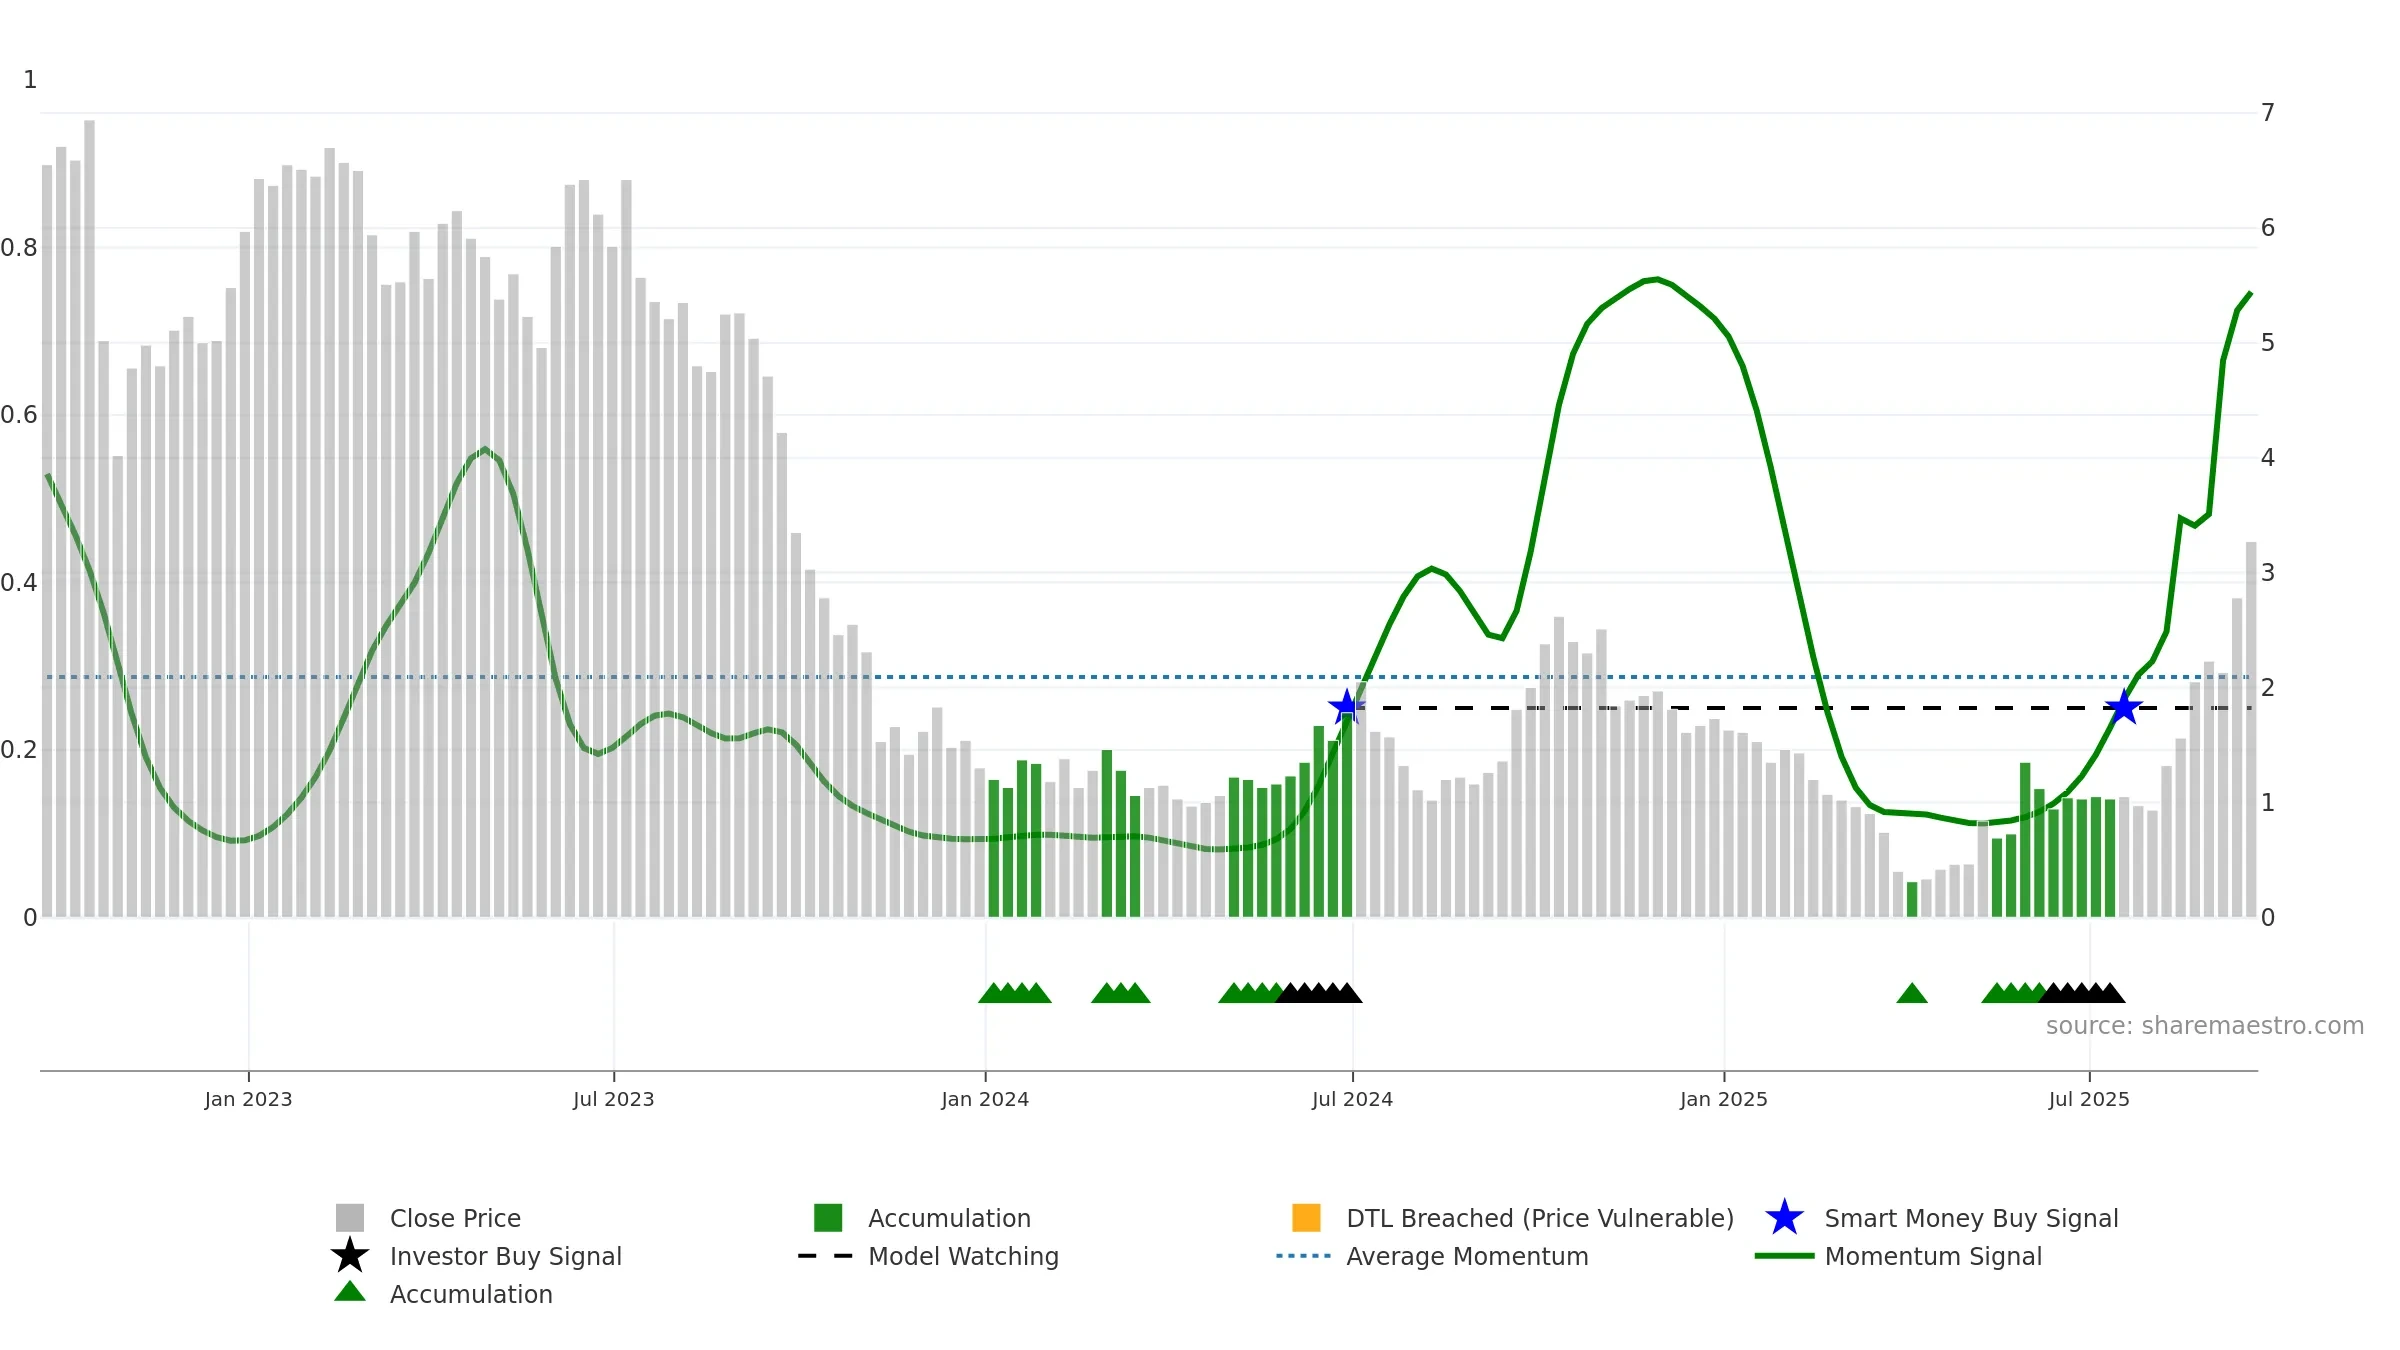
Weekly Summary
Babcock & Wilcox Enterprises, Inc. closed at 3.2700 (-6.57% WoW) . Data window ends Fri, 19 Sep 2025.
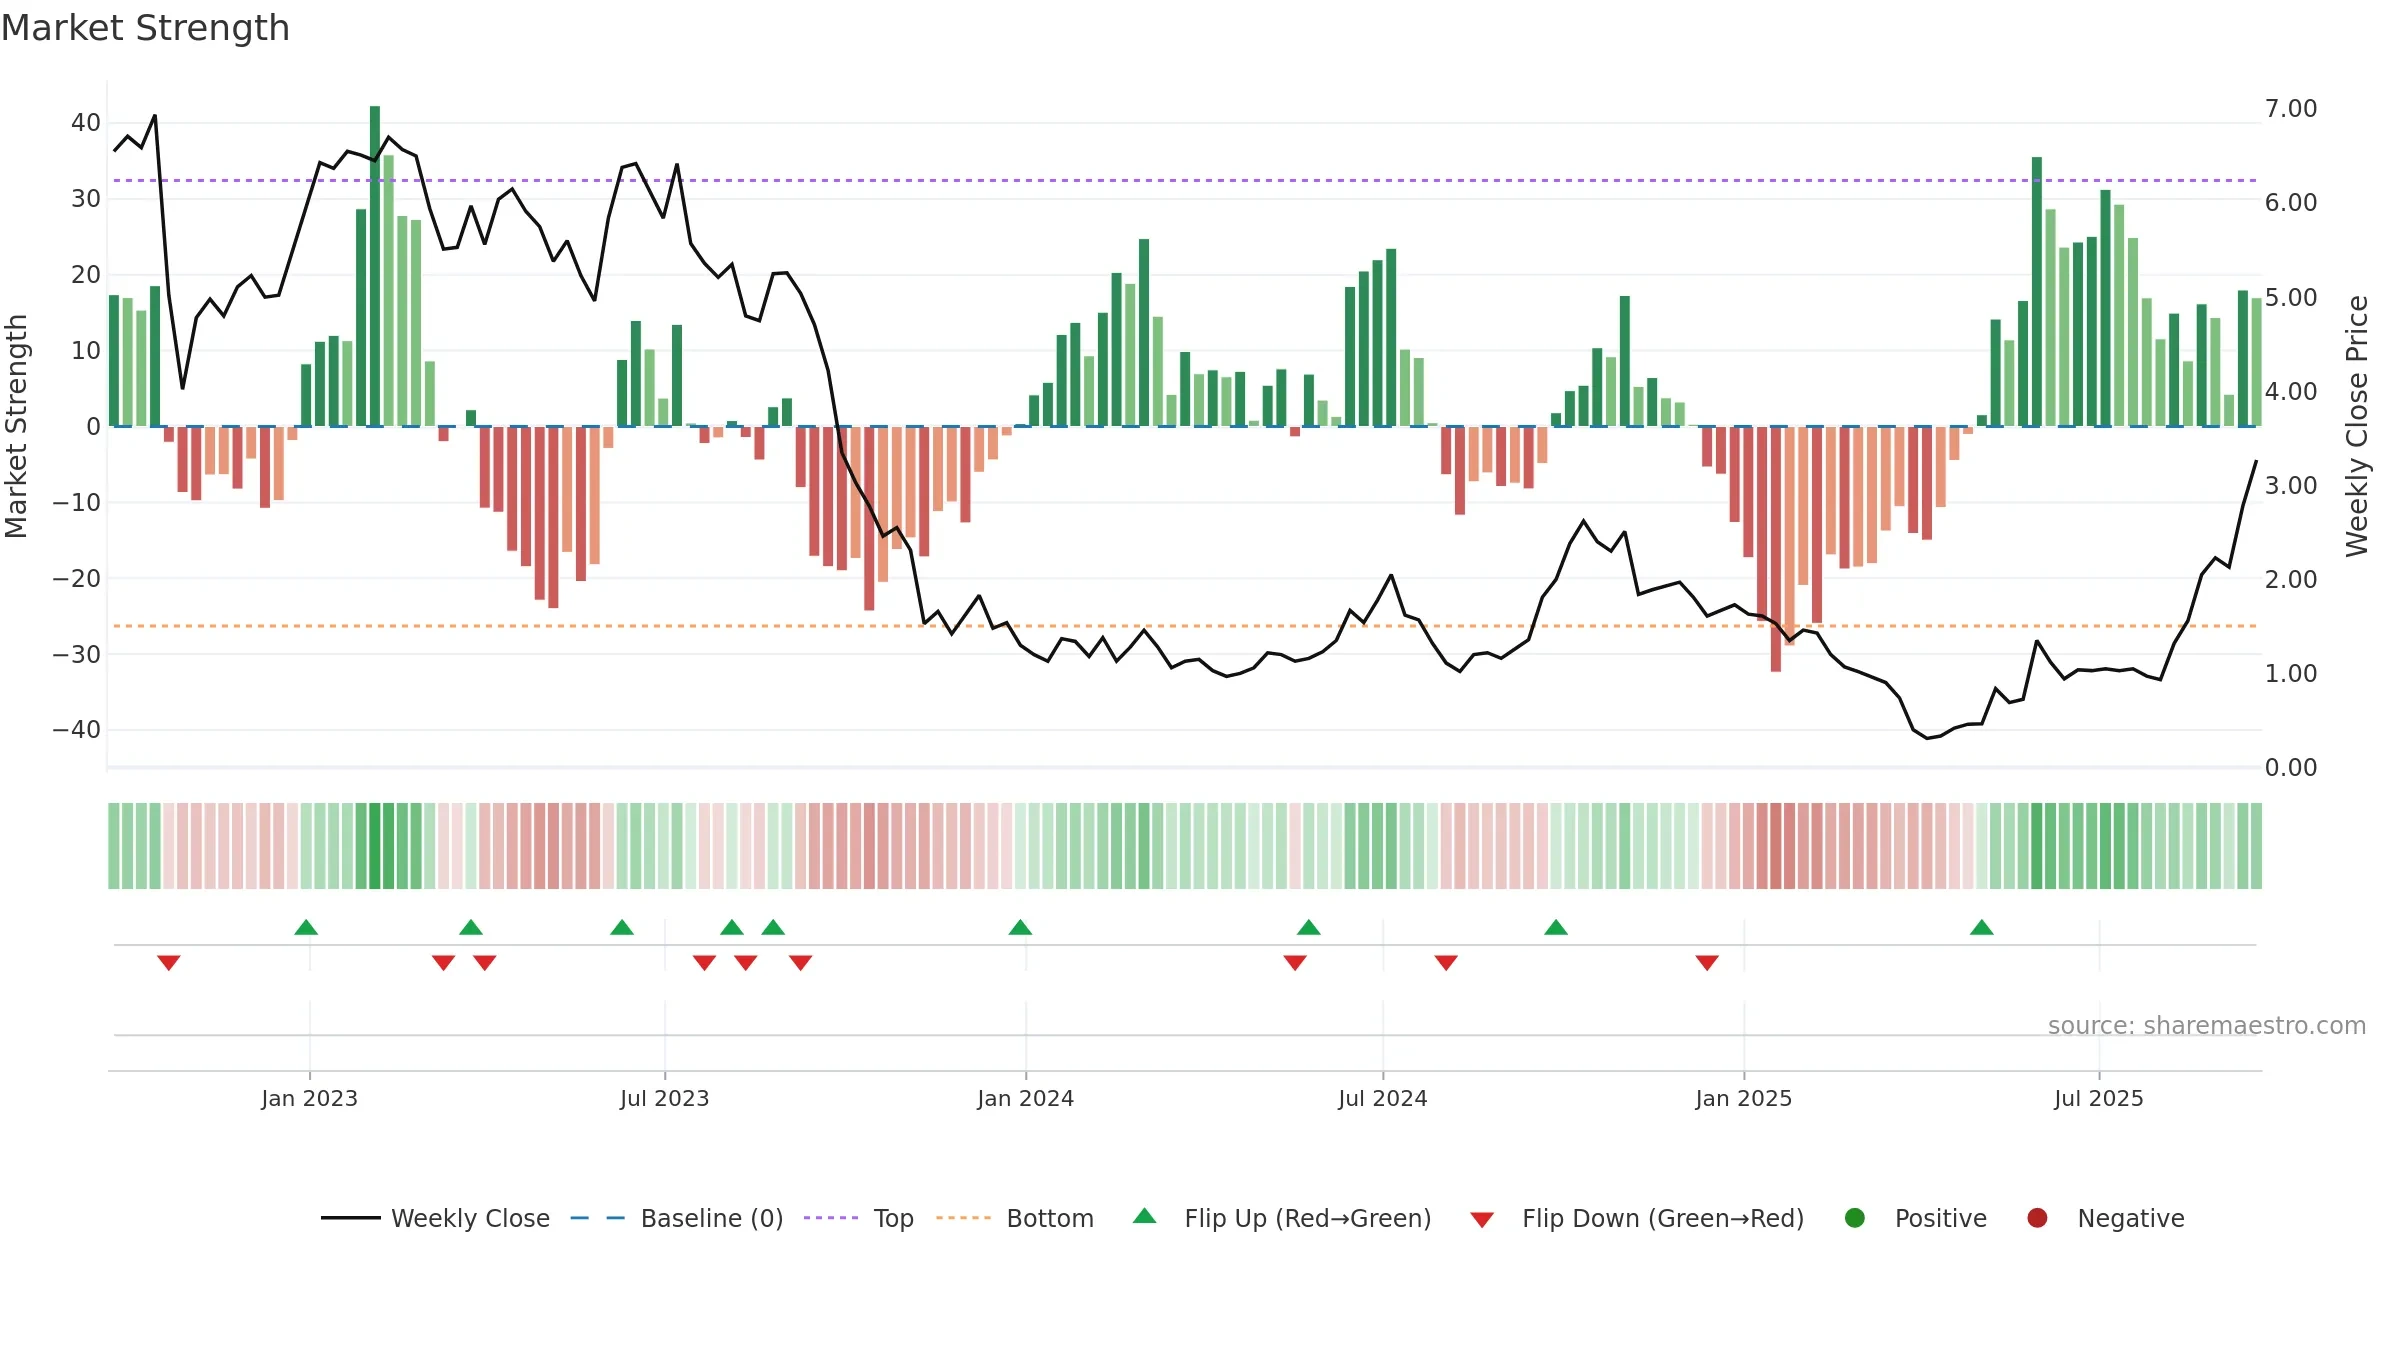
How to read this — Price slope is upward, indicating persistent buying over the window. Elevated weekly volatility increases whipsaw risk. Volume and price are moving in the same direction — a constructive confirmation. Returns are positively correlated with volume — strength tends to arrive on higher activity. Price is stretched above its baseline; consolidation risk rises if activity fades. Constructive MA stack supports the up-drift; pullbacks may find support at the 8–13 week region. Price holds above key averages, indicating constructive participation.
Up-slope supports buying interest; pullbacks may be contained if activity stays firm.
Gauge maps the trend signal to a 0–100 scale.
How to read this — High gauge and rising momentum — buyers in control.
Bias remains higher; pullbacks could be buyable if participation holds.

Relative strength is Positive
(> 0%, outperforming).
Latest MRS: 135.25% (week ending Fri, 19 Sep 2025).
Slope: Rising over 8w.
Notes:
- Holding above the zero line indicates relative bid.
- MRS slope rising over ~8 weeks.
Price is below fair value; potential upside if momentum constructive.
Conclusion
Positive setup. ★★★★☆ confidence. Trend: Strong Uptrend · 250.48% over window · vol 11.08% · liquidity convergence · posture above · RS outperforming
- High gauge with rising momentum (strong uptrend)
- Momentum is bullish and rising
- Price holds above 8–26 week averages
- Constructive moving-average stack
- High return volatility raises whipsaw risk
Why: Price window 250.48% over w. Close is 17.63% above the prior-window high. Return volatility 11.08%. Volume trend rising. Liquidity convergence with price. Trend state strong uptrend. MA stack constructive. Momentum bullish and rising. Valuation supportive skew.
Tip: Most metrics include a hover tooltip where they appear in the report.