Cidara Therapeutics, Inc.
CDTX NASDAQ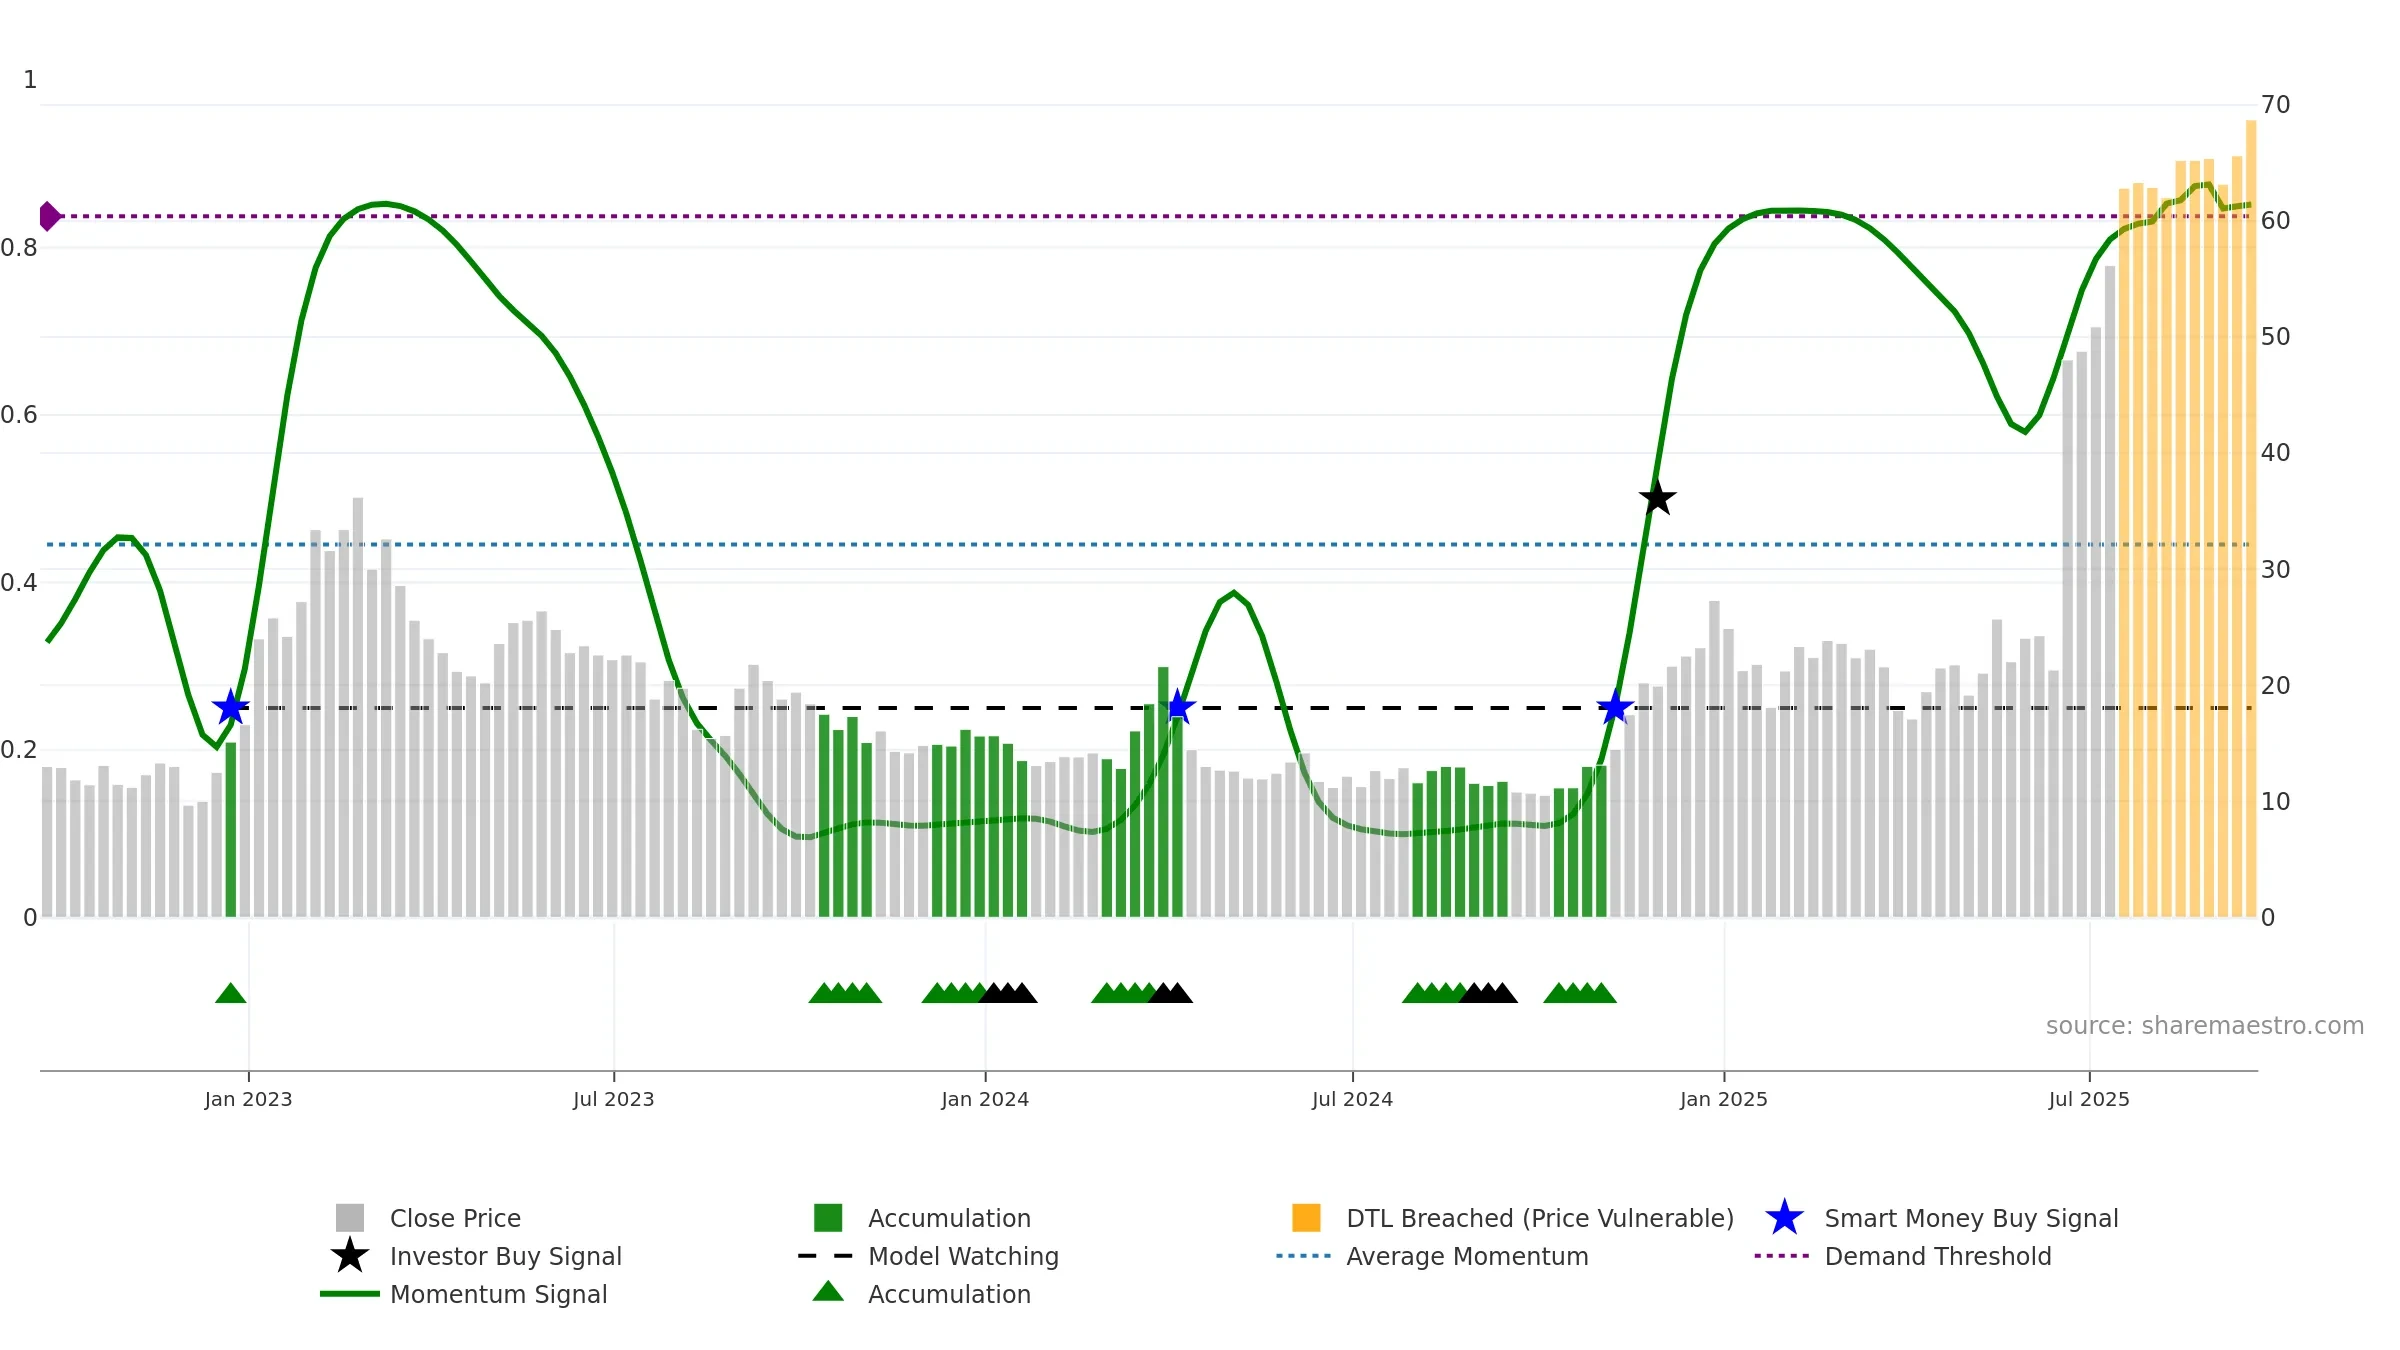
Weekly Summary
Cidara Therapeutics, Inc. closed at 68.7100 (-3.88% WoW) . Data window ends Fri, 19 Sep 2025.
How to read this — Price slope is upward, indicating persistent buying over the window. Volume and price are moving in the same direction — a constructive confirmation. Returns are negatively correlated with volume — strength may come on lighter activity. Constructive MA stack supports the up-drift; pullbacks may find support at the 8–13 week region. Price holds above key averages, indicating constructive participation.
Up-slope supports buying interest; pullbacks may be contained if activity stays firm.
Gauge maps the trend signal to a 0–100 scale.
How to read this — Gauge is elevated but momentum is rolling over; topping risk is rising.
Stay alert: protect gains or seek confirmation before adding risk.

Relative strength is Positive
(> 0%, outperforming).
Latest MRS: 56.20% (week ending Fri, 19 Sep 2025).
Slope: Falling over 8w.
Notes:
- Holding above the zero line indicates relative bid.
- MRS slope falling over ~8 weeks.
Conclusion
Positive setup. ★★★★⯪ confidence. Trend: Uptrend at Risk · 9.24% over window · vol 3.56% · liquidity convergence · posture above · RS outperforming
- Momentum is bullish and rising
- Price holds above 8–26 week averages
- Constructive moving-average stack
- Liquidity confirms the price trend
- High level but momentum rolling over (topping risk)
Why: Price window 9.24% over w. Close is 4.71% above the prior-window high. Volume trend rising. Liquidity convergence with price. Trend state uptrend at risk. MA stack constructive. Baseline deviation 2.11% (widening). Momentum bullish and rising.
Tip: Most metrics include a hover tooltip where they appear in the report.