LCI Industries
LCII NYSE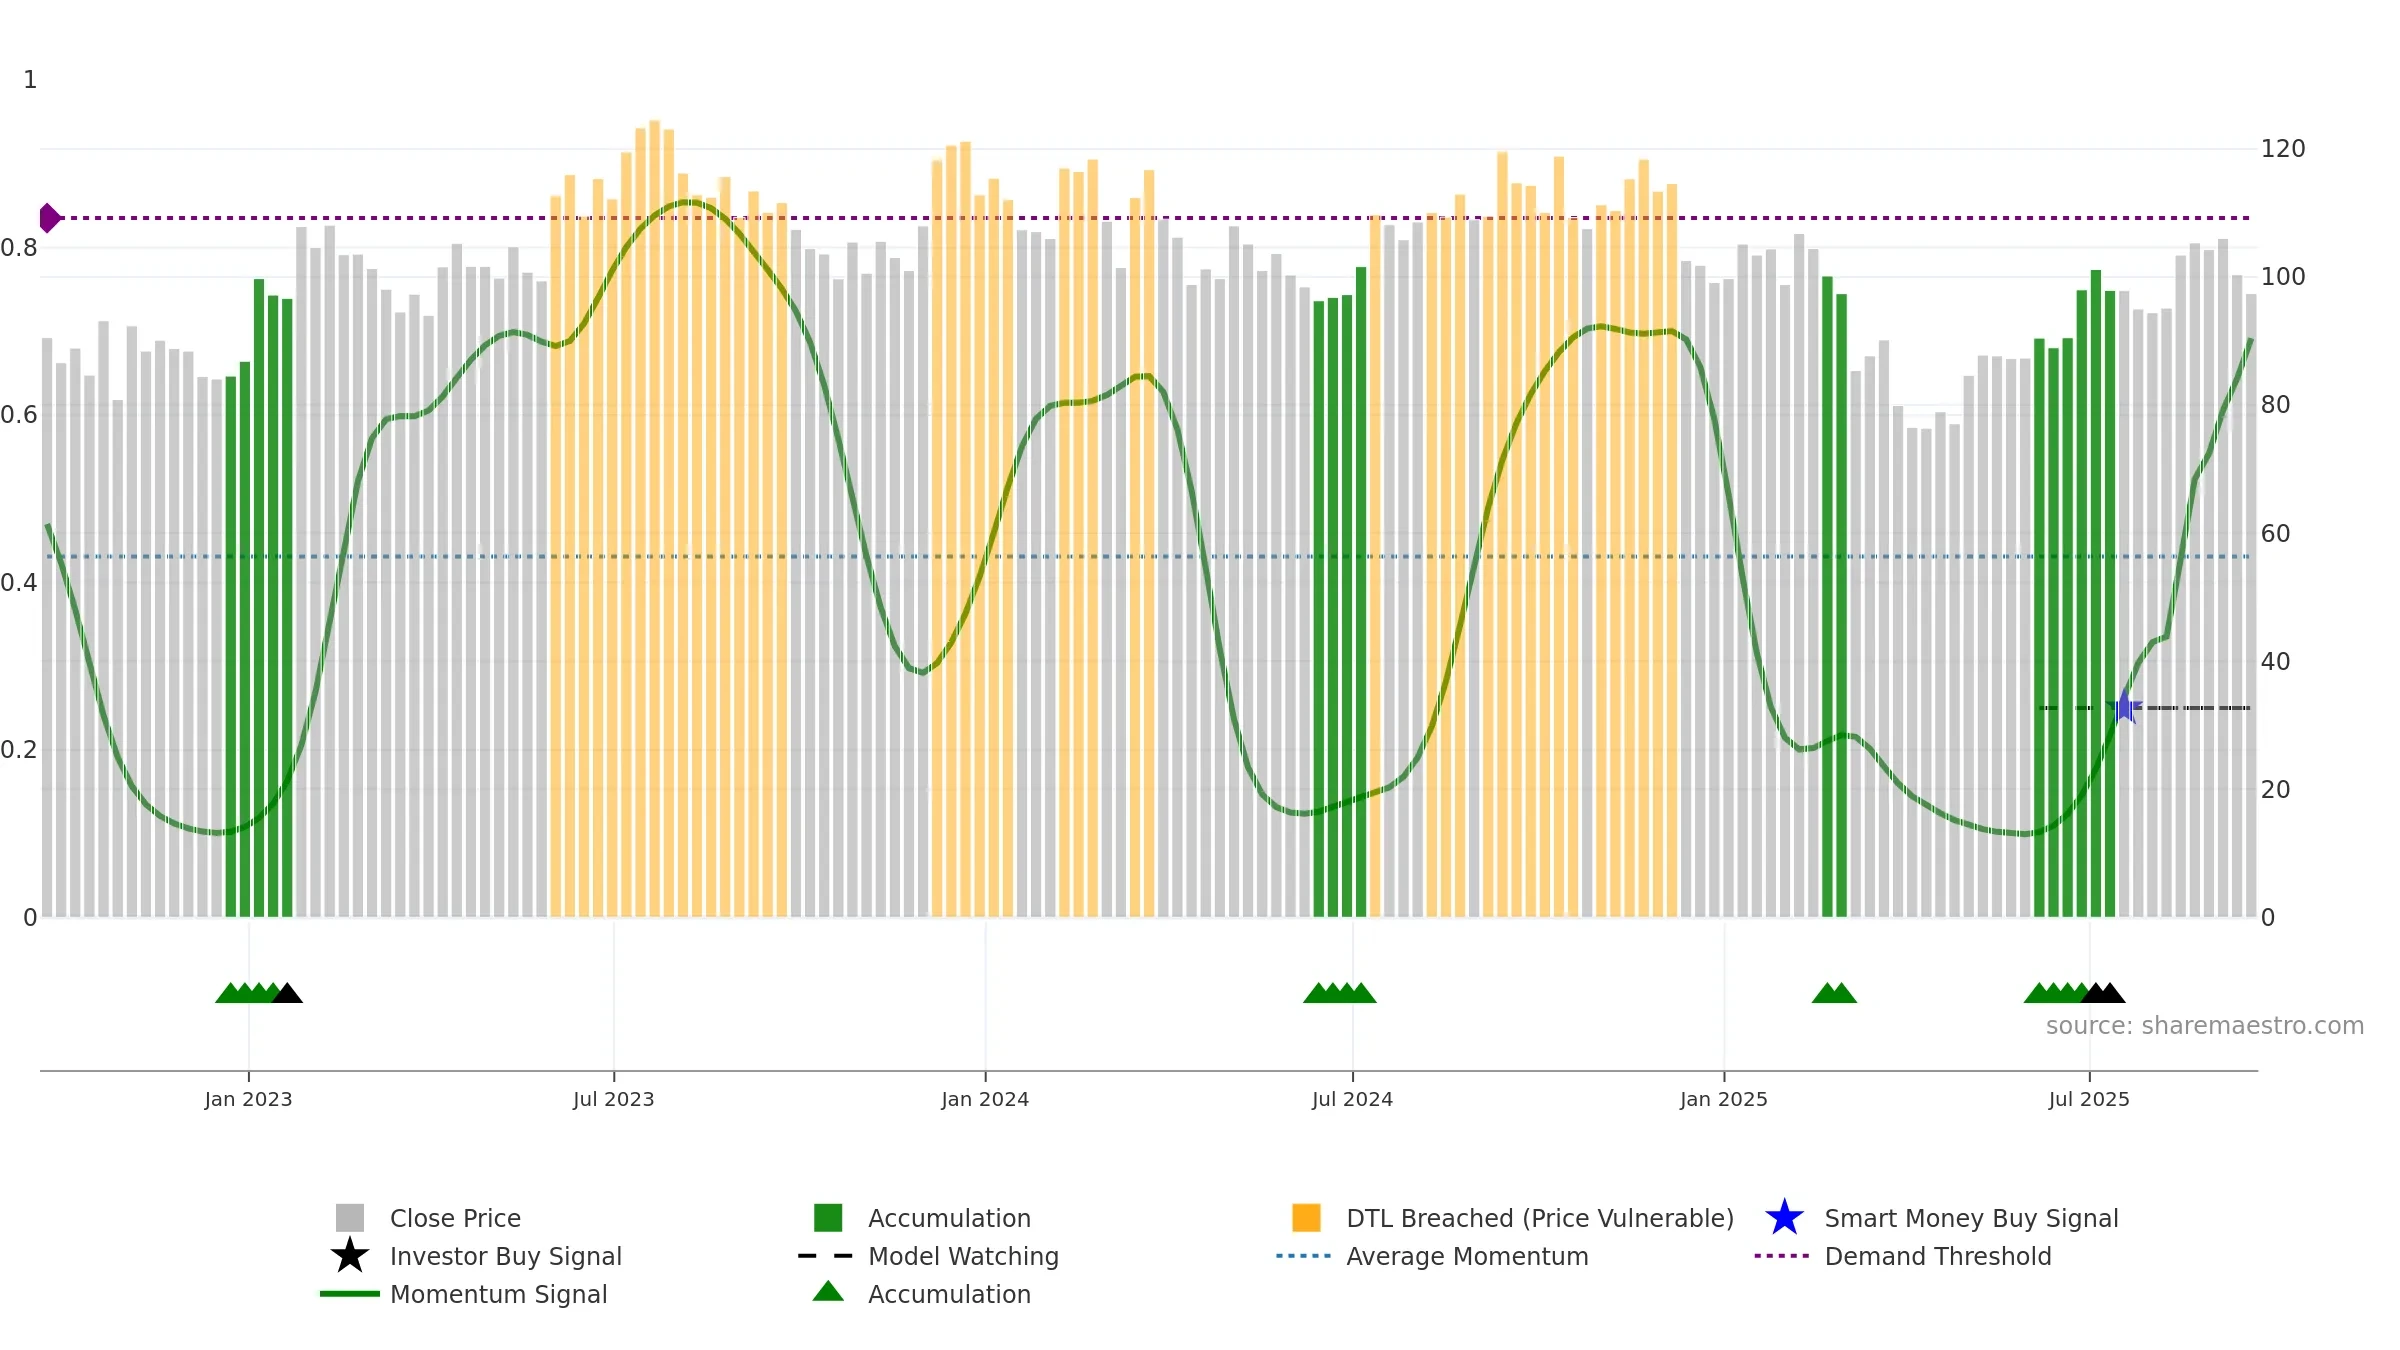
Weekly Summary
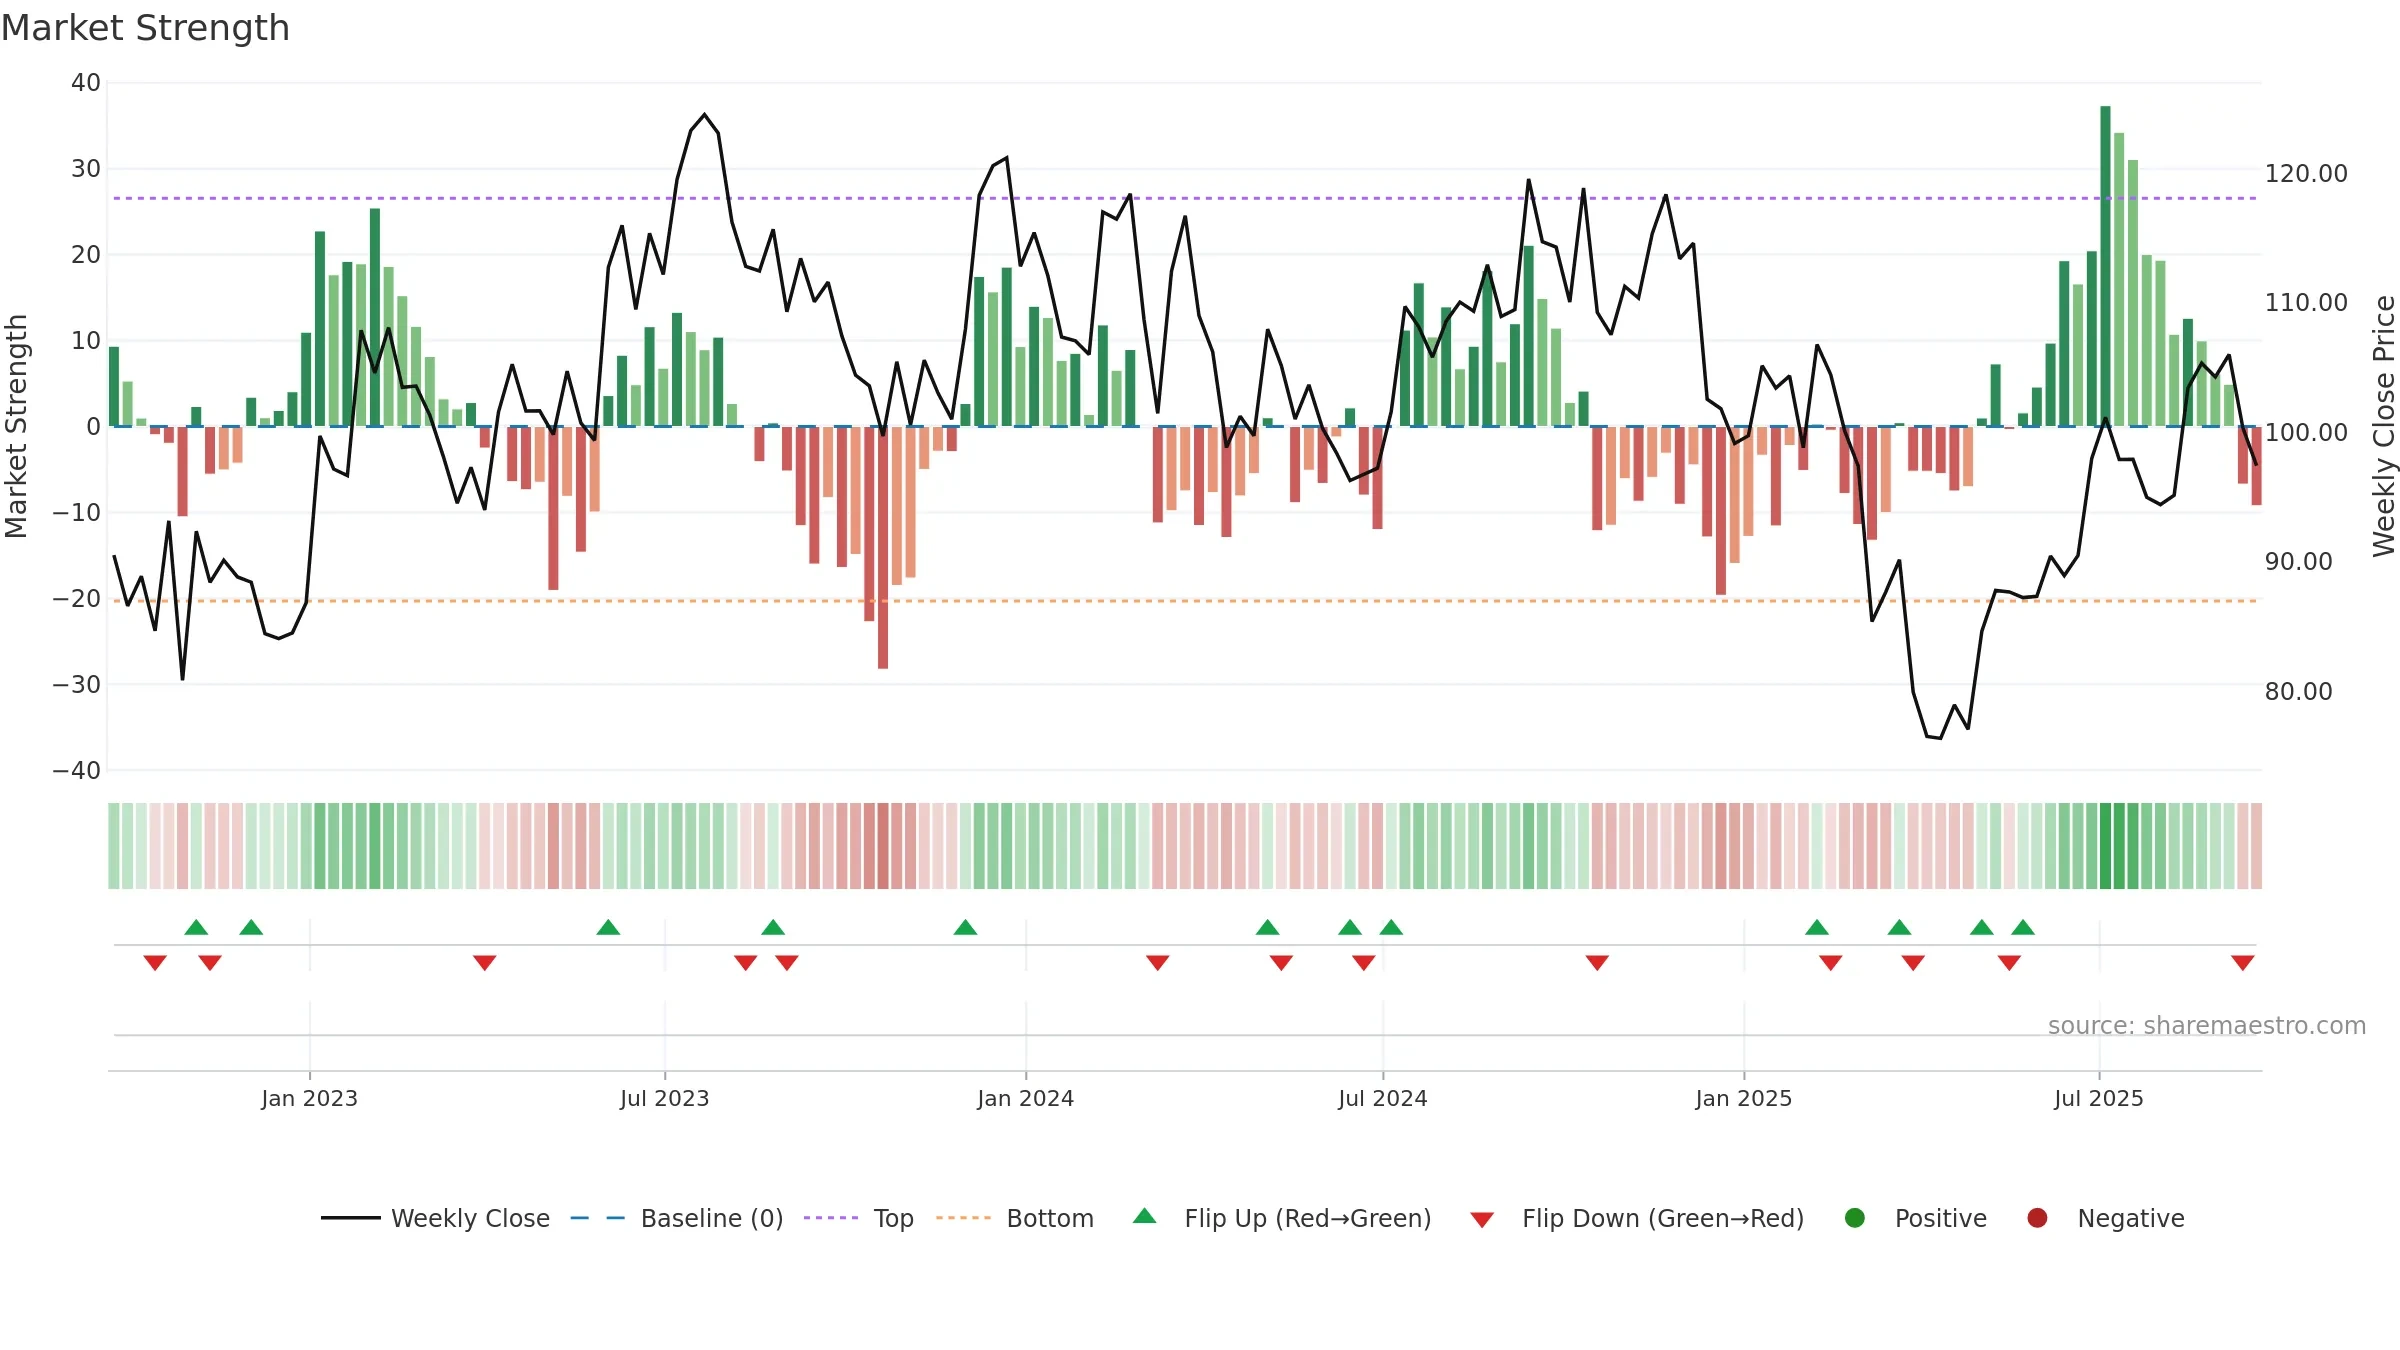
LCI Industries closed at 97.4400 (-1.75% WoW) . Data window ends Fri, 19 Sep 2025.
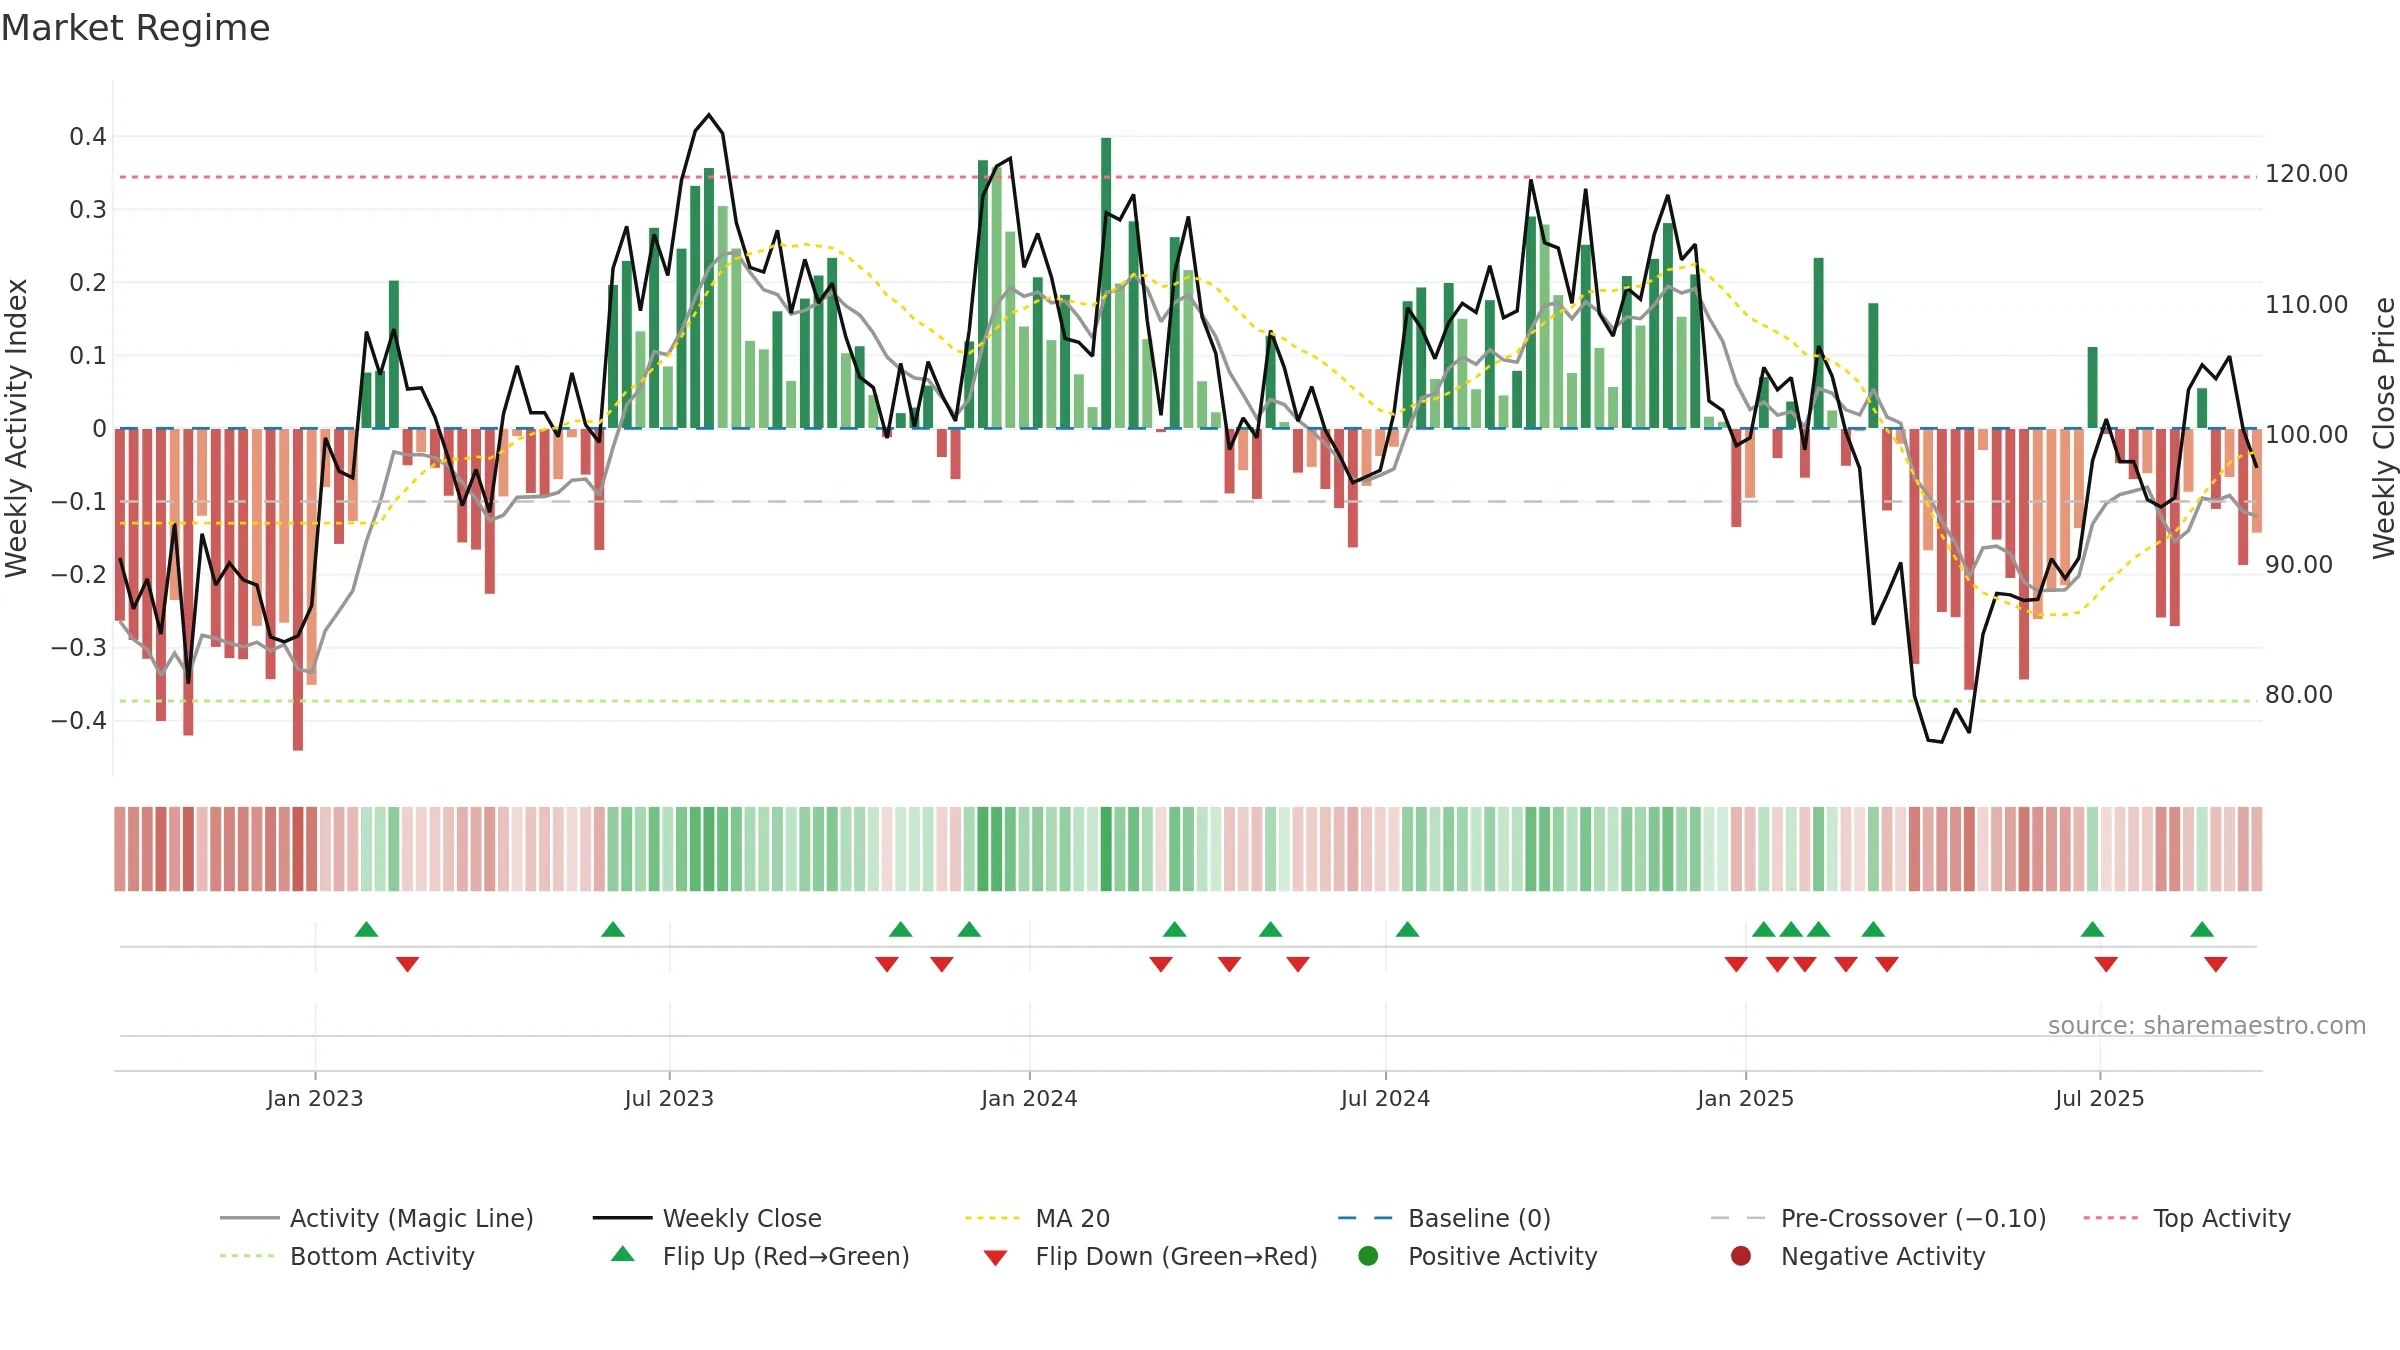
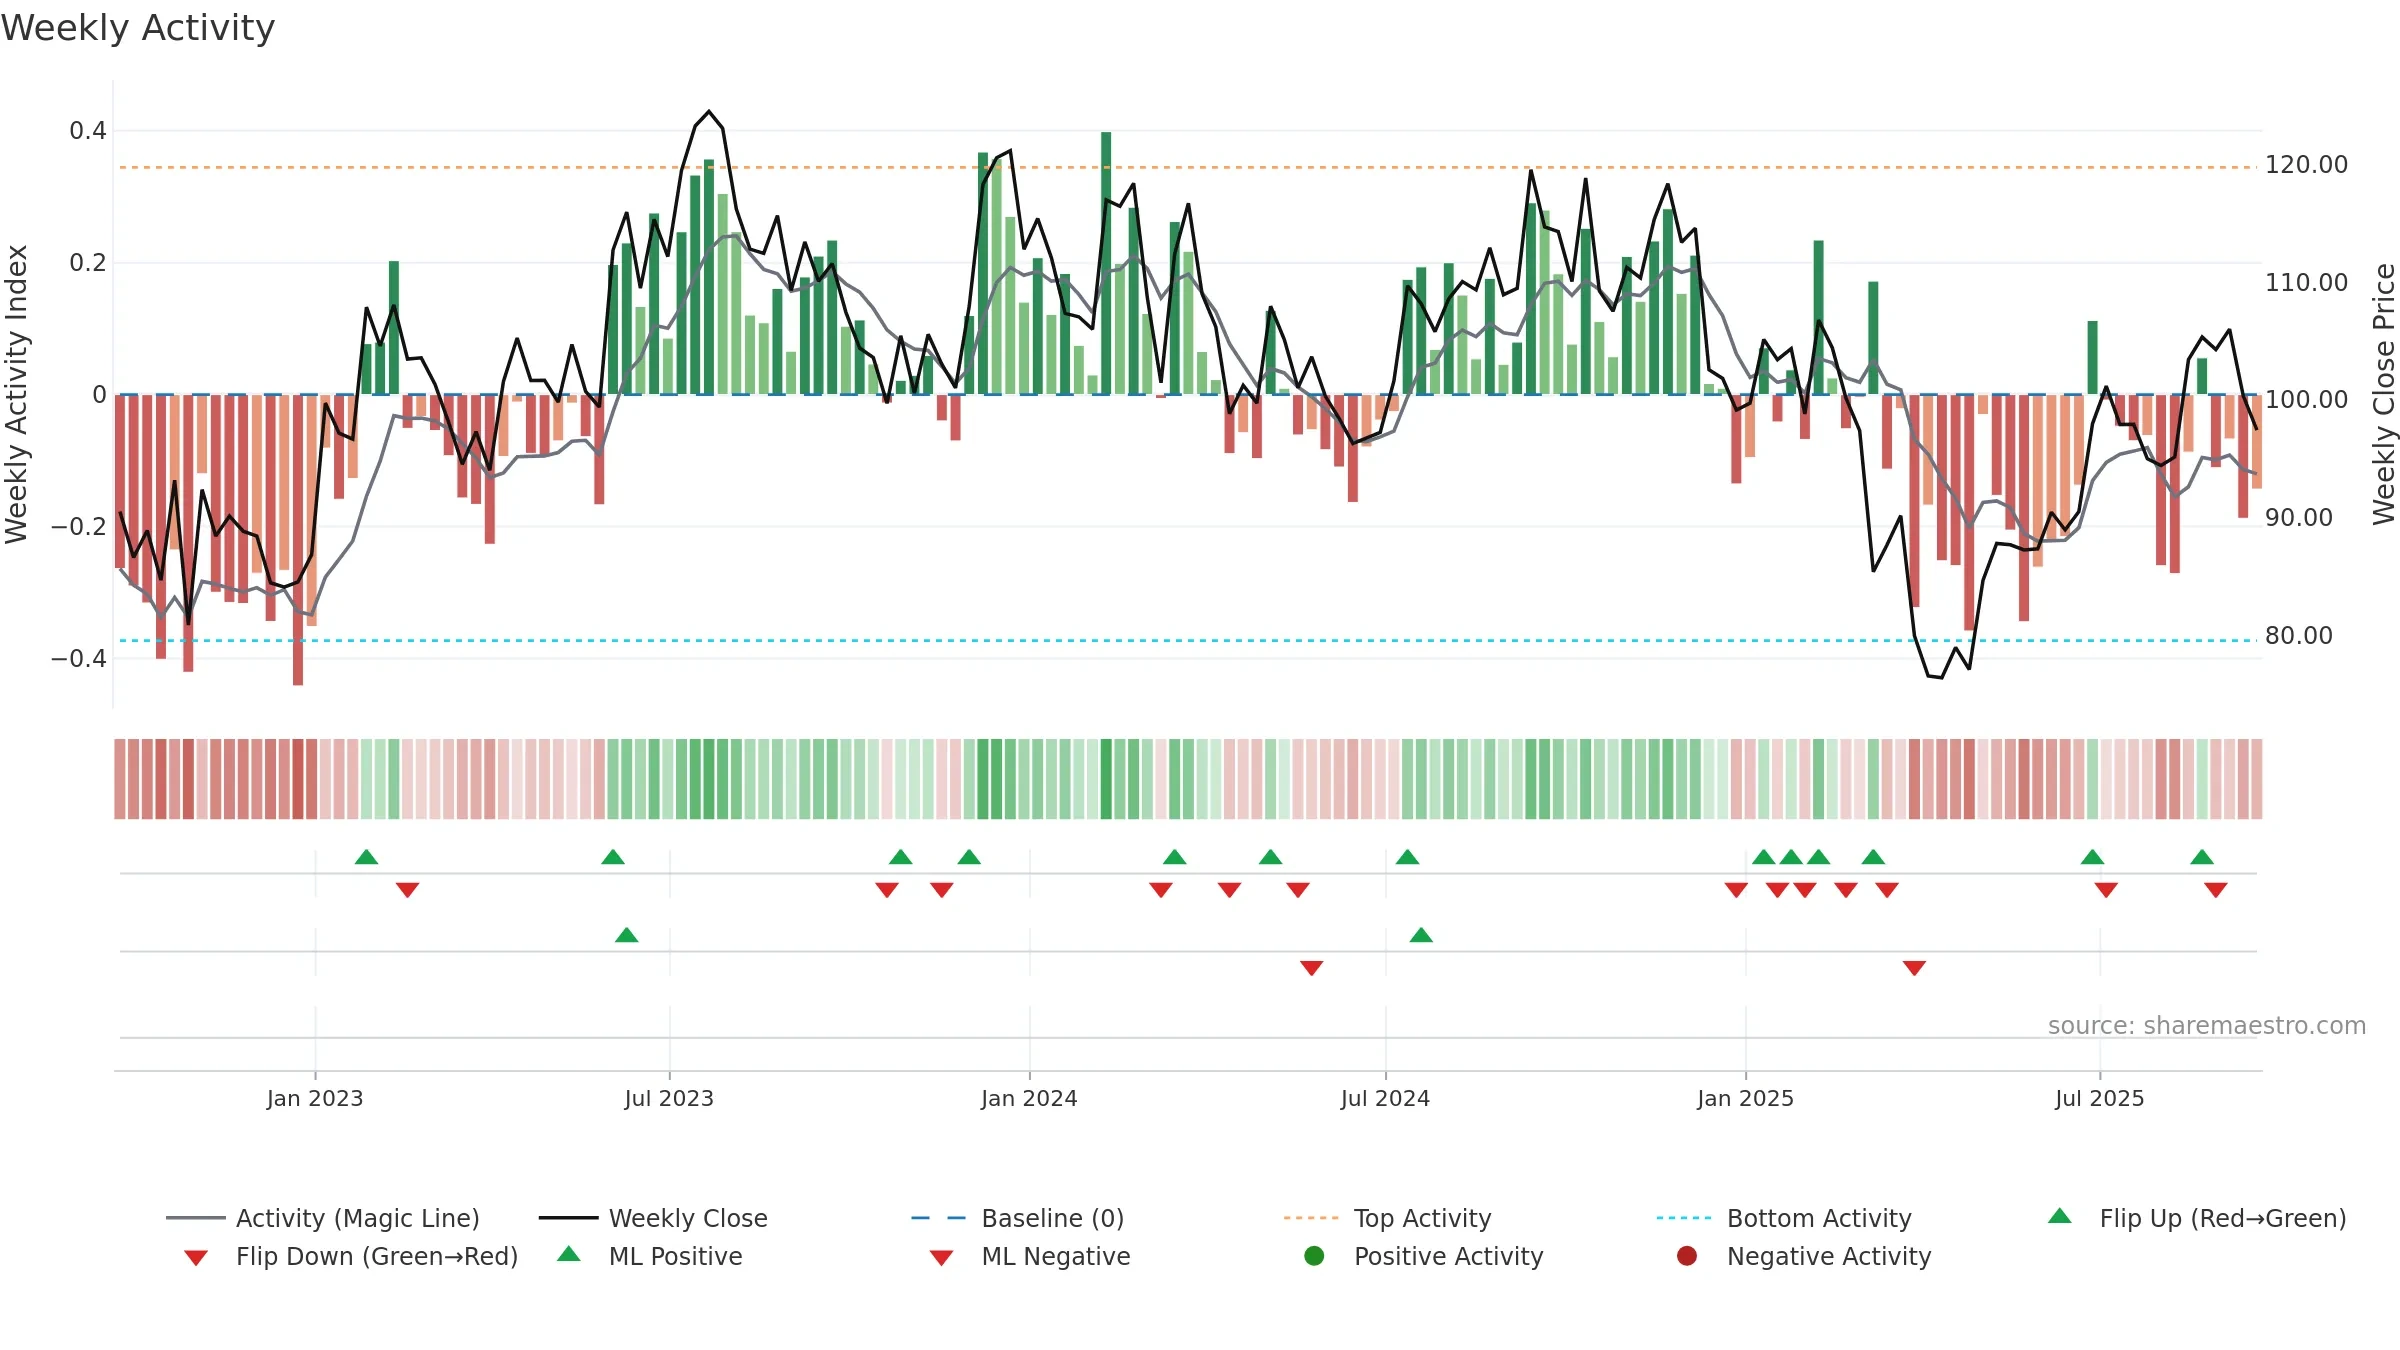
How to read this — Price slope is upward, indicating persistent buying over the window. Low weekly volatility favours steadier follow-through. Volume and price are moving in the same direction — a constructive confirmation. Returns are positively correlated with volume — strength tends to arrive on higher activity. Constructive MA stack supports the up-drift; pullbacks may find support at the 8–13 week region.
Up-slope supports buying interest; pullbacks may be contained if activity stays firm.
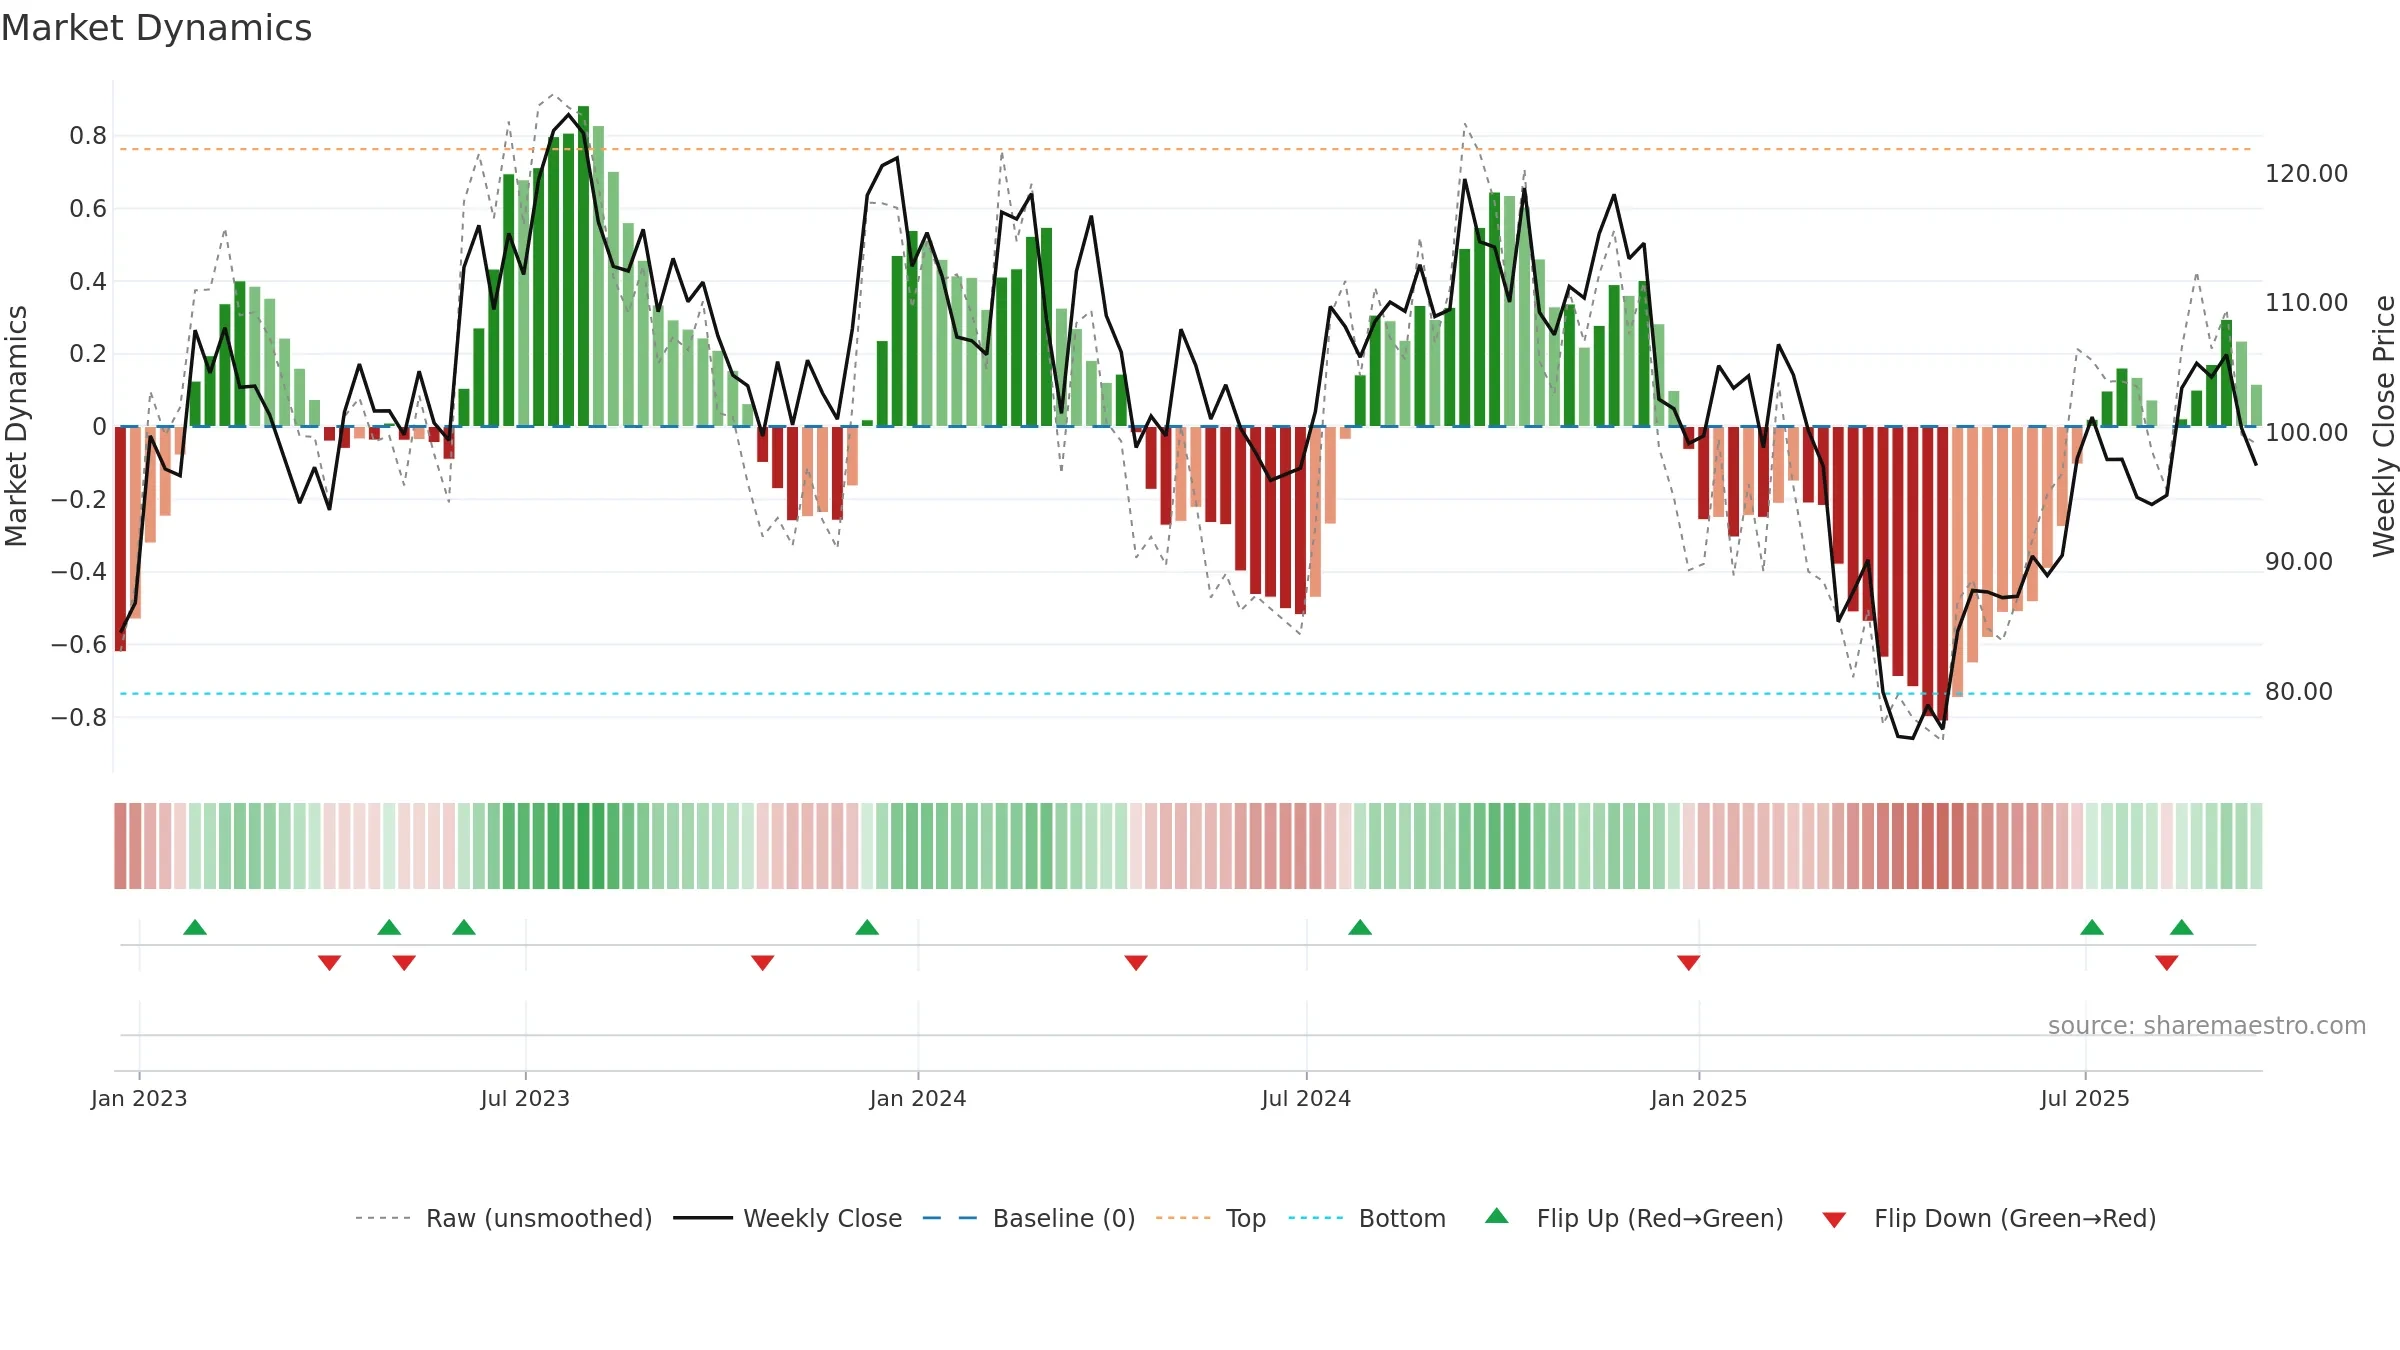
Gauge maps the trend signal to a 0–100 scale.
How to read this — Range-bound conditions; conviction is limited until a break or acceleration emerges.
Wait for a directional break or improving acceleration.

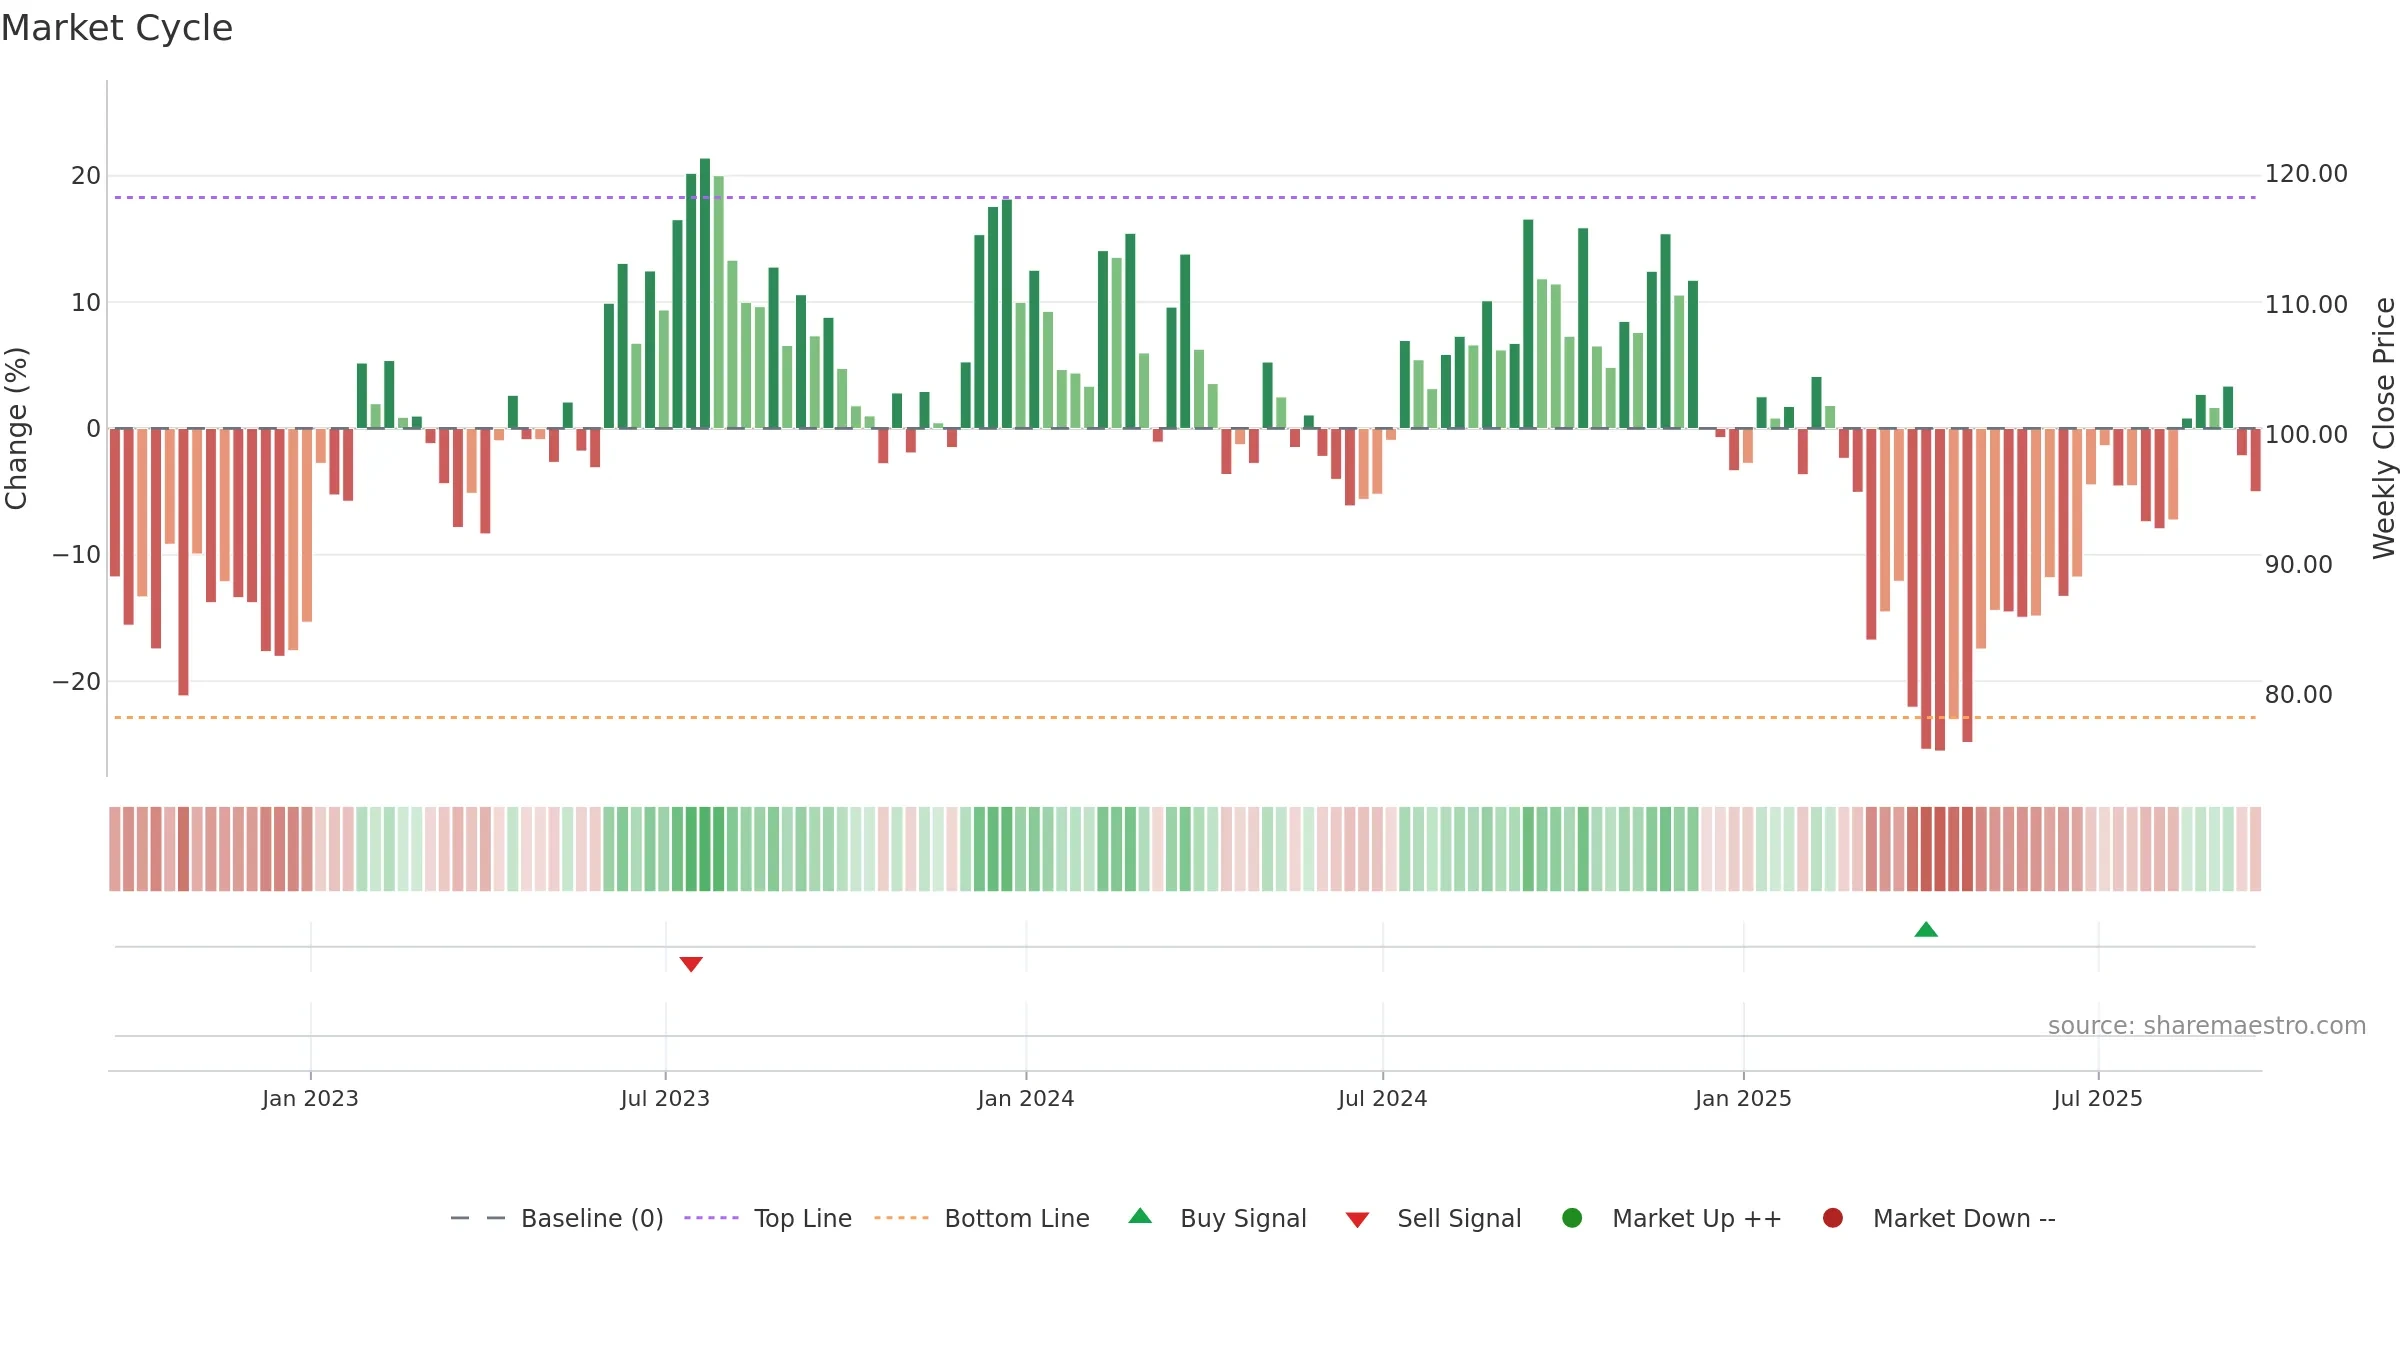
Relative strength is Negative
(< 0%, underperforming).
Latest MRS: -4.00% (week ending Fri, 19 Sep 2025).
Slope: Falling over 8w.
Notes:
- Below zero line indicates relative weakness vs benchmark.
- MRS slope falling over ~8 weeks.
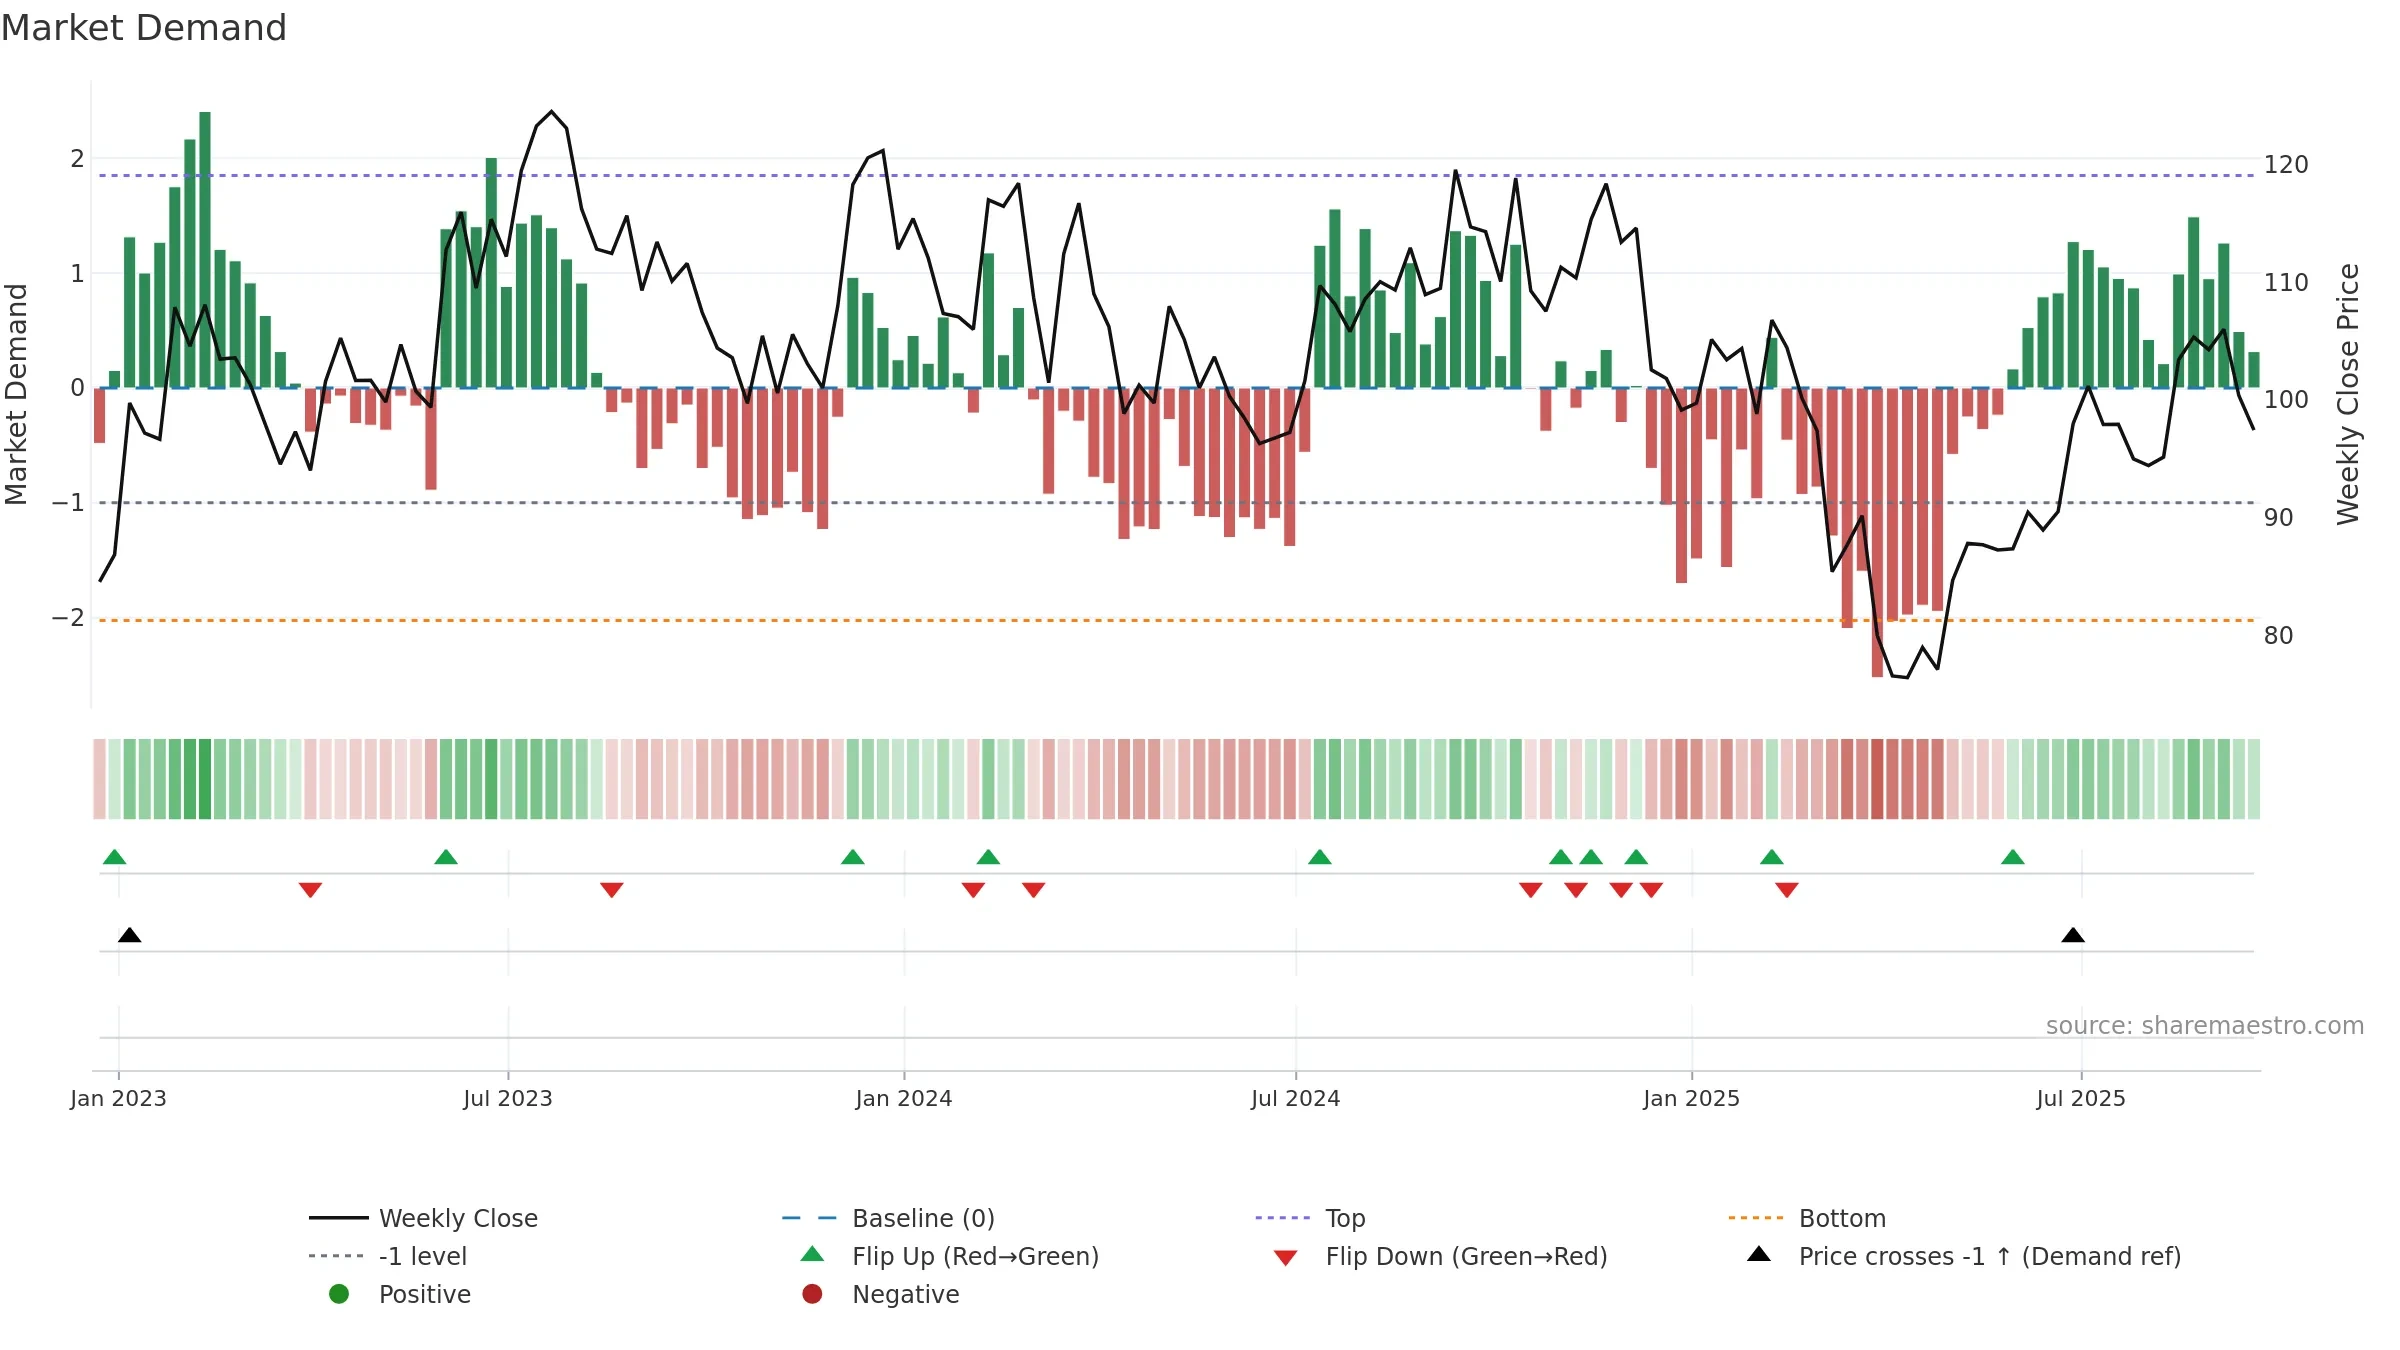
Price is below fair value; potential upside if momentum constructive.
Conclusion
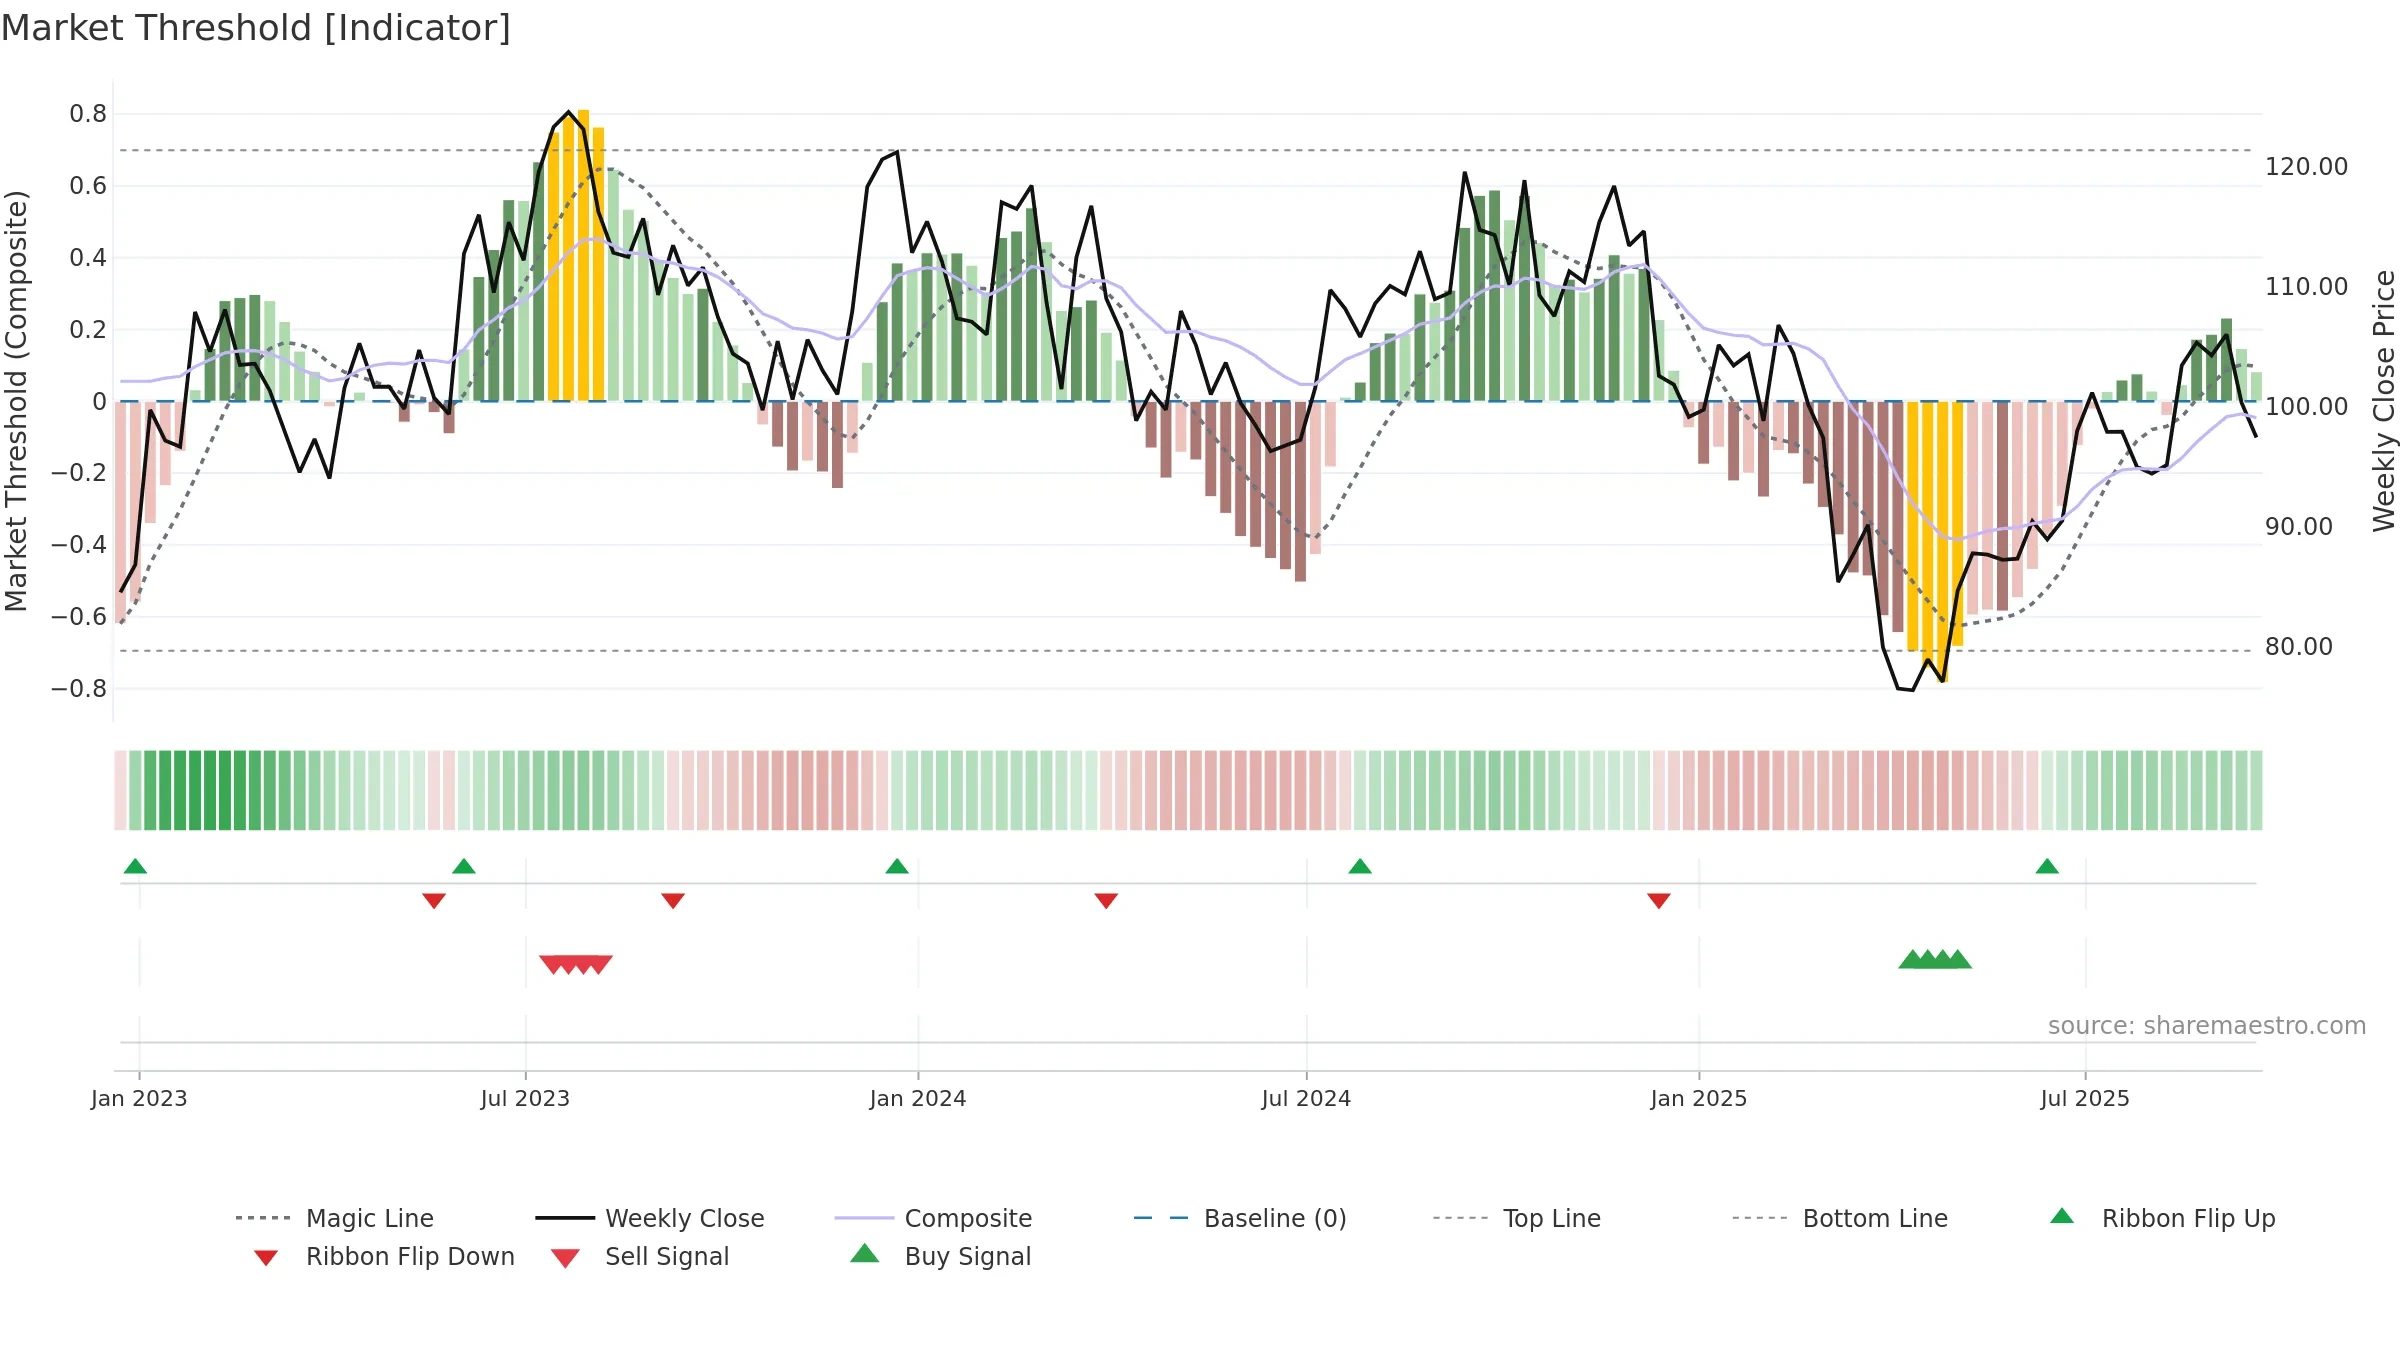
Positive setup. ★★★★⯪ confidence. Trend: Range / Neutral · 3.19% over window · vol 1.96% · liquidity convergence · posture mixed
- Momentum is bullish and rising
- Constructive moving-average stack
- Liquidity confirms the price trend
- Low return volatility supports durability
- Price is not above key averages
Why: Price window 3.19% over w. Close is -8.09% below the prior-window high. Return volatility 1.96%. Volume trend rising. Liquidity convergence with price. Trend state range / neutral. MA stack constructive. Momentum bullish and rising. Valuation supportive skew.
Tip: Most metrics include a hover tooltip where they appear in the report.