McNally Bharat Engineering Company Limited
MBECL NSE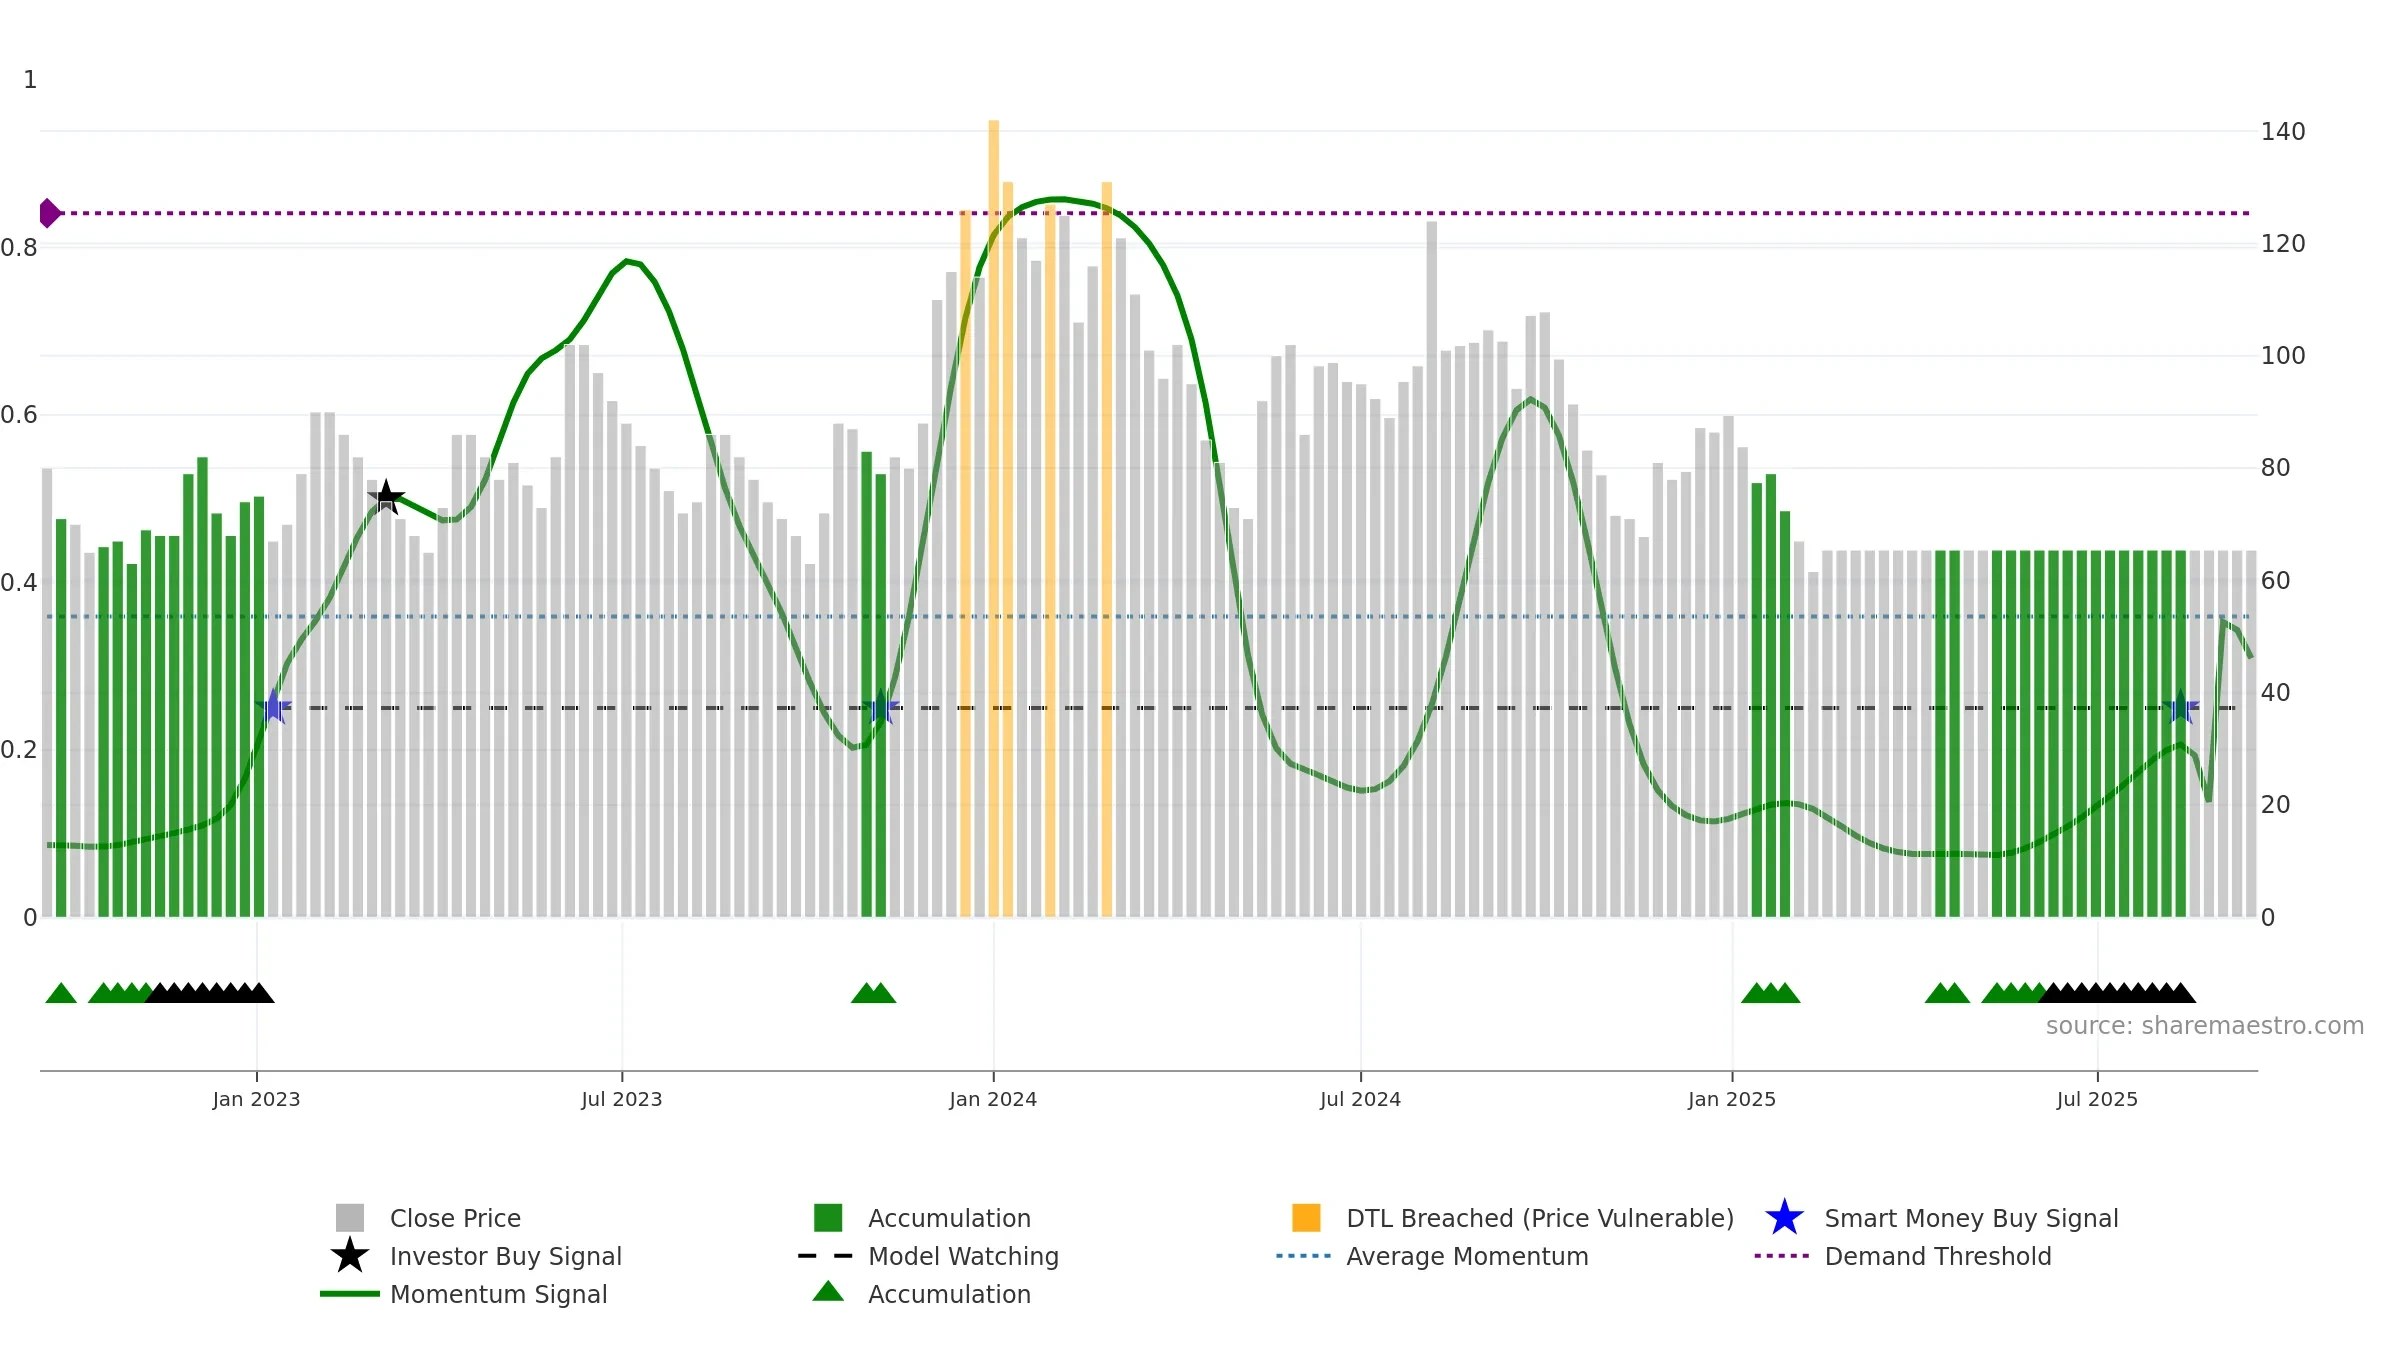
Weekly Report
McNally Bharat Engineering Company Limited closed at 65.4000 (0.00% WoW) . Data window ends Mon, 15 Sep 2025.
How to read this — Price slope is flat, suggesting balance between buyers and sellers. Low weekly volatility favours steadier follow-through. Volume or price is flat; confirmation from liquidity is limited. Price sits below key averages, keeping pressure on the tape.
Flat slope suggests a wait-and-see approach until the balance shifts.
Gauge maps the trend signal to a 0–100 scale.
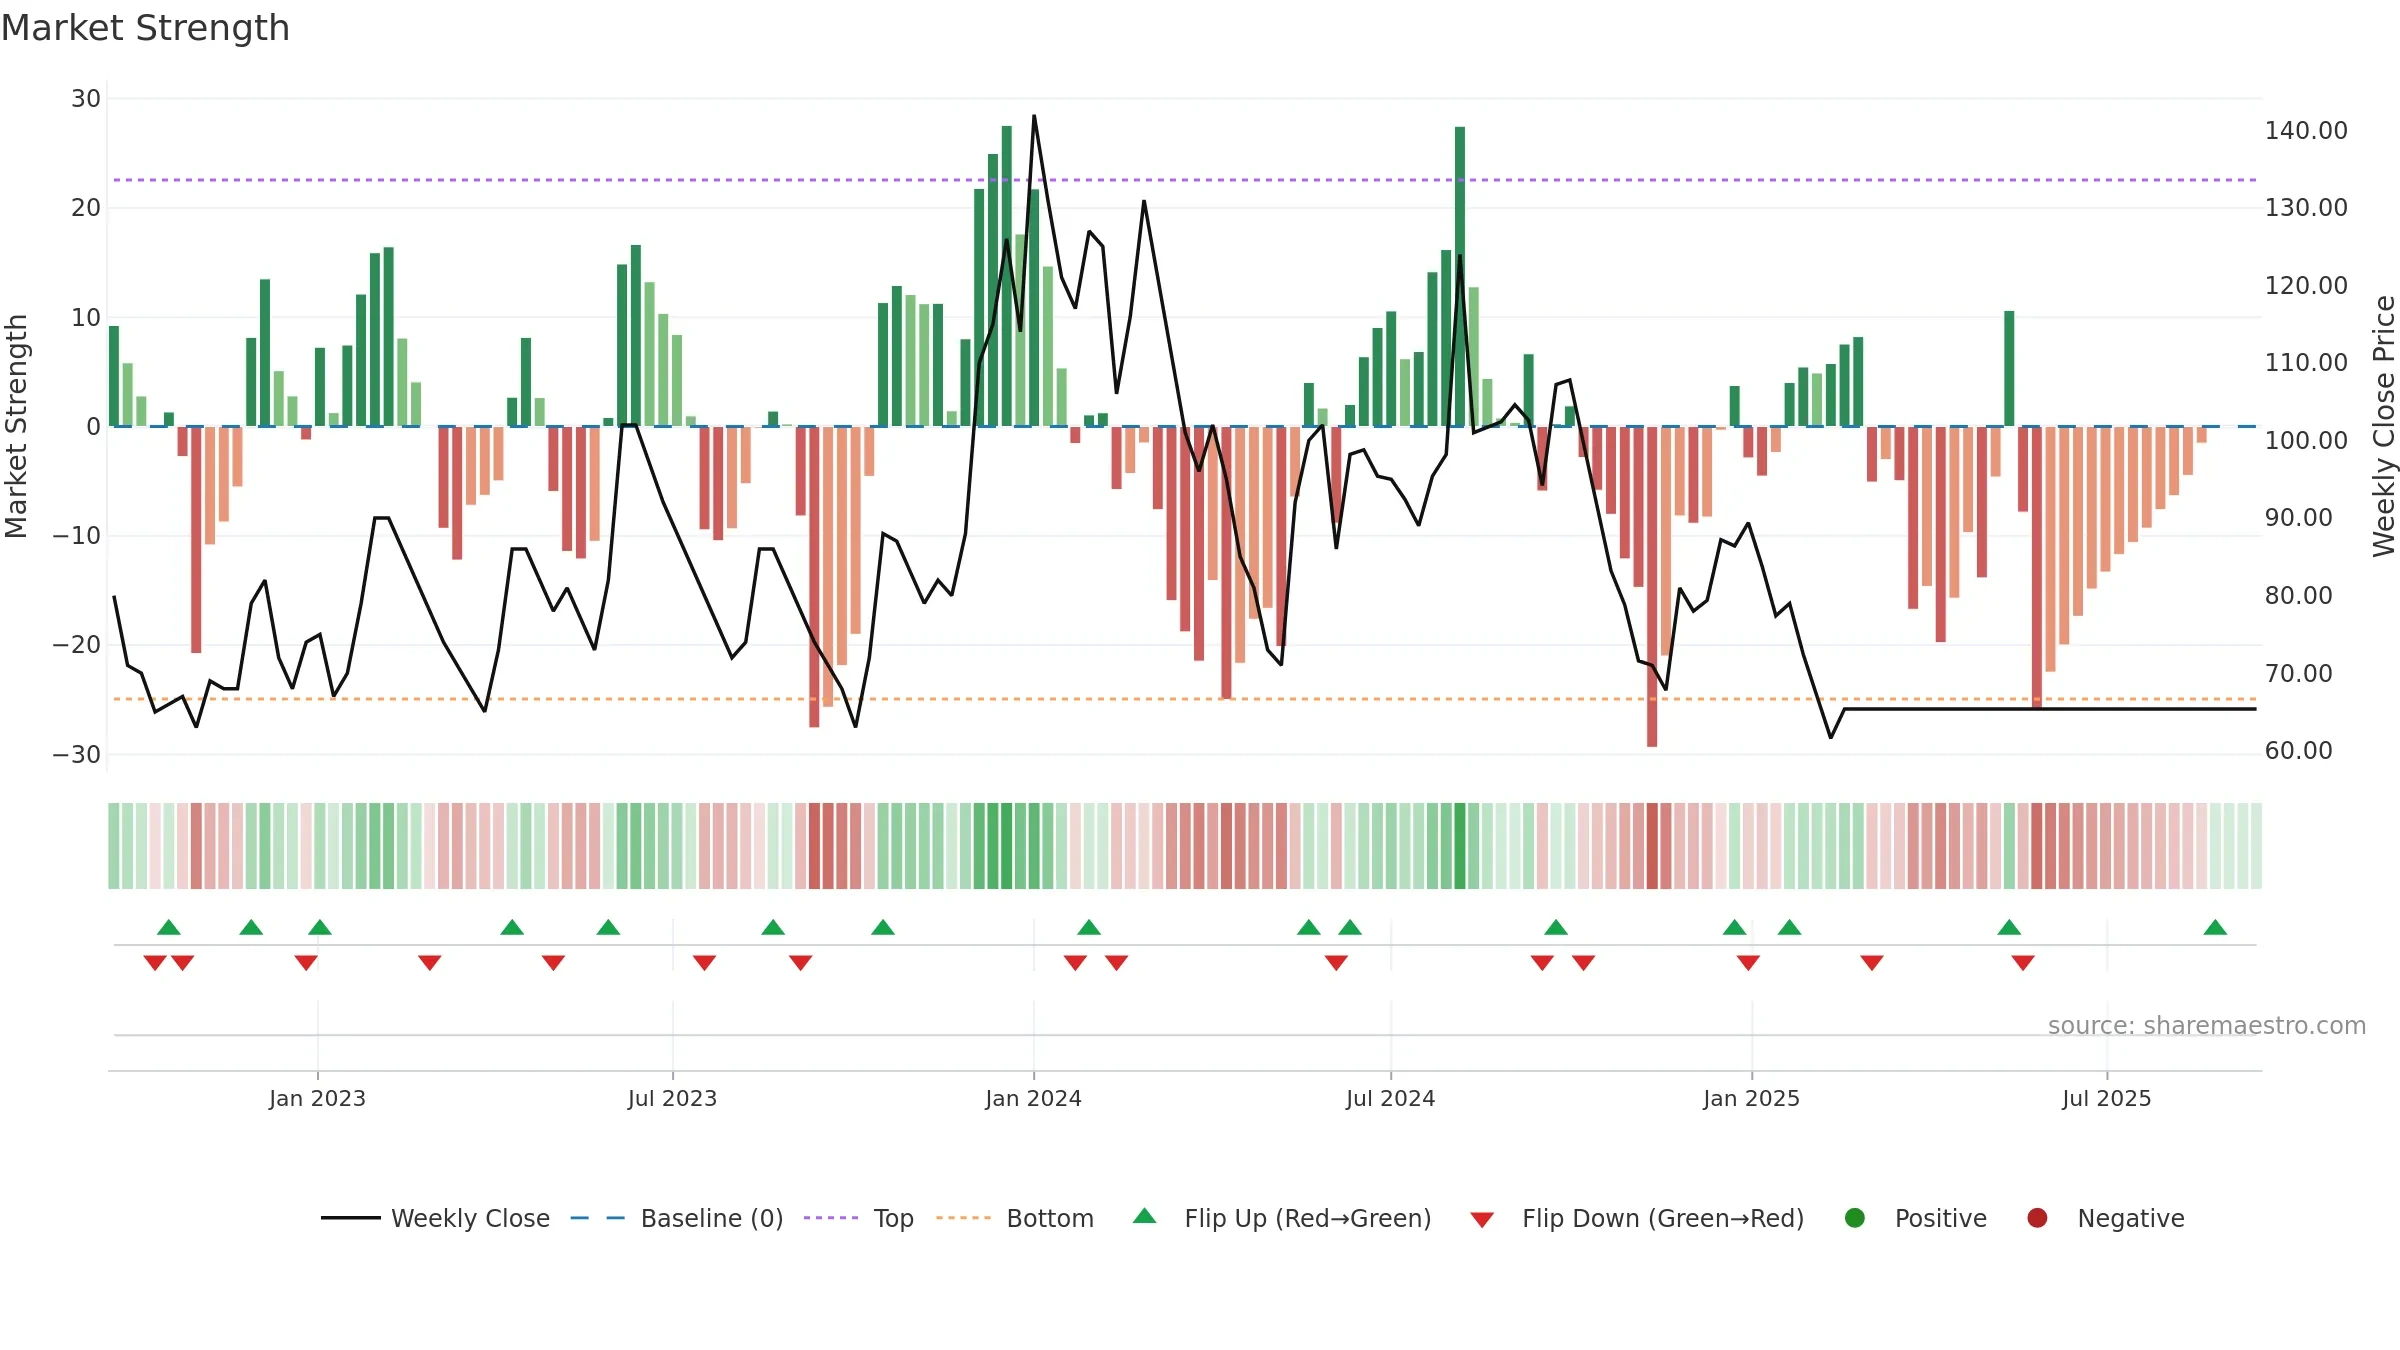
How to read this — Bearish backdrop but short-term momentum is improving; confirmation still needed.
Early improvement — look for a reclaim of 0.50→0.60 to validate.
Conclusion
Neutral setup. ★★★☆☆ confidence. Price window: 0. Trend: Bottoming Attempt; gauge 30. In combination, liquidity confirmation is mixed.
- Early improvement from bearish zone (bottoming attempt)
- Low return volatility supports durability
- Buyers step in at depressed levels (accumulation)
- Momentum is weak/falling
- Price is not above key averages
Why: Return volatility 0.00%. Liquidity flat with price. Trend state bottoming attempt. Low-regime (≤0.25) upticks 3/5 (60.0%) • Accumulating. Momentum bearish and rising.
Tip: Most metrics include a hover tooltip where they appear in the report.