Zhangjiagang Guangda Special Material Co., Ltd.
688186 SHA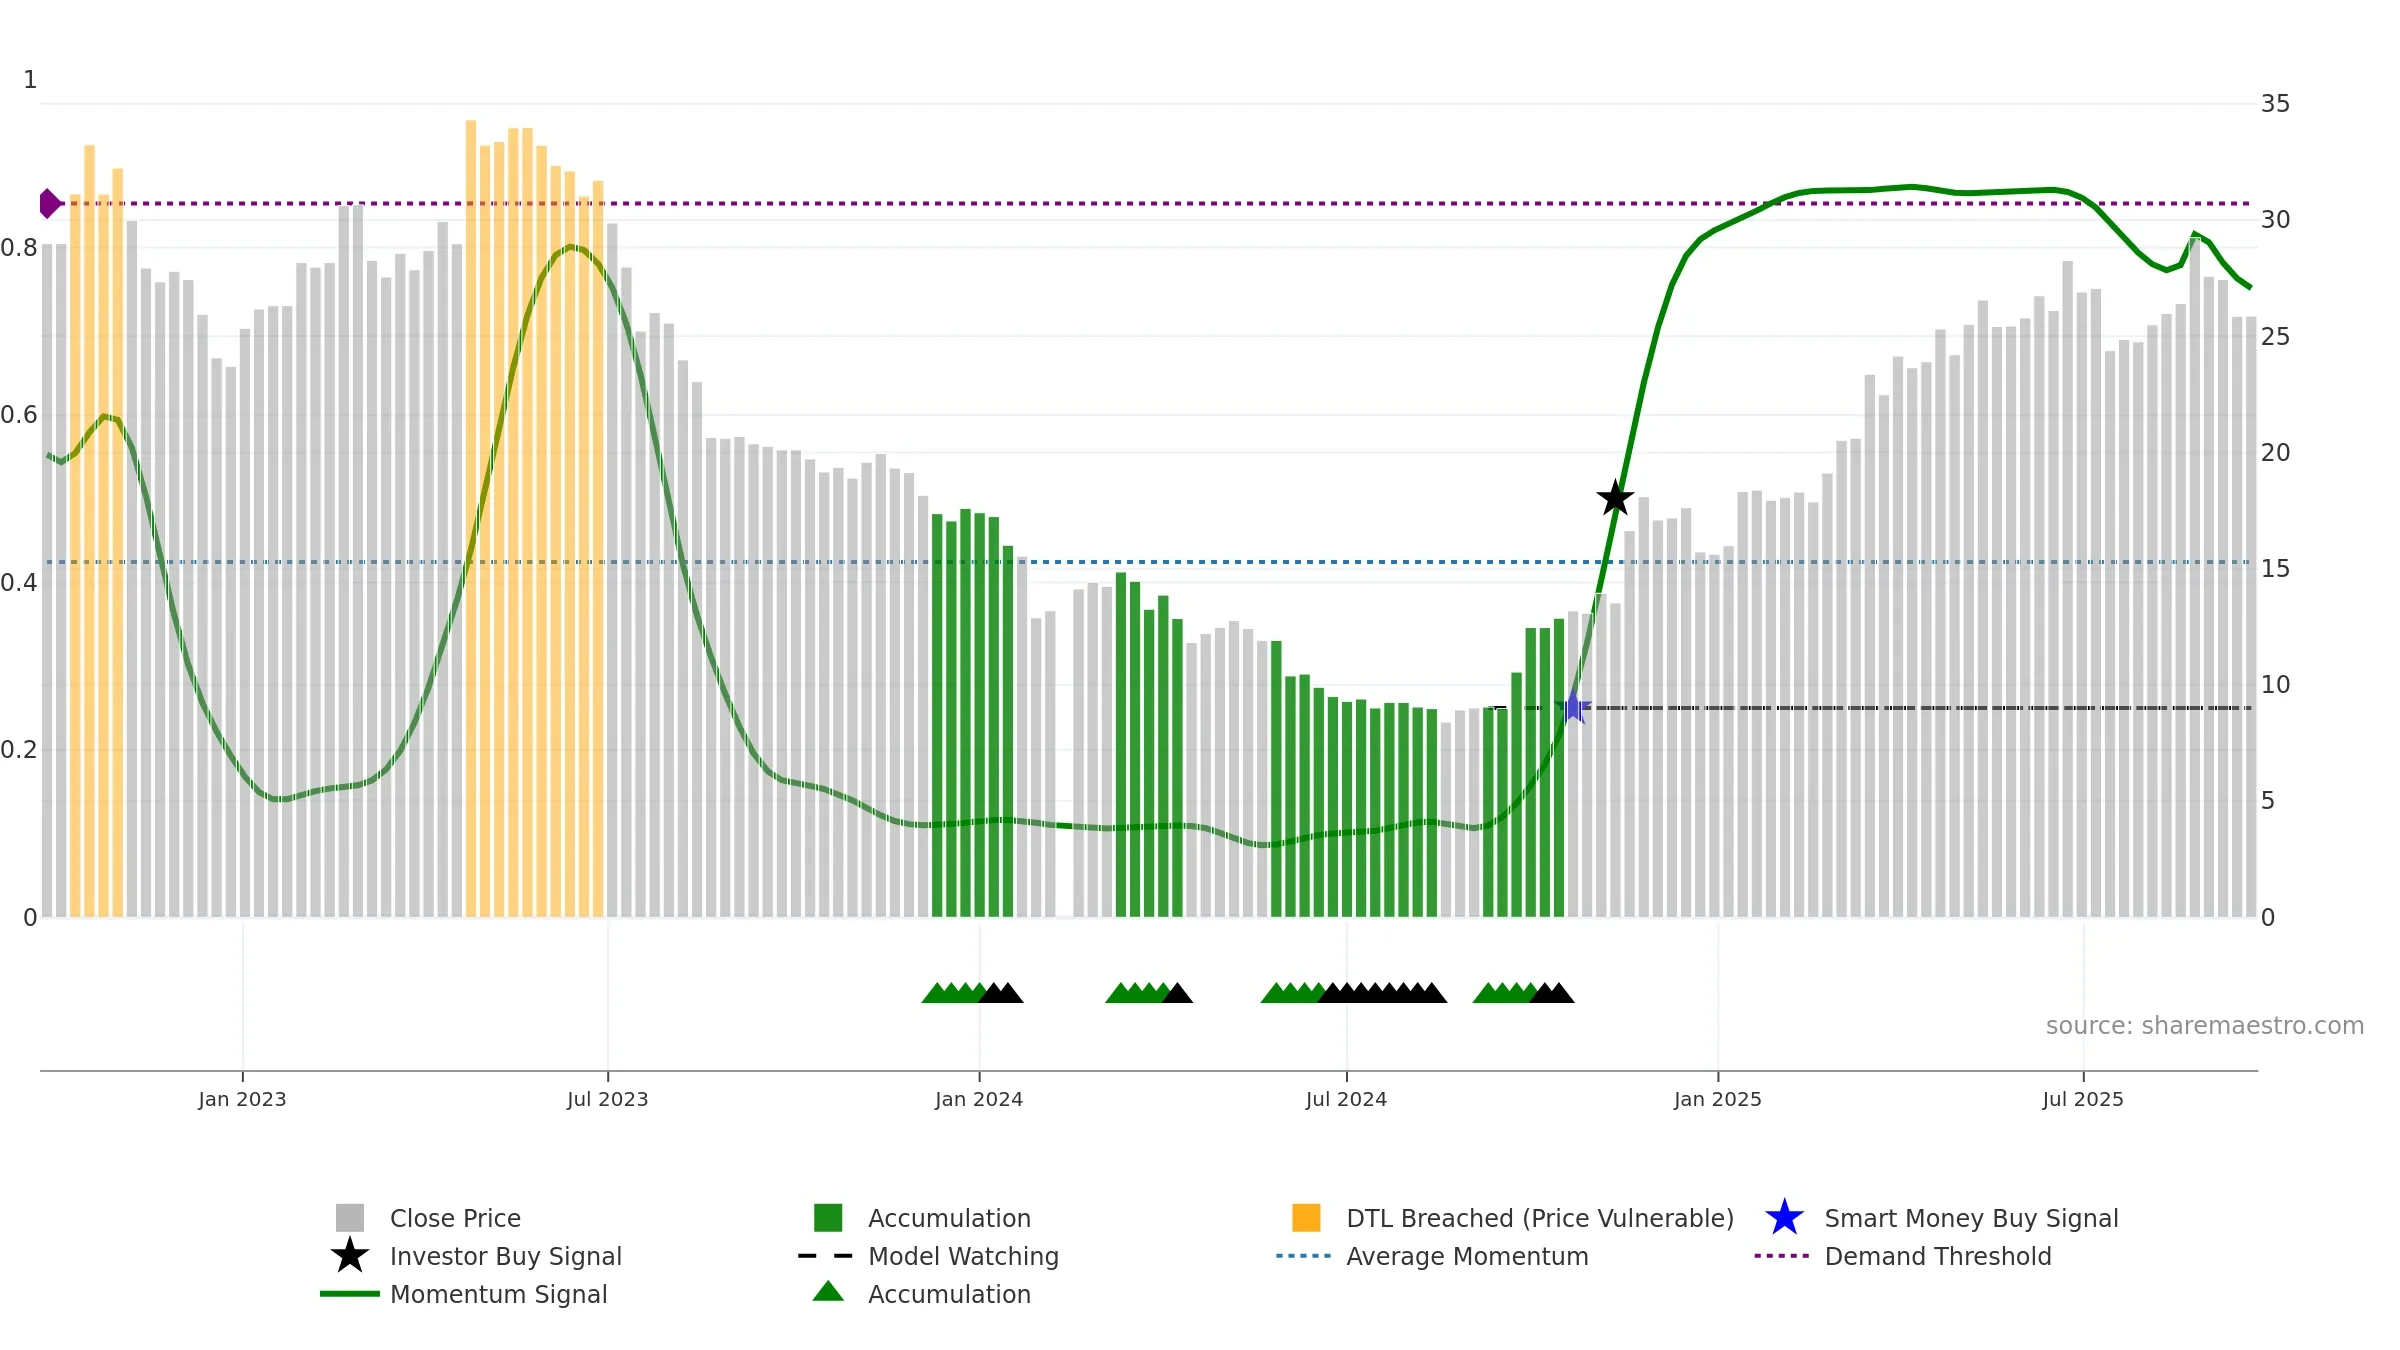
Weekly Summary
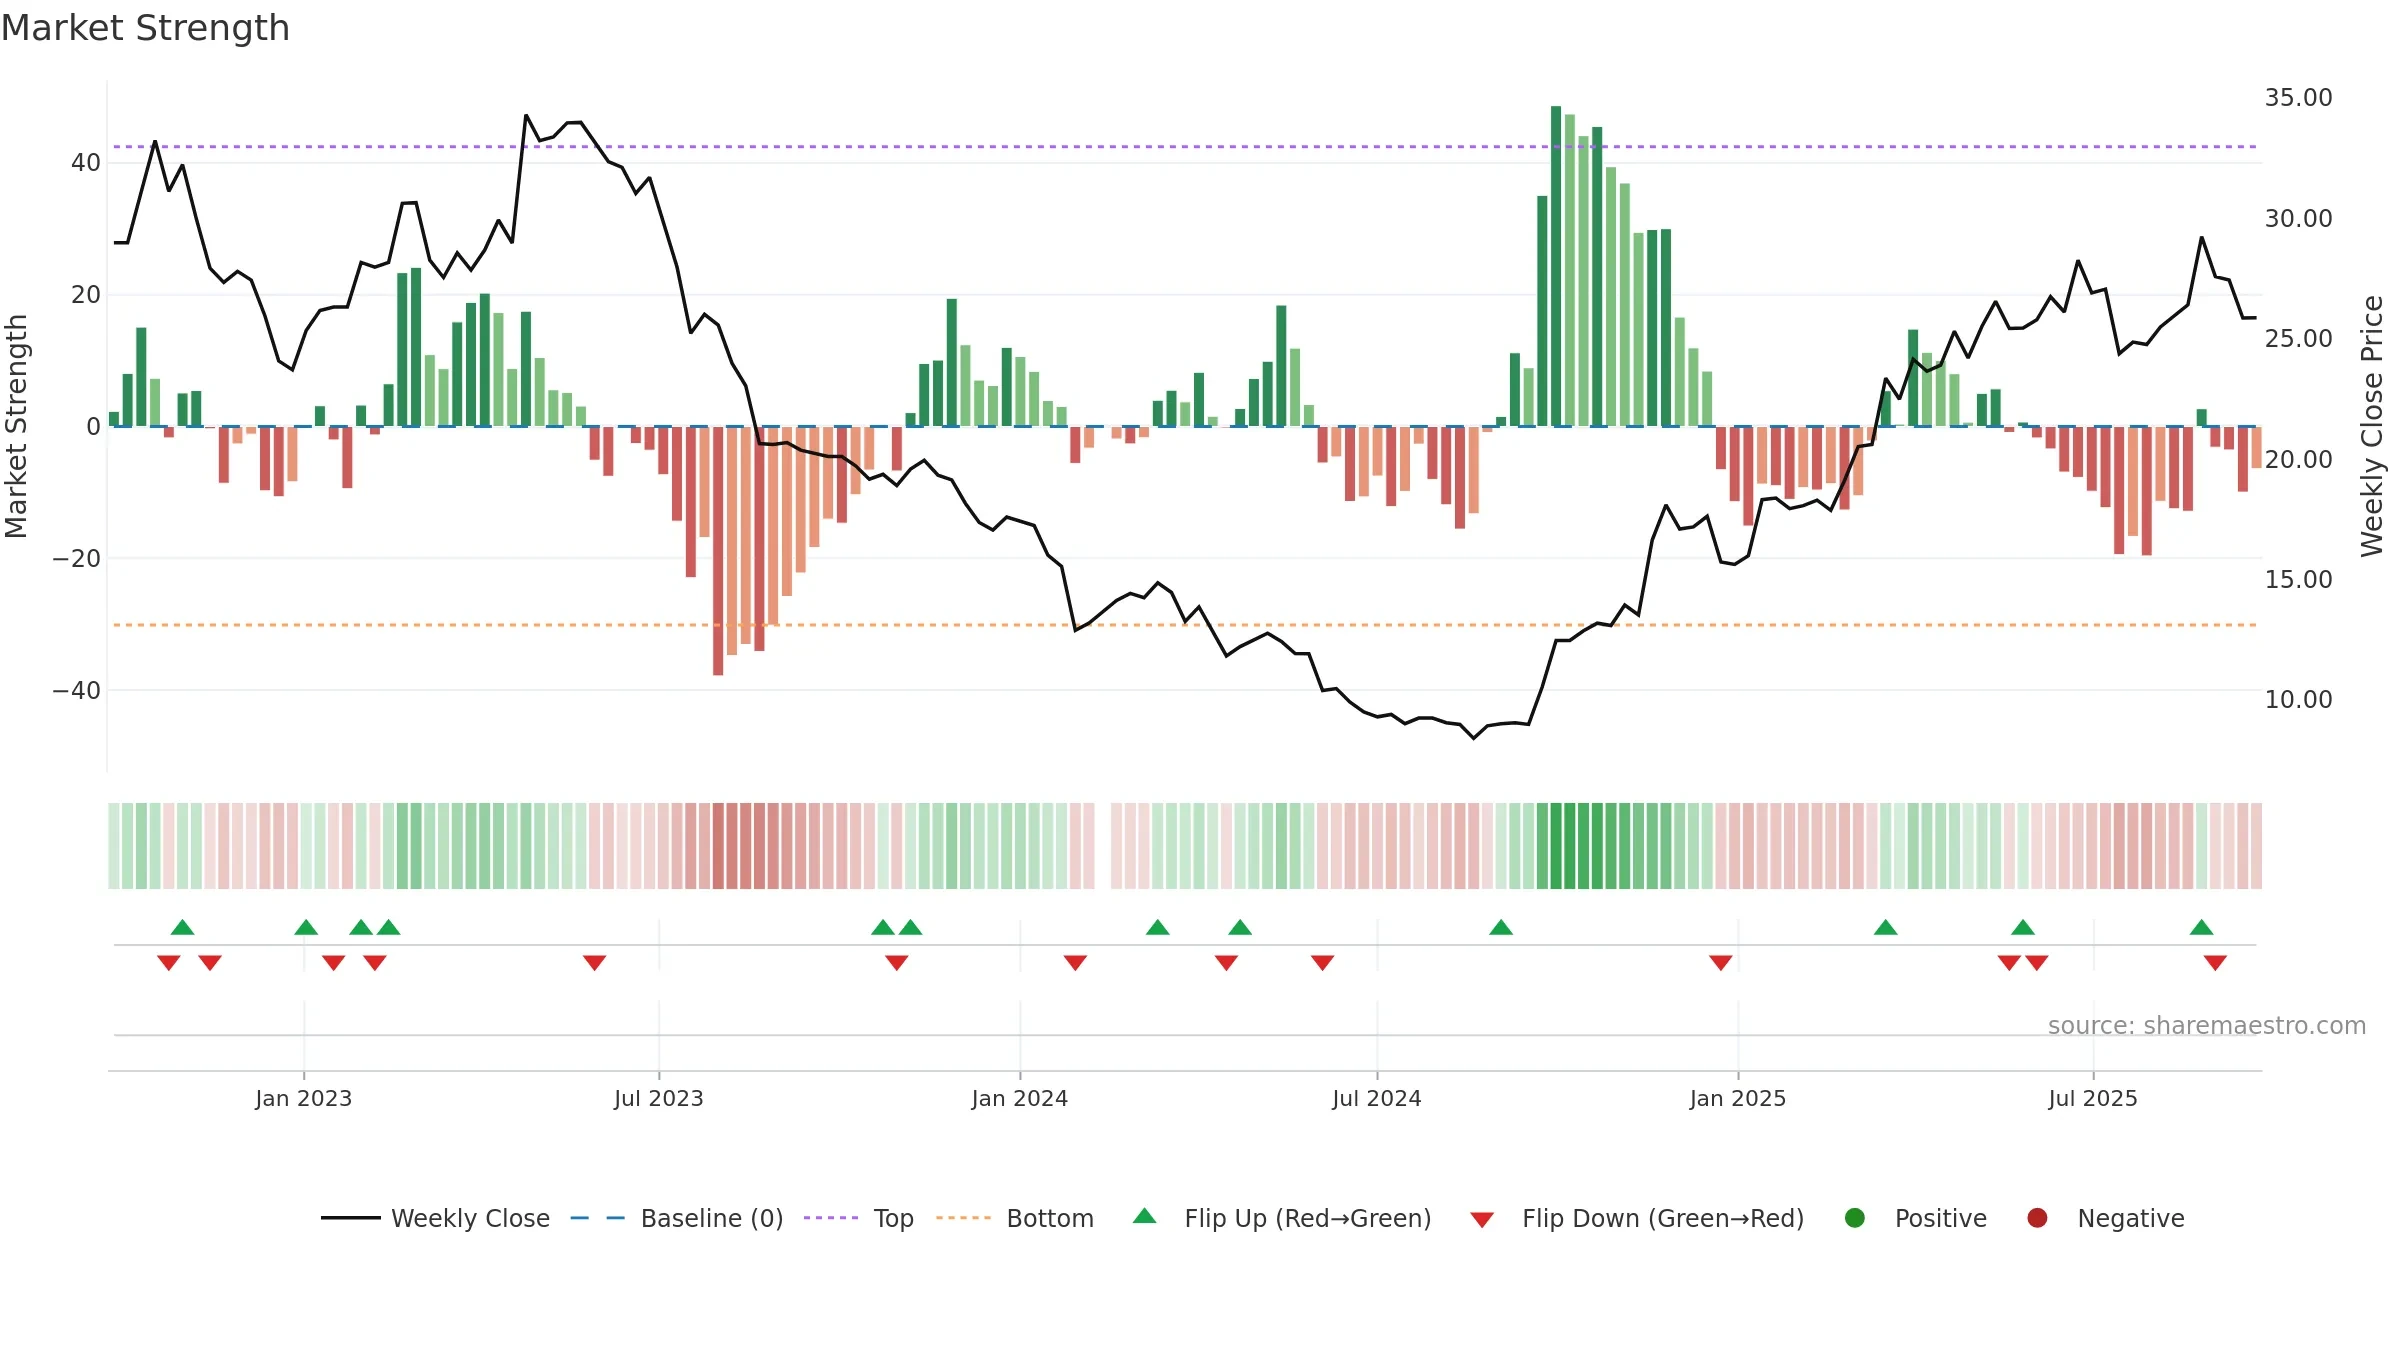
Zhangjiagang Guangda Special Material Co., Ltd. closed at 25.8700 (-2.01% WoW) . Data window ends Mon, 22 Sep 2025.
How to read this — Price slope is upward, indicating persistent buying over the window. Volume trend diverges from price — watch for fatigue or rotation. Returns are positively correlated with volume — strength tends to arrive on higher activity. Fresh short-term downside crossover weakens near-term tone. Price sits below key averages, keeping pressure on the tape.
Up-slope supports buying interest; pullbacks may be contained if activity stays firm. Because liquidity isn’t confirming, prefer evidence of fresh demand before chasing moves.
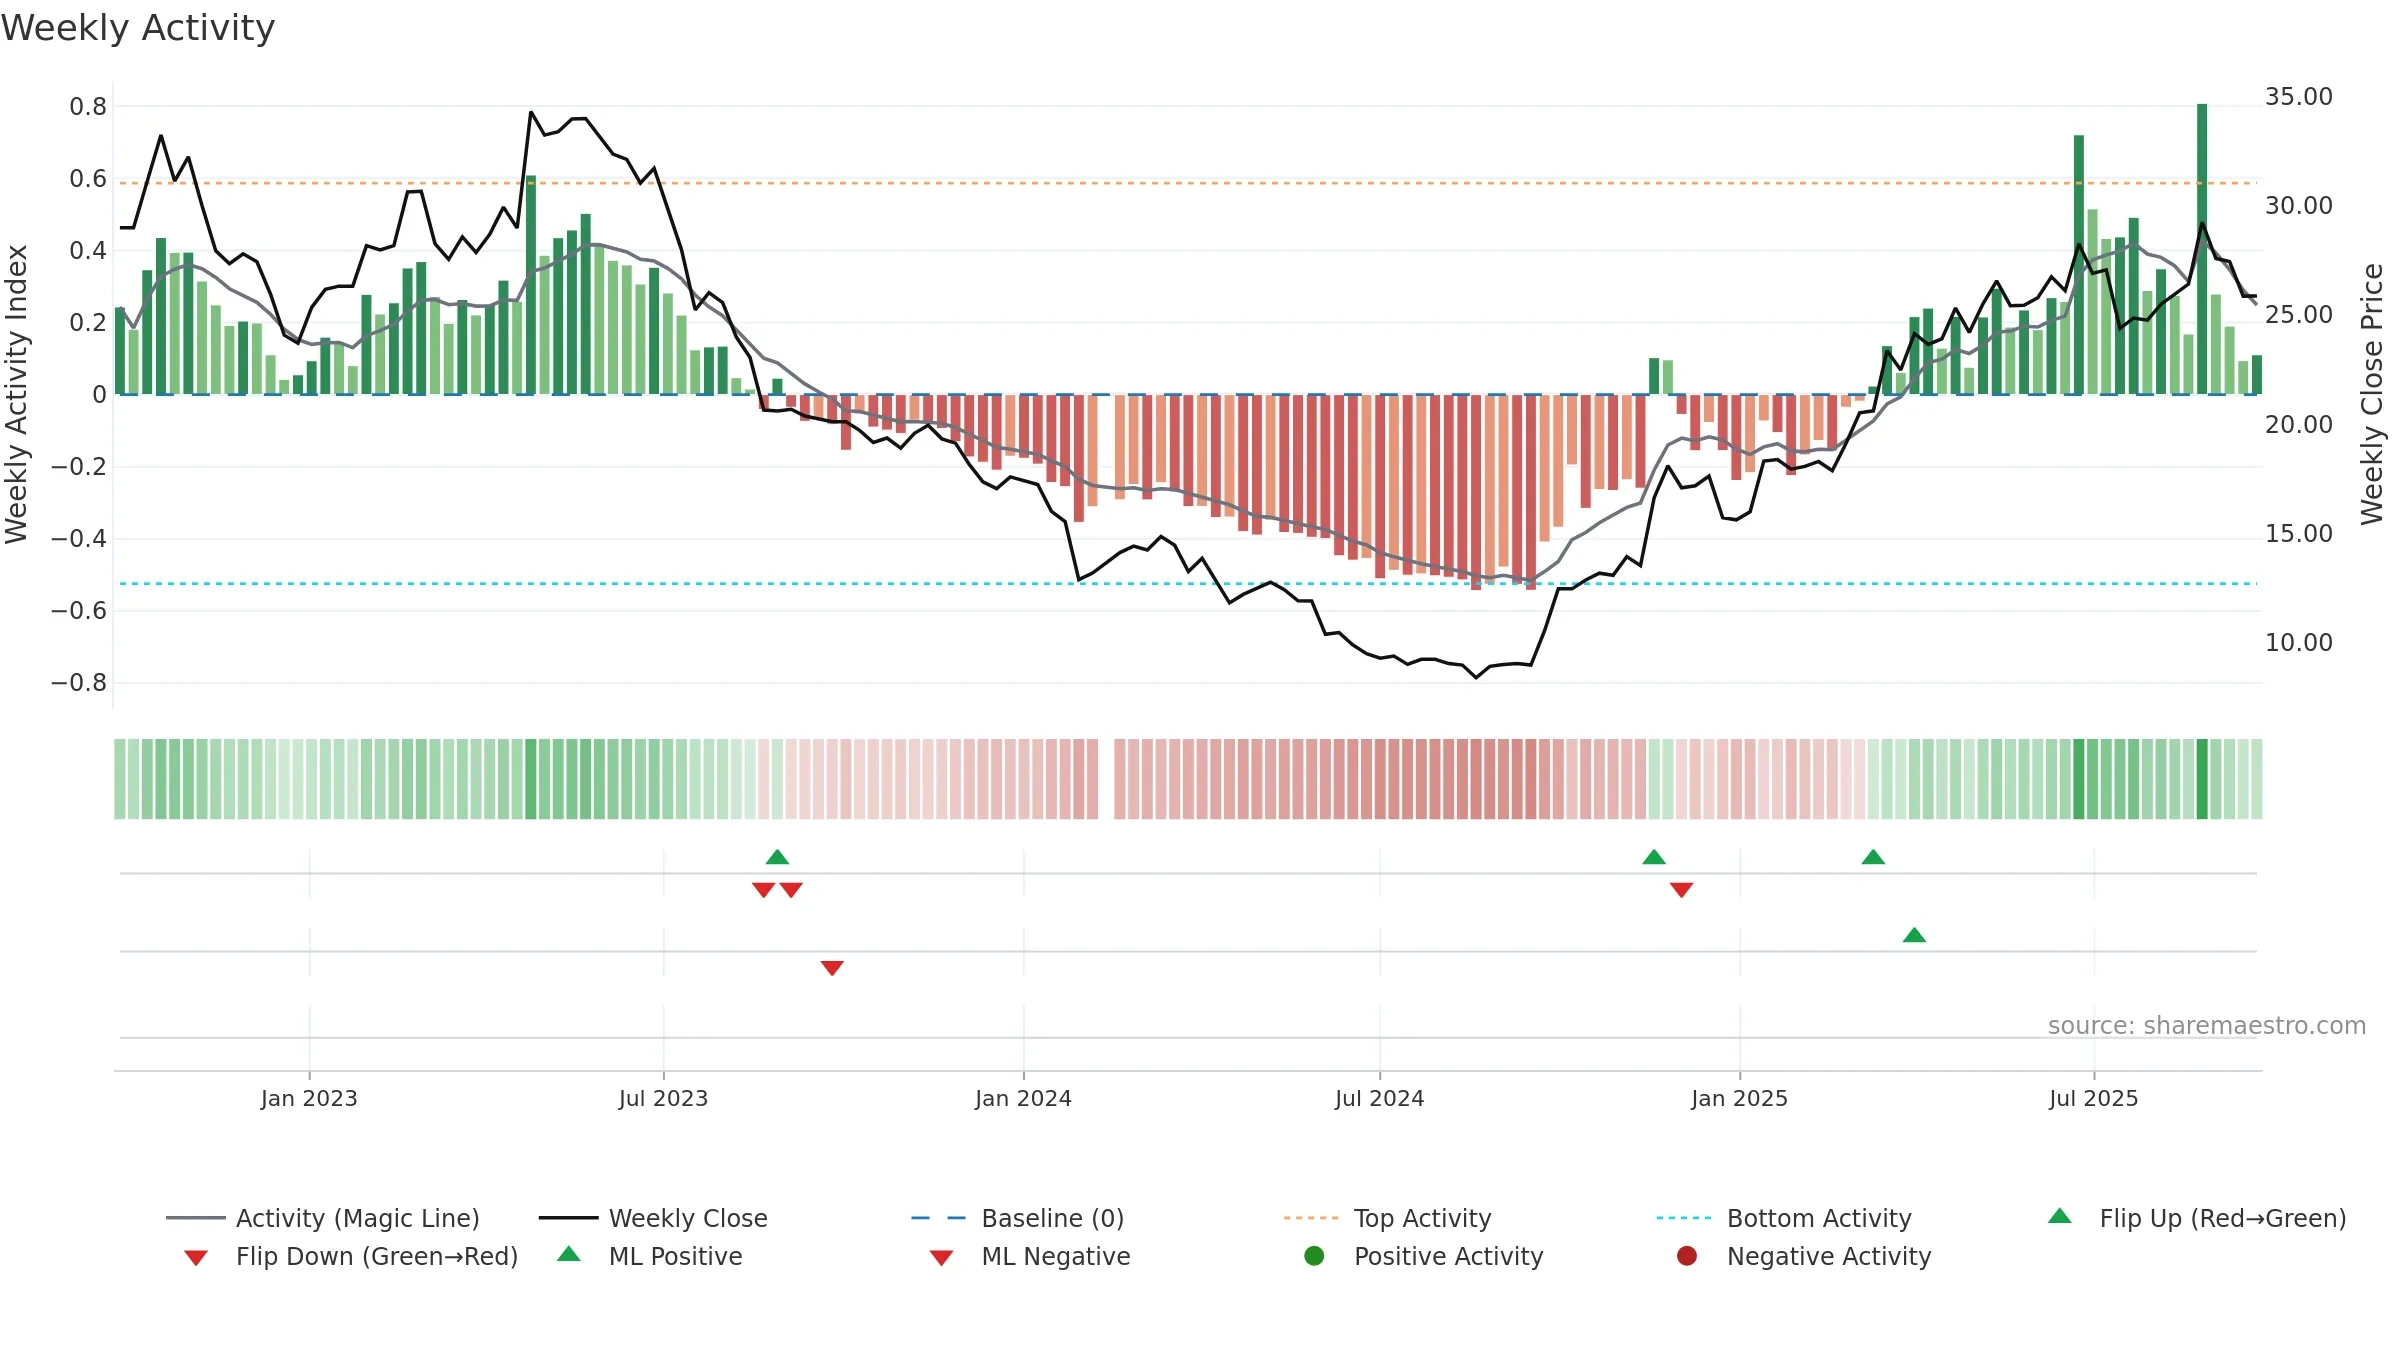
Gauge maps the trend signal to a 0–100 scale.
How to read this — Gauge is elevated but momentum is rolling over; topping risk is rising. Notable breakdown from ≥0.80 weakens trend quality.
Stay alert: protect gains or seek confirmation before adding risk.

Relative strength is Negative
(< 0%, underperforming).
Latest MRS: -3.84% (week ending Fri, 19 Sep 2025).
Slope: Falling over 8w.
Notes:
- Below zero line indicates relative weakness vs benchmark.
- MRS slope falling over ~8 weeks.
The flag is positive: favourable upside skew with supportive conditions.
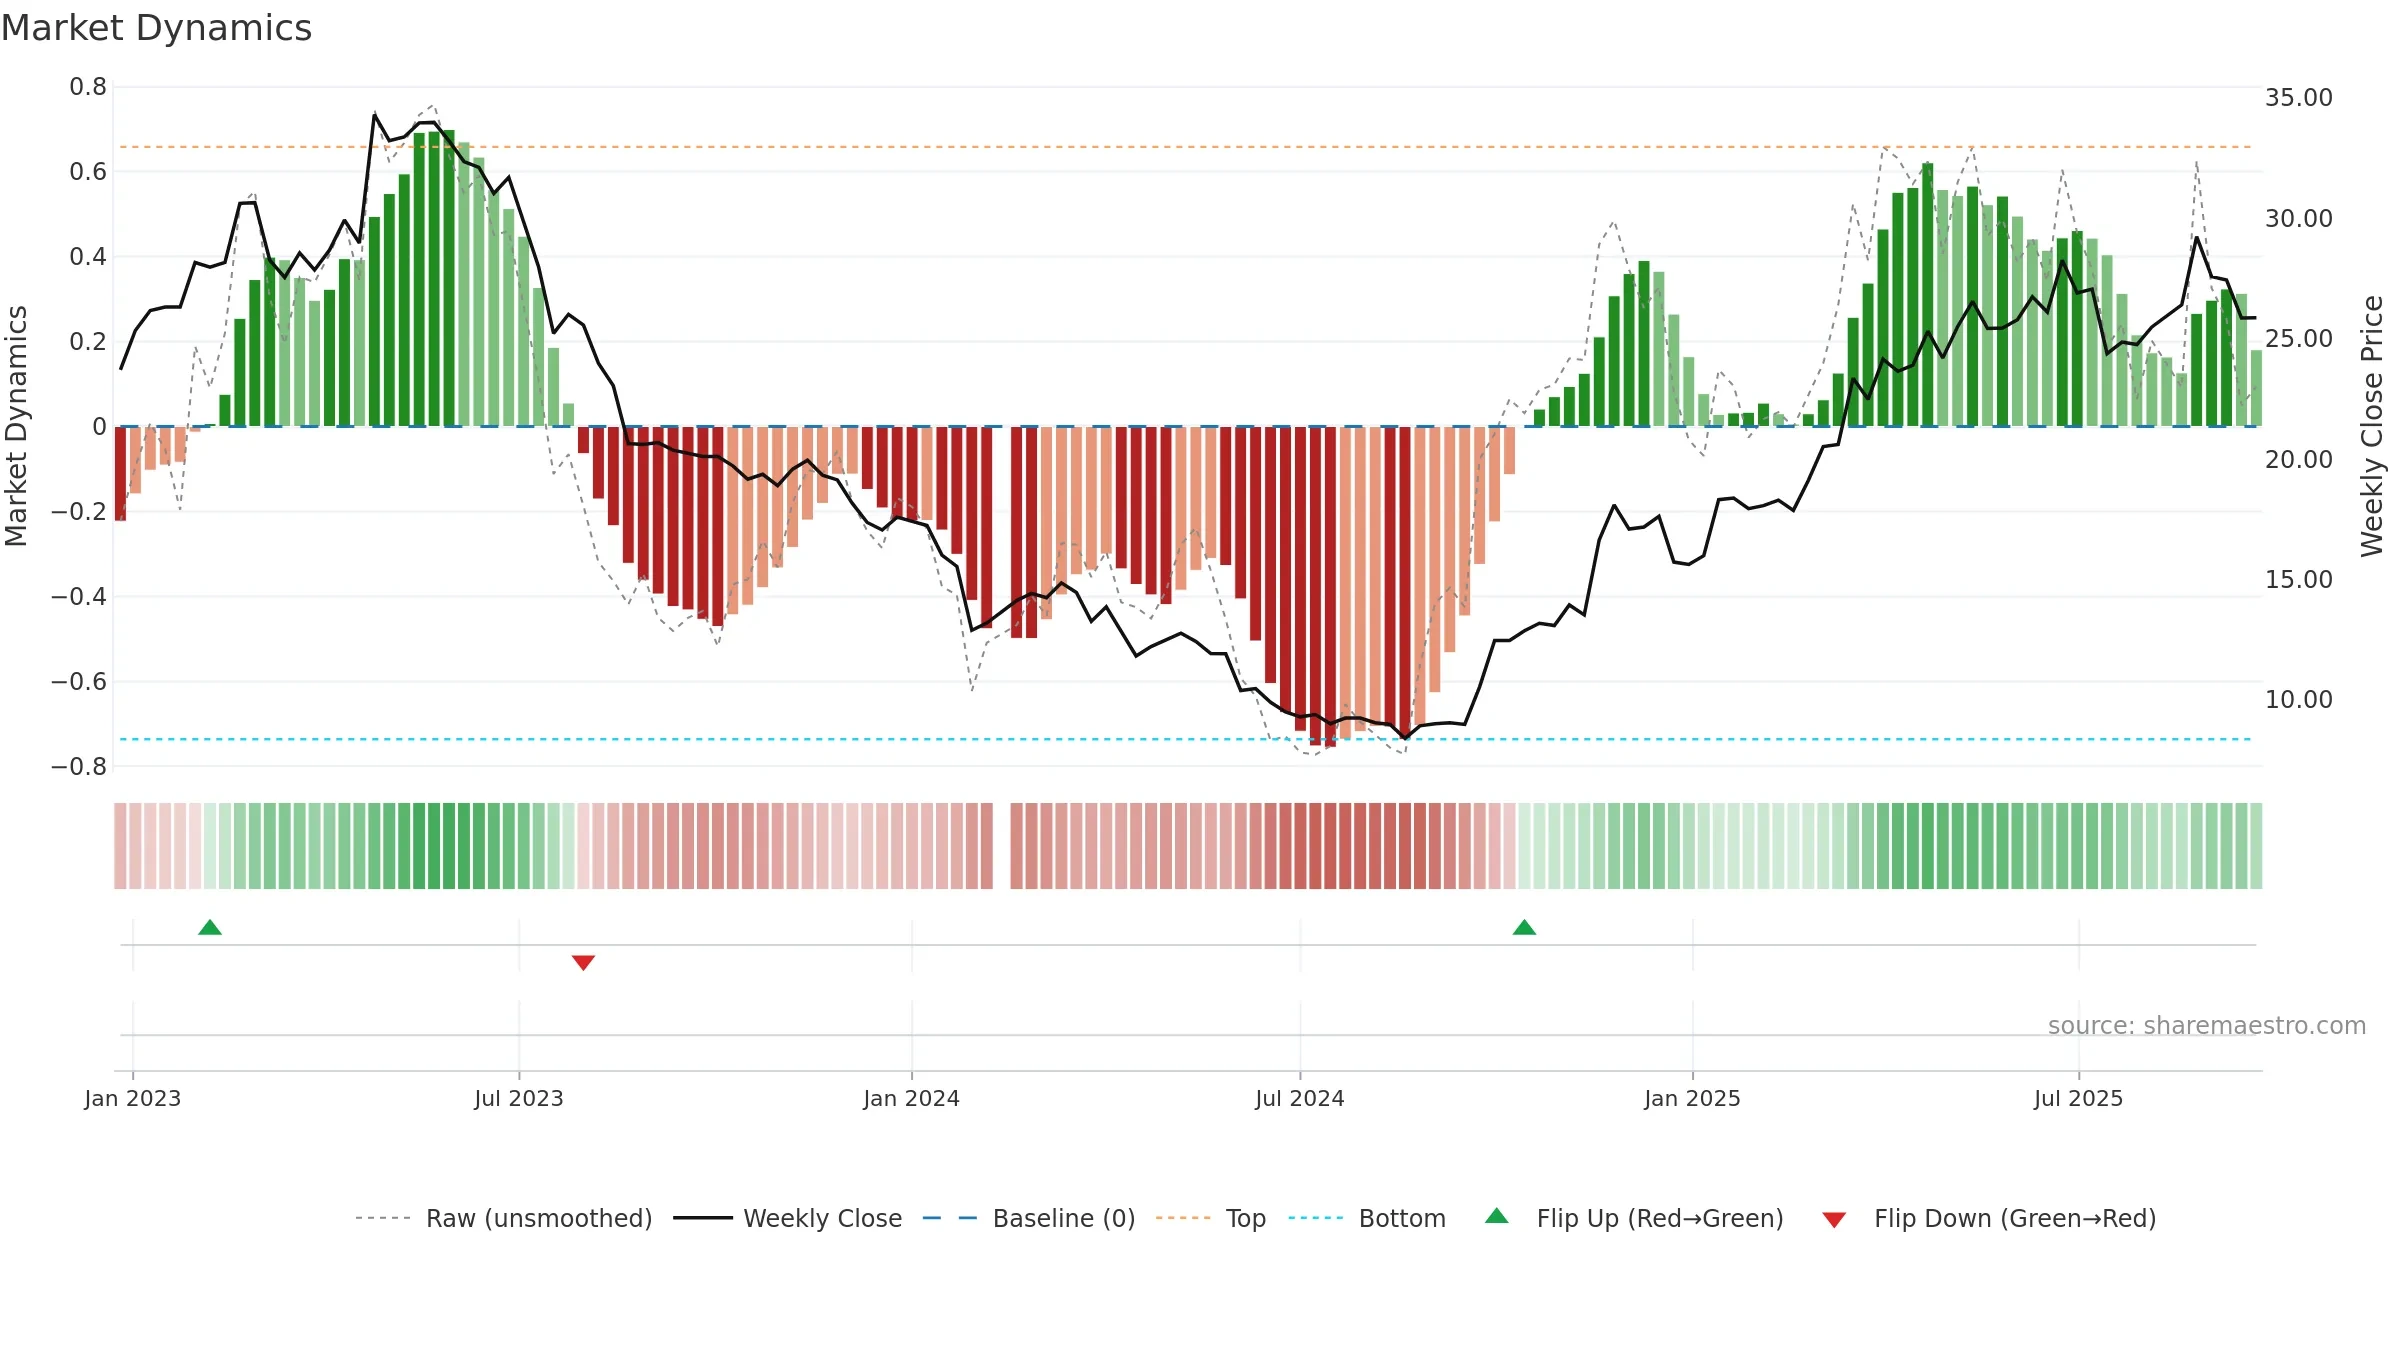
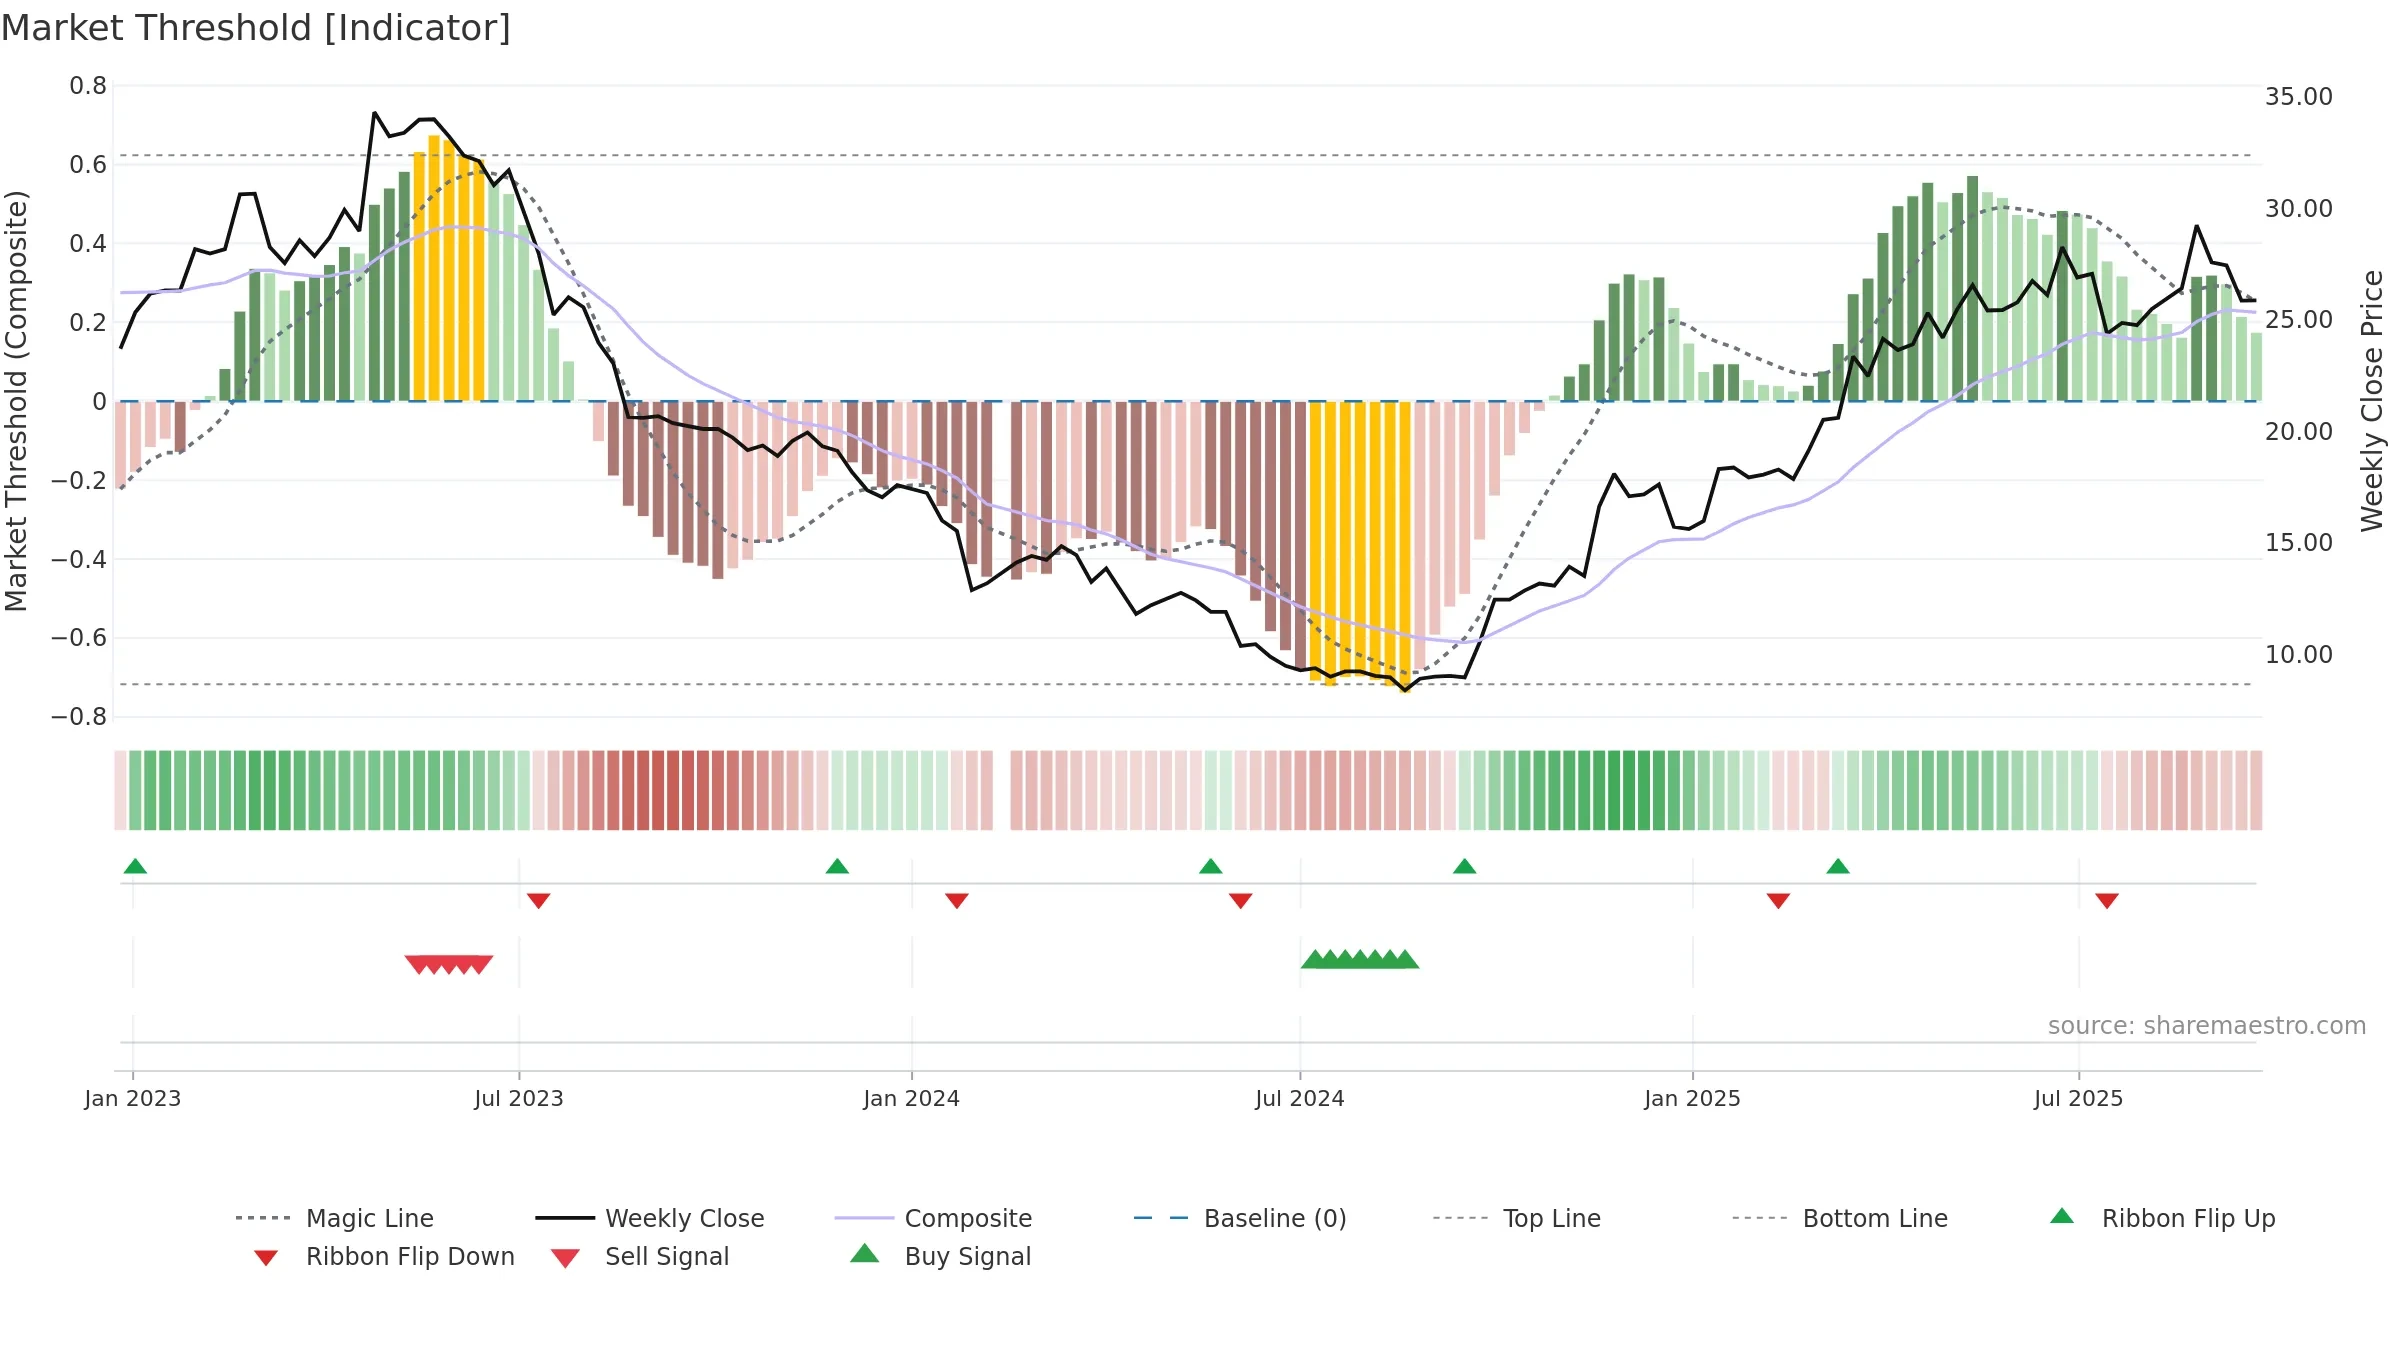
Conclusion
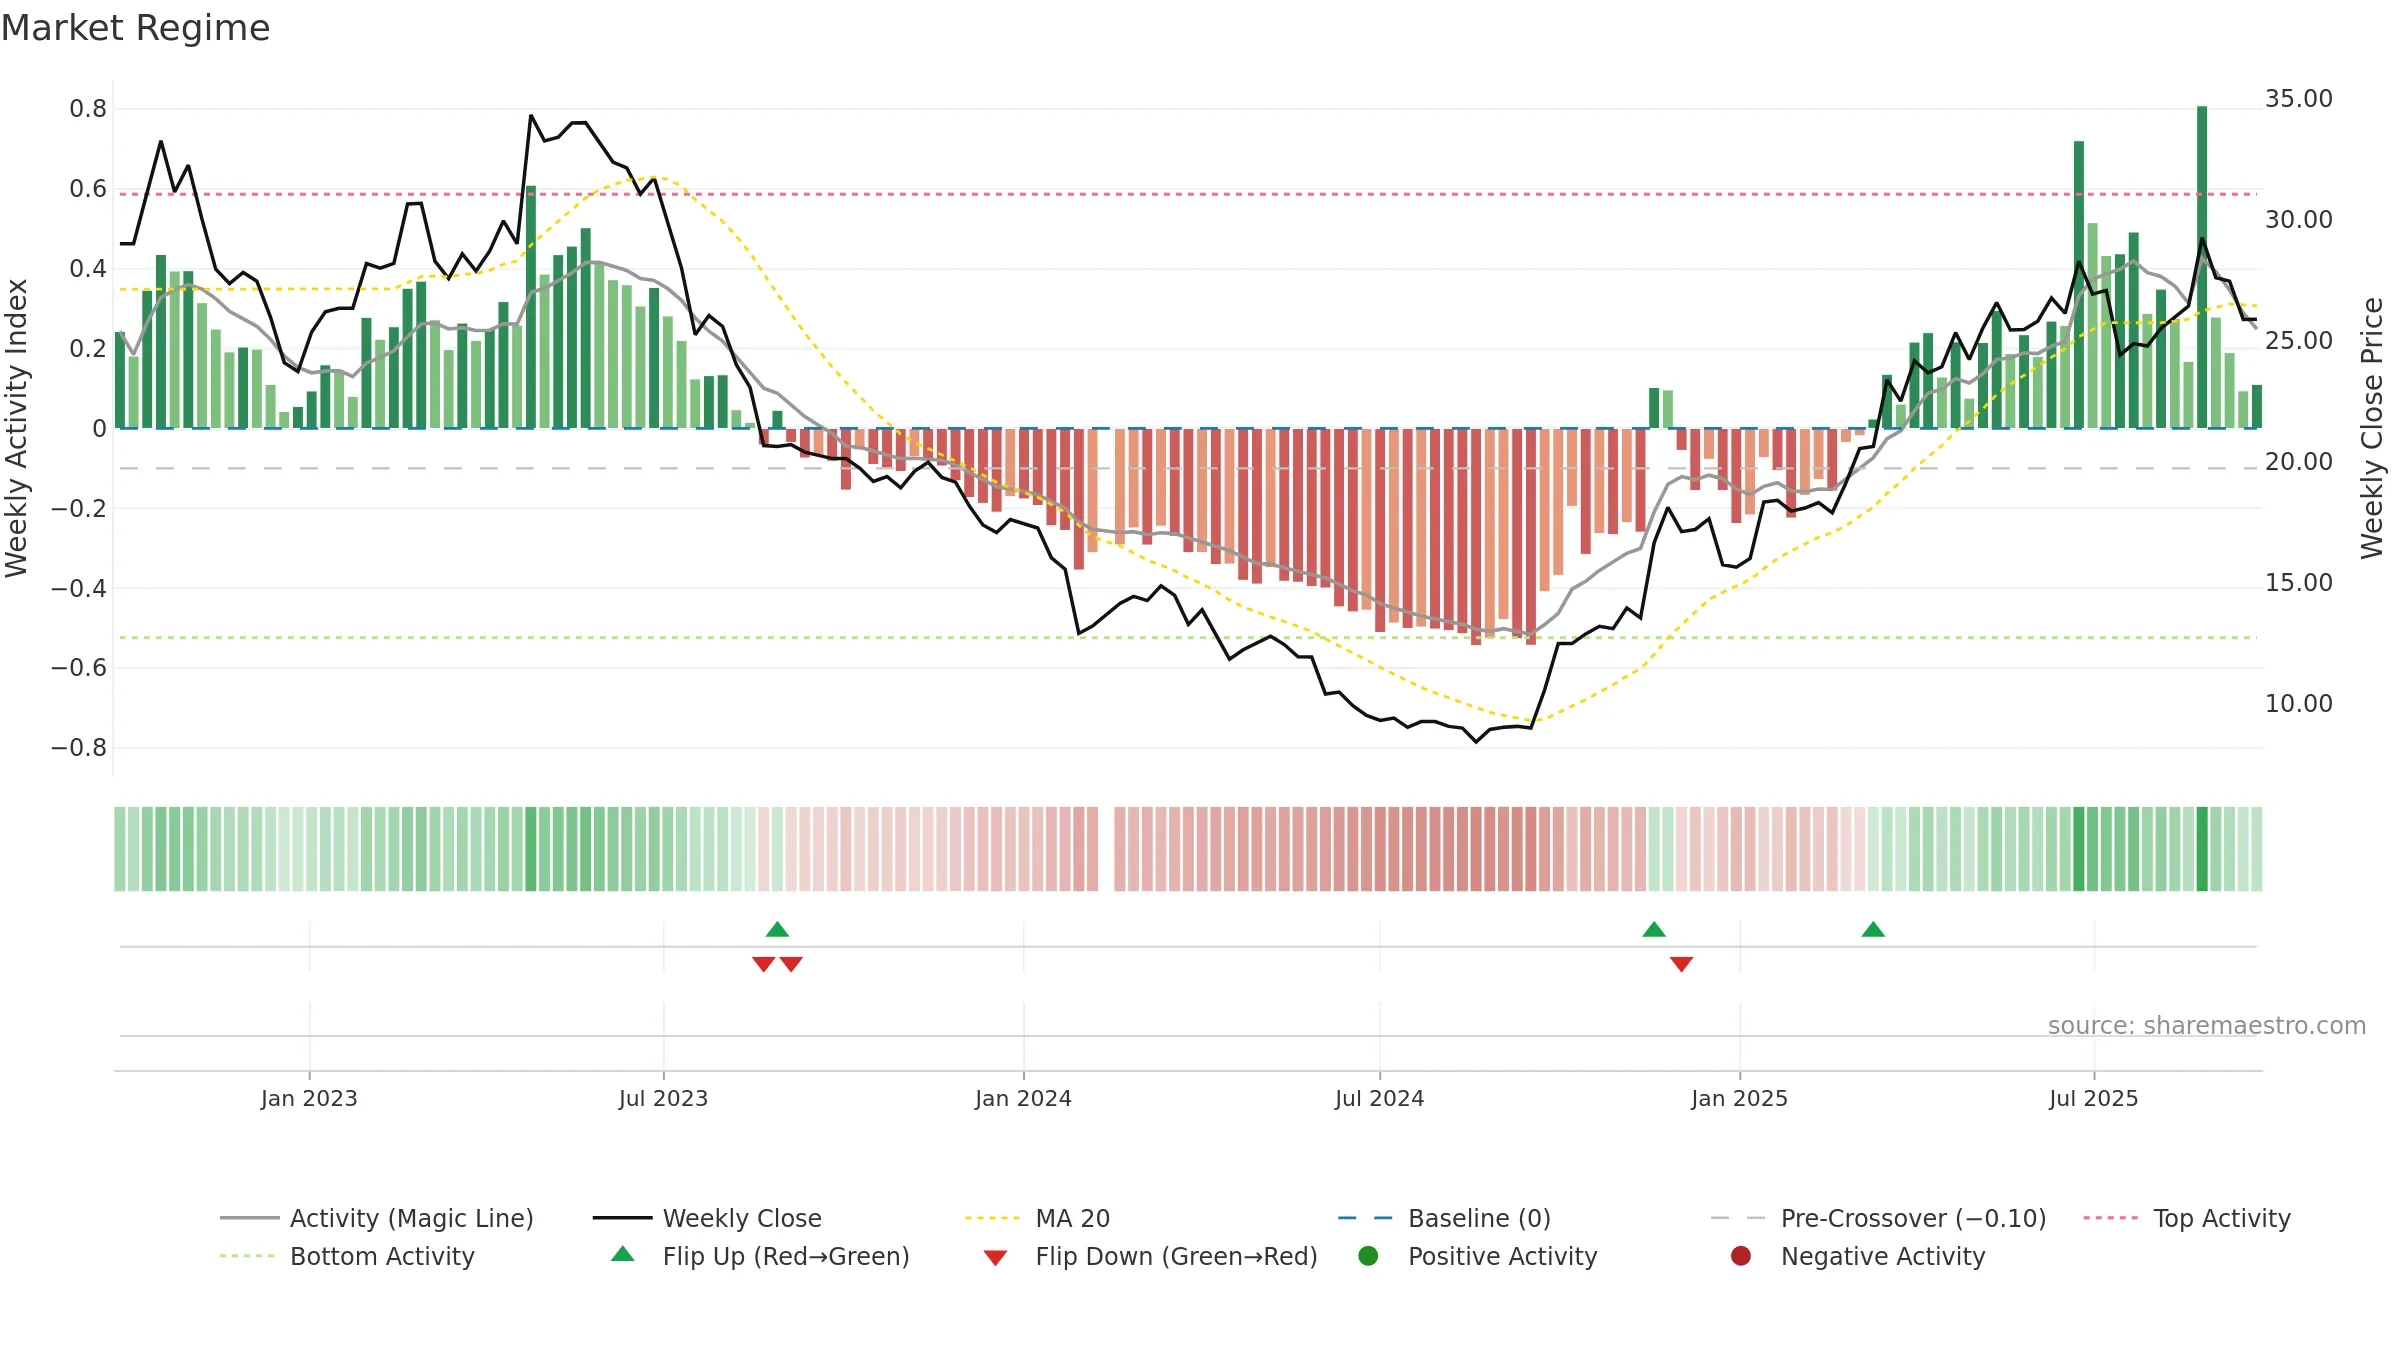
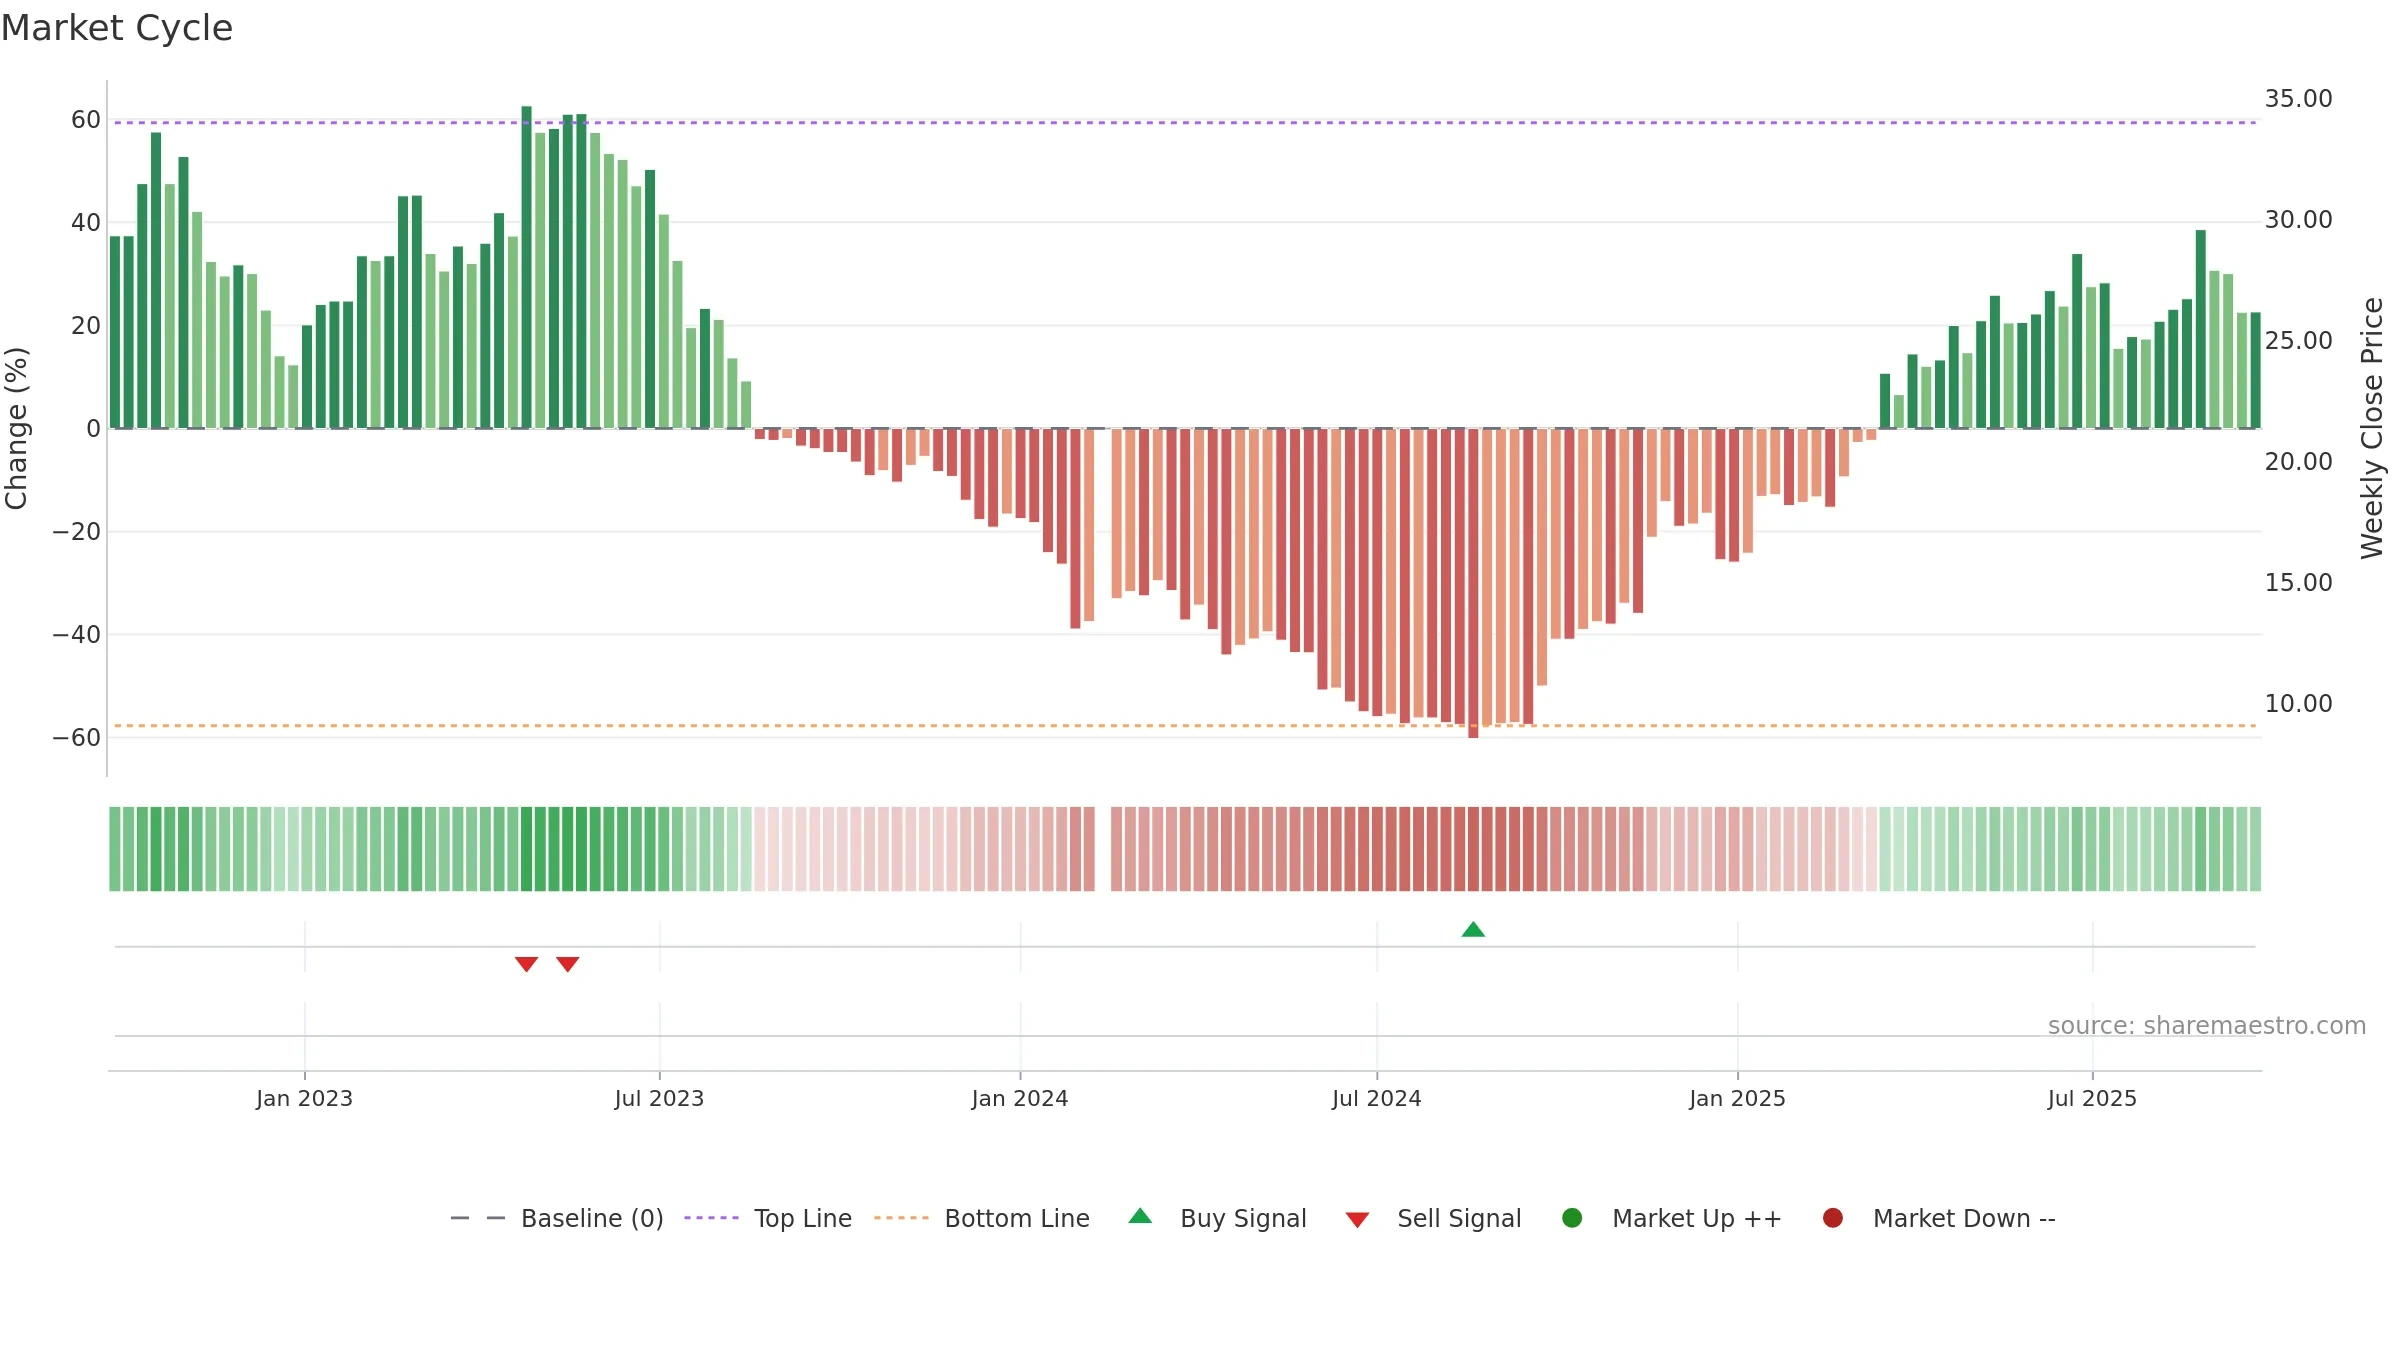
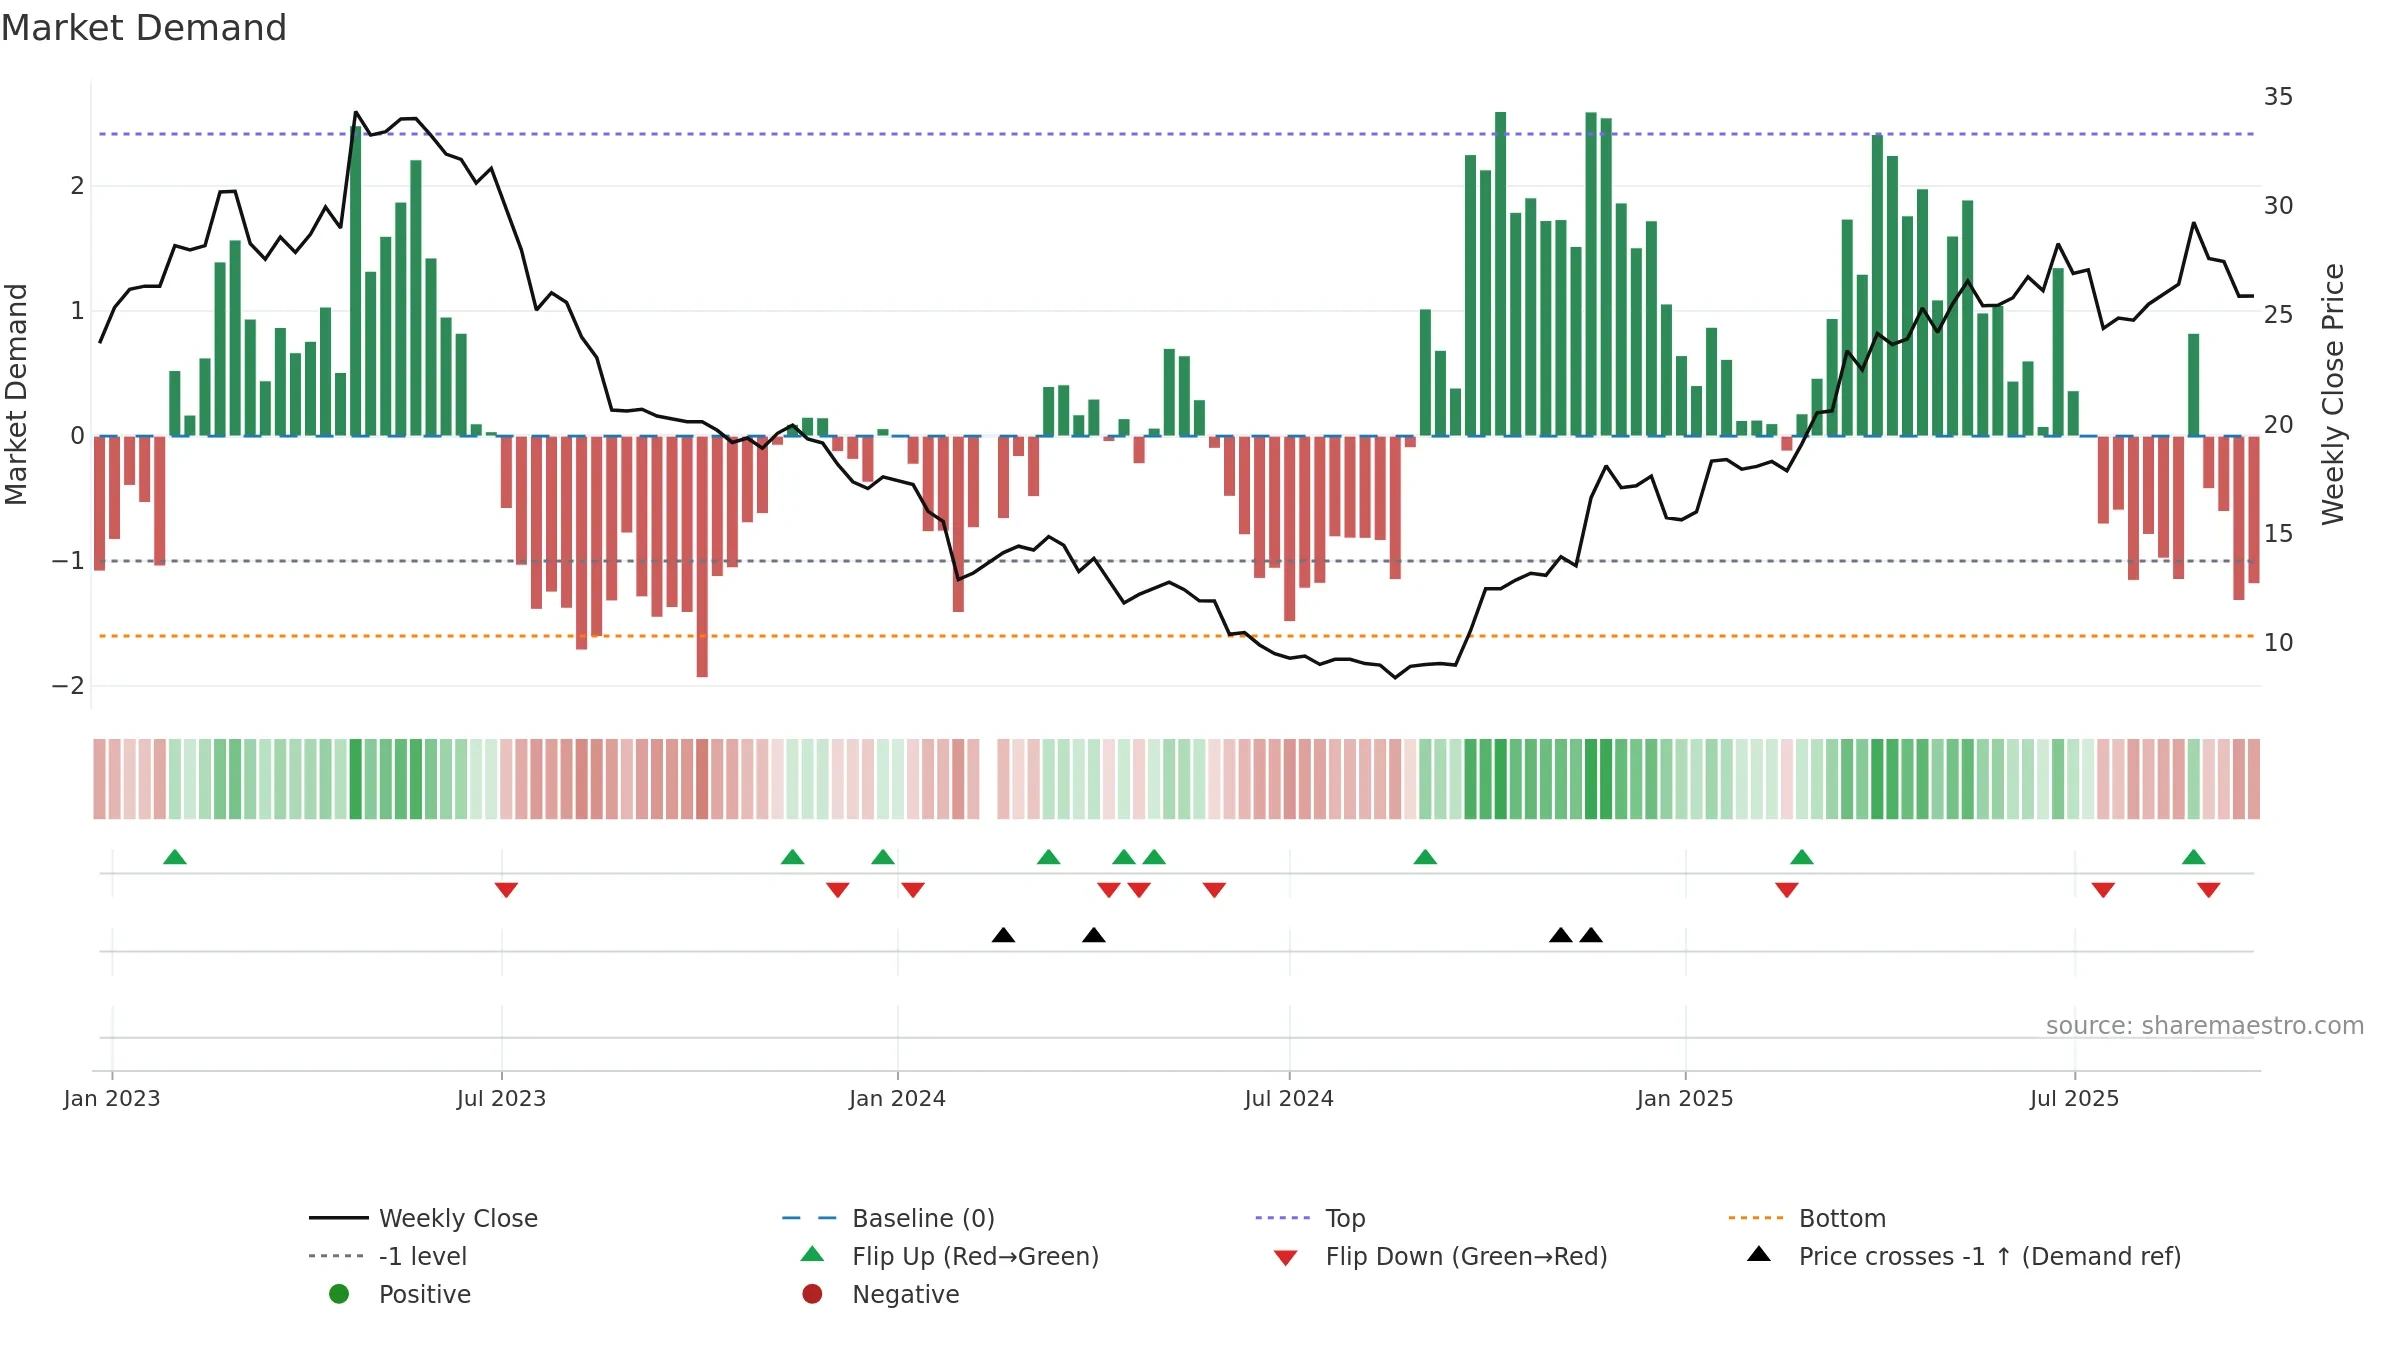
Negative setup. ★★⯪☆☆ confidence. Trend: Uptrend at Risk · 1.49% over window · vol 3.22% · liquidity divergence · posture below · leaning negative
- High level but momentum rolling over (topping risk)
- Momentum is weak/falling
- Price is not above key averages
- Liquidity diverges from price
Why: Price window 1.49% over w. Close is -11.53% below the prior-window high. Volume trend falling. Liquidity divergence with price. Trend state uptrend at risk. 4–8w crossover bearish. Momentum neutral and falling. Valuation stance positive.
Tip: Most metrics include a hover tooltip where they appear in the report.