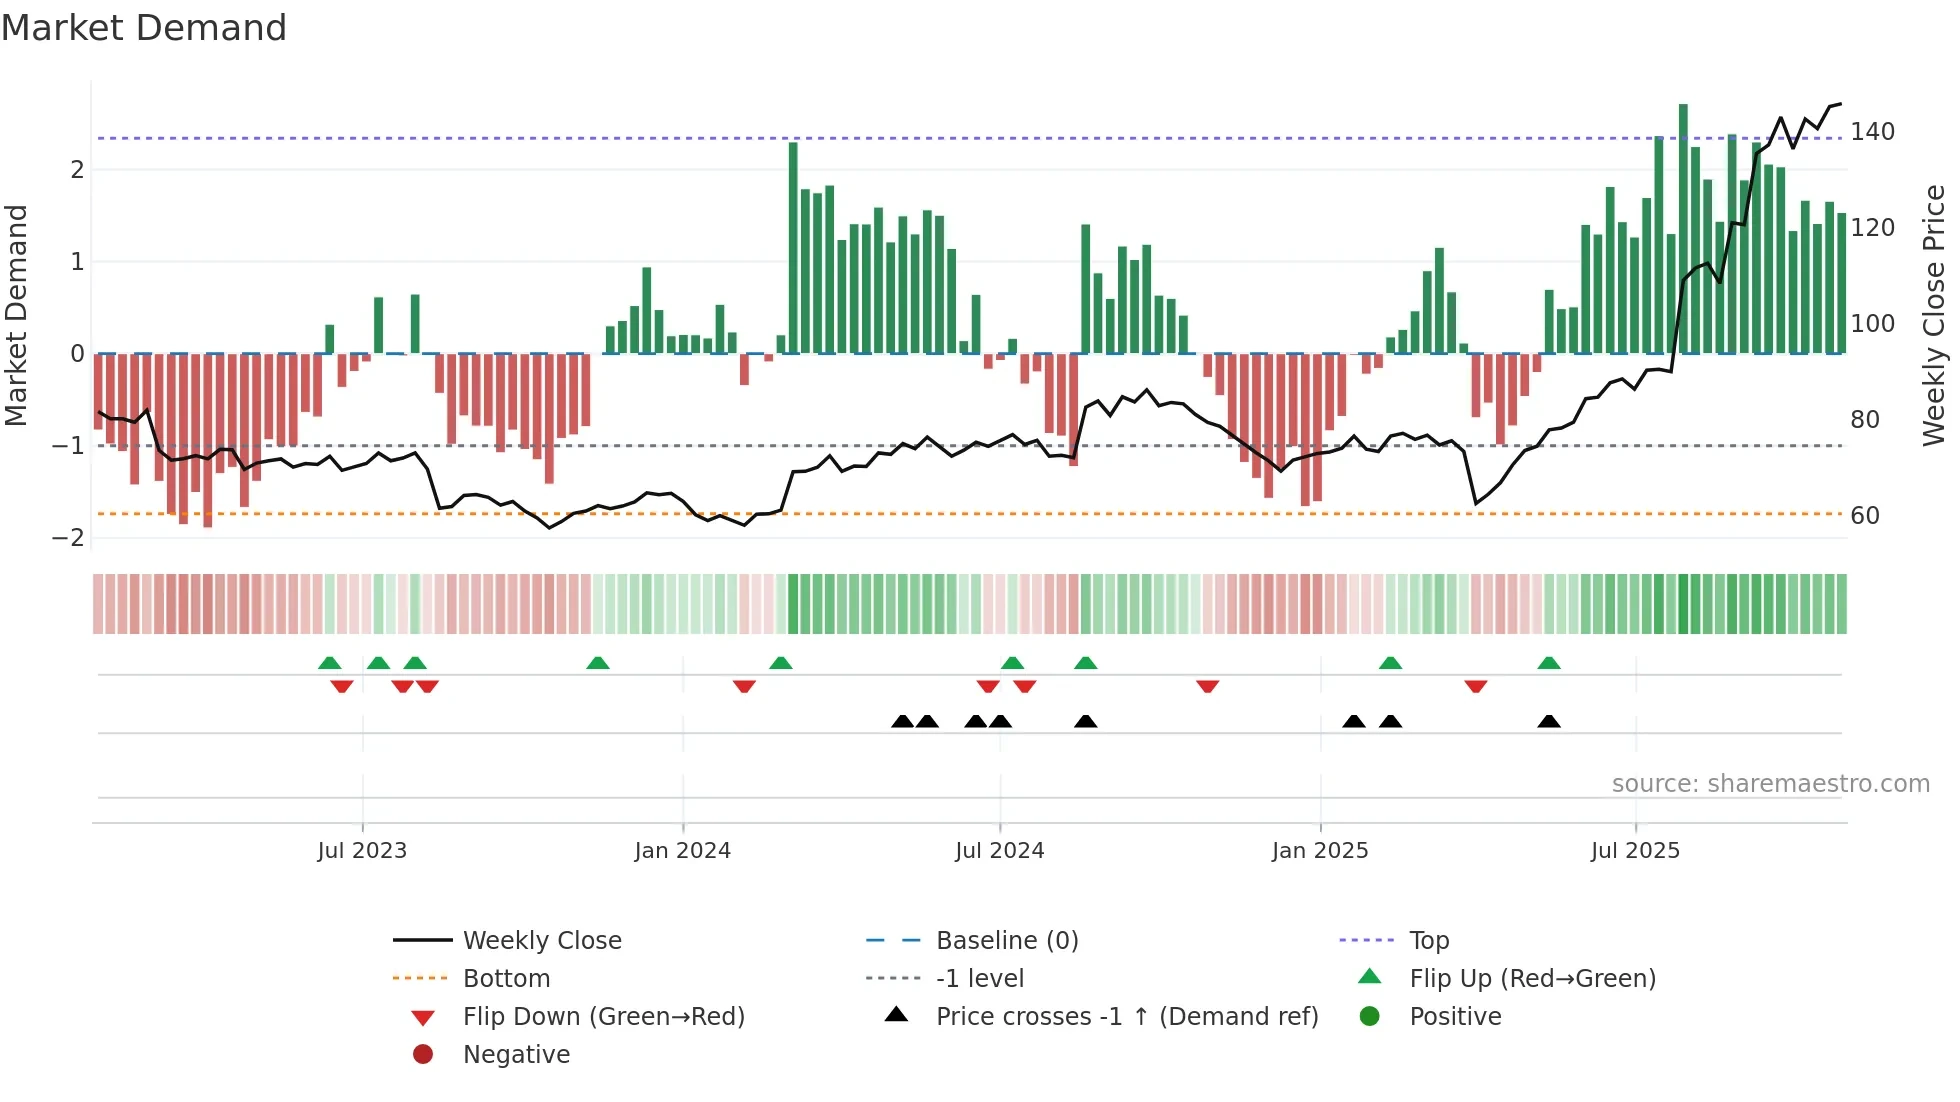
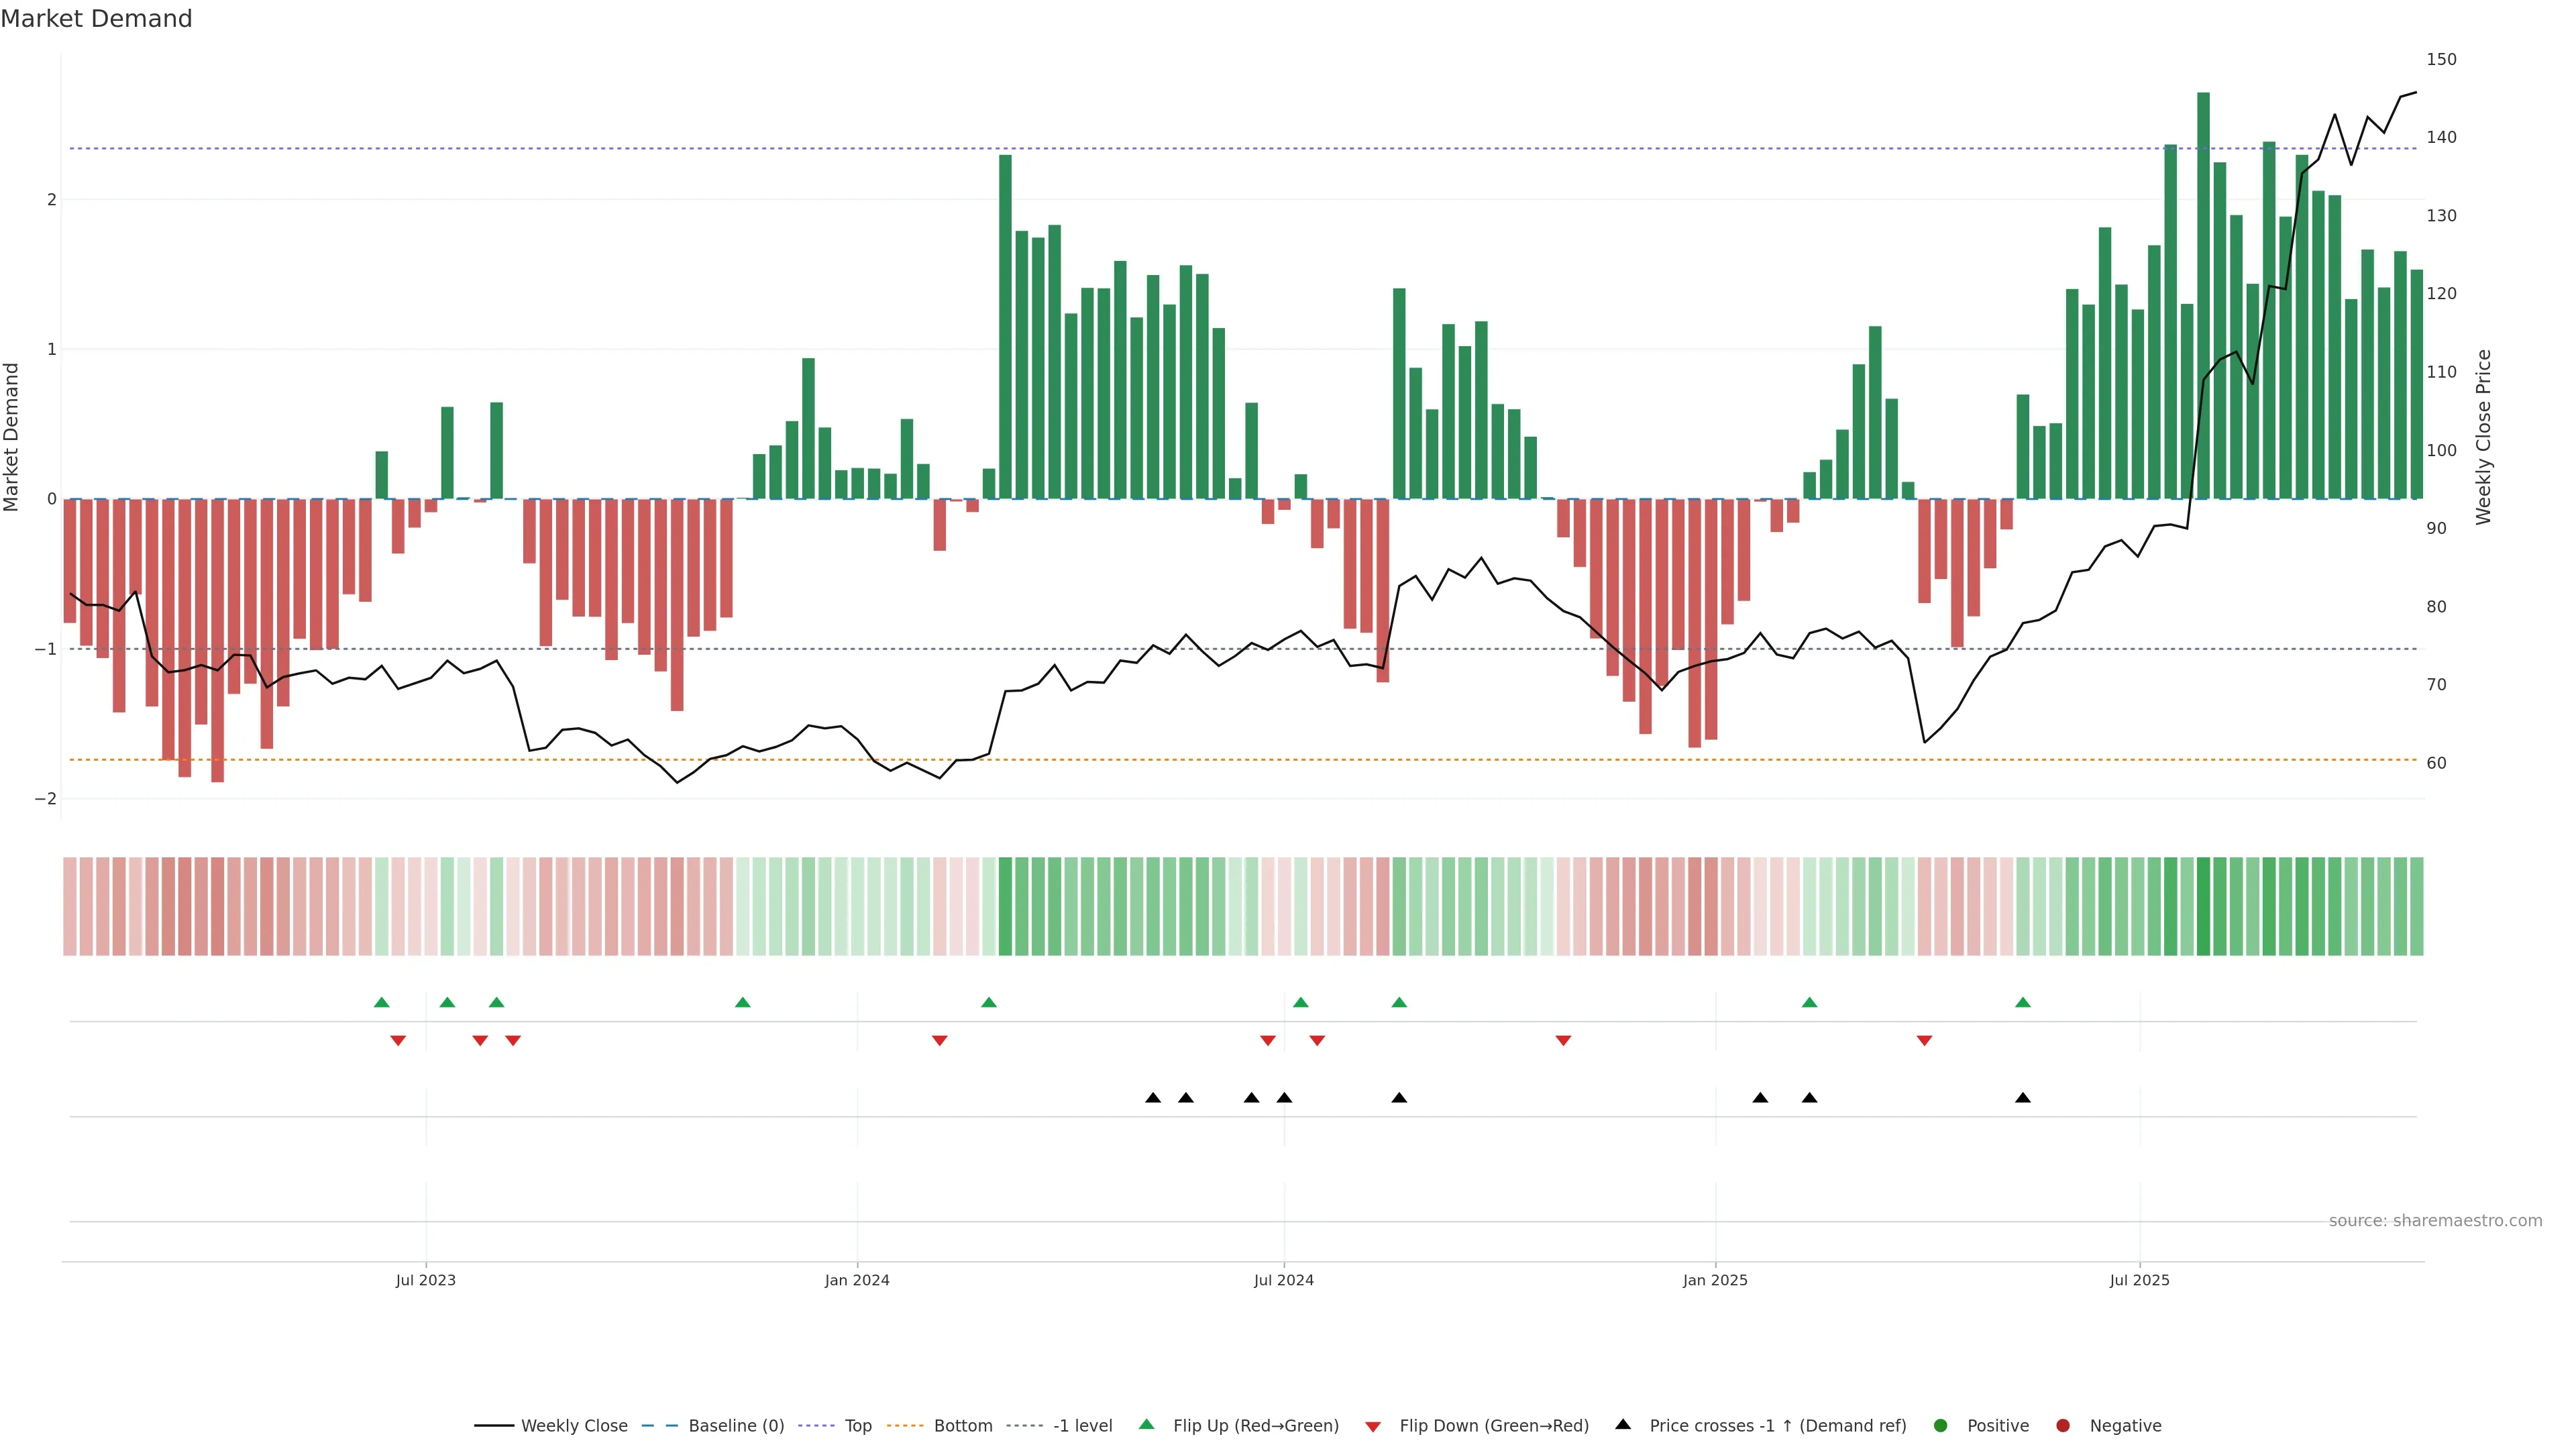
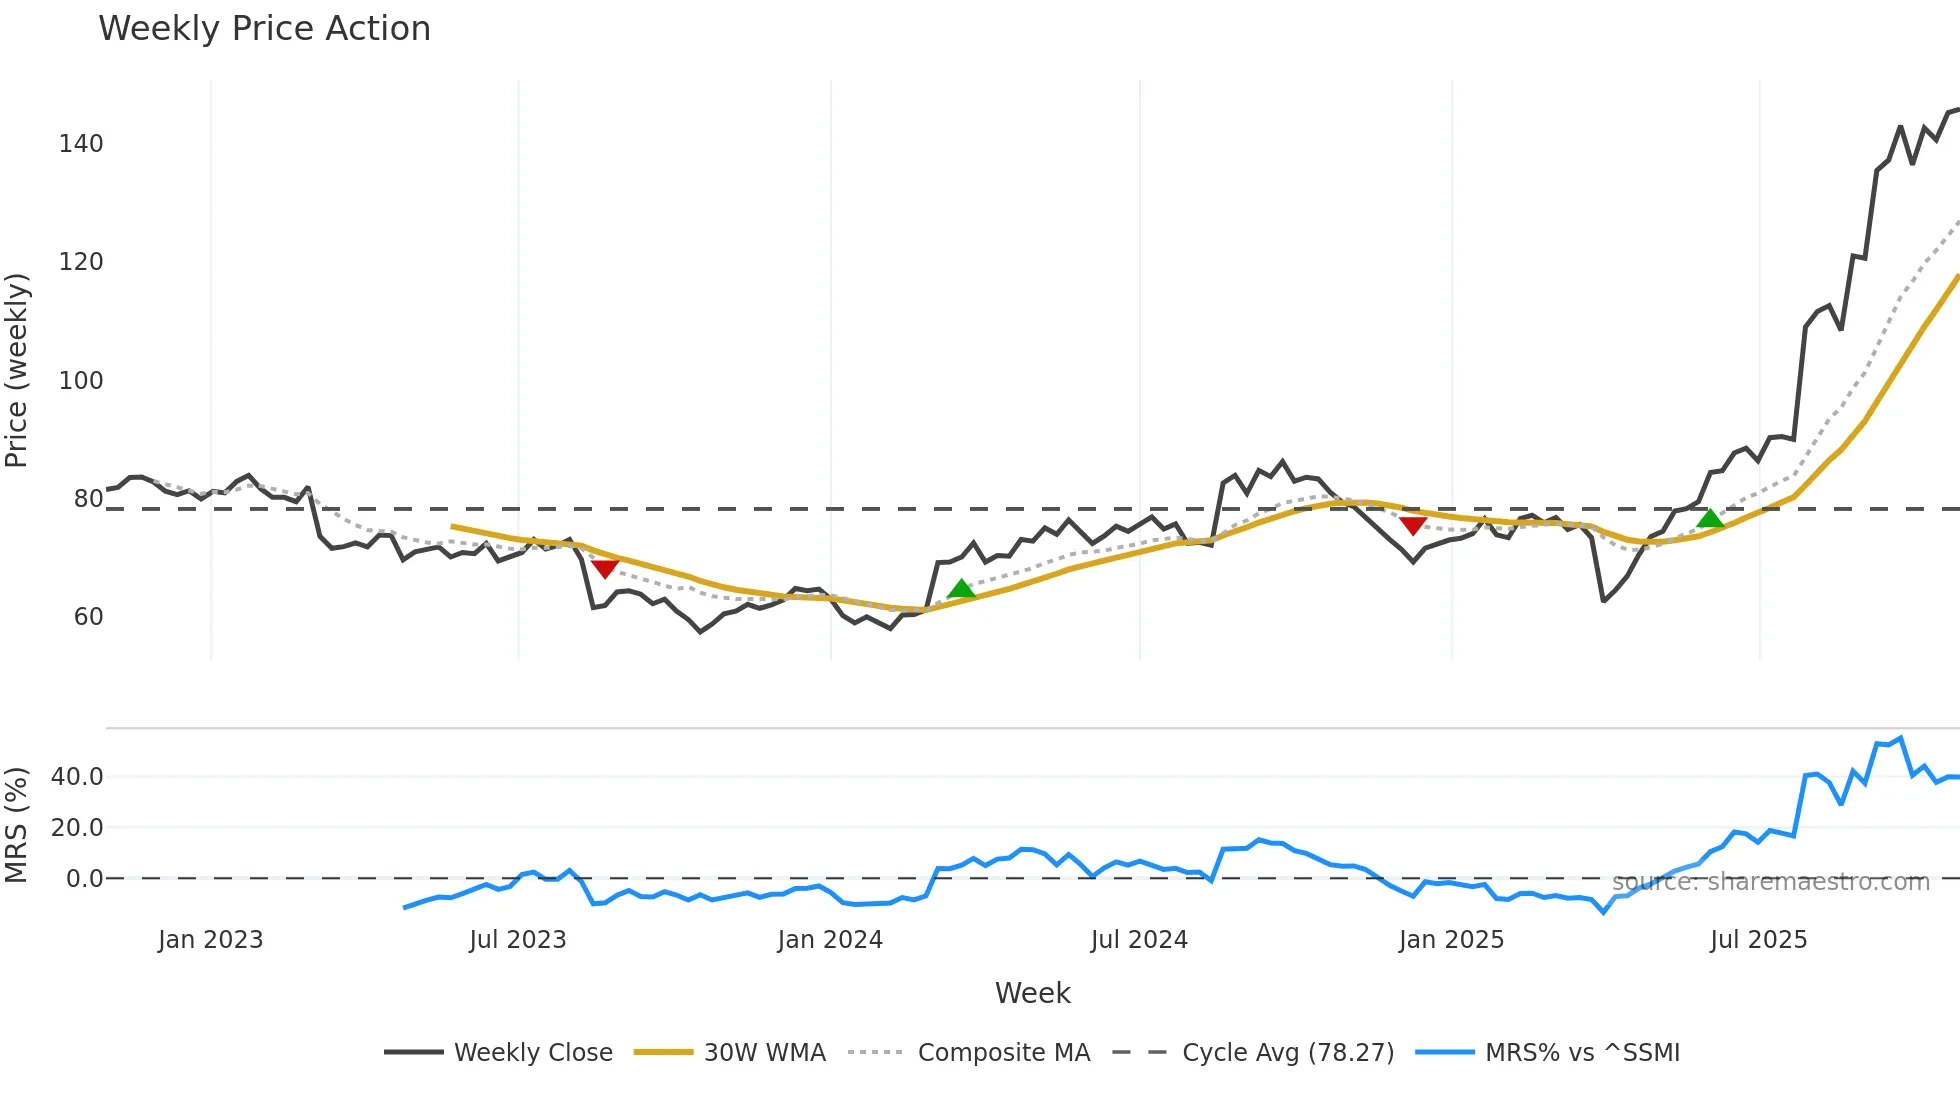
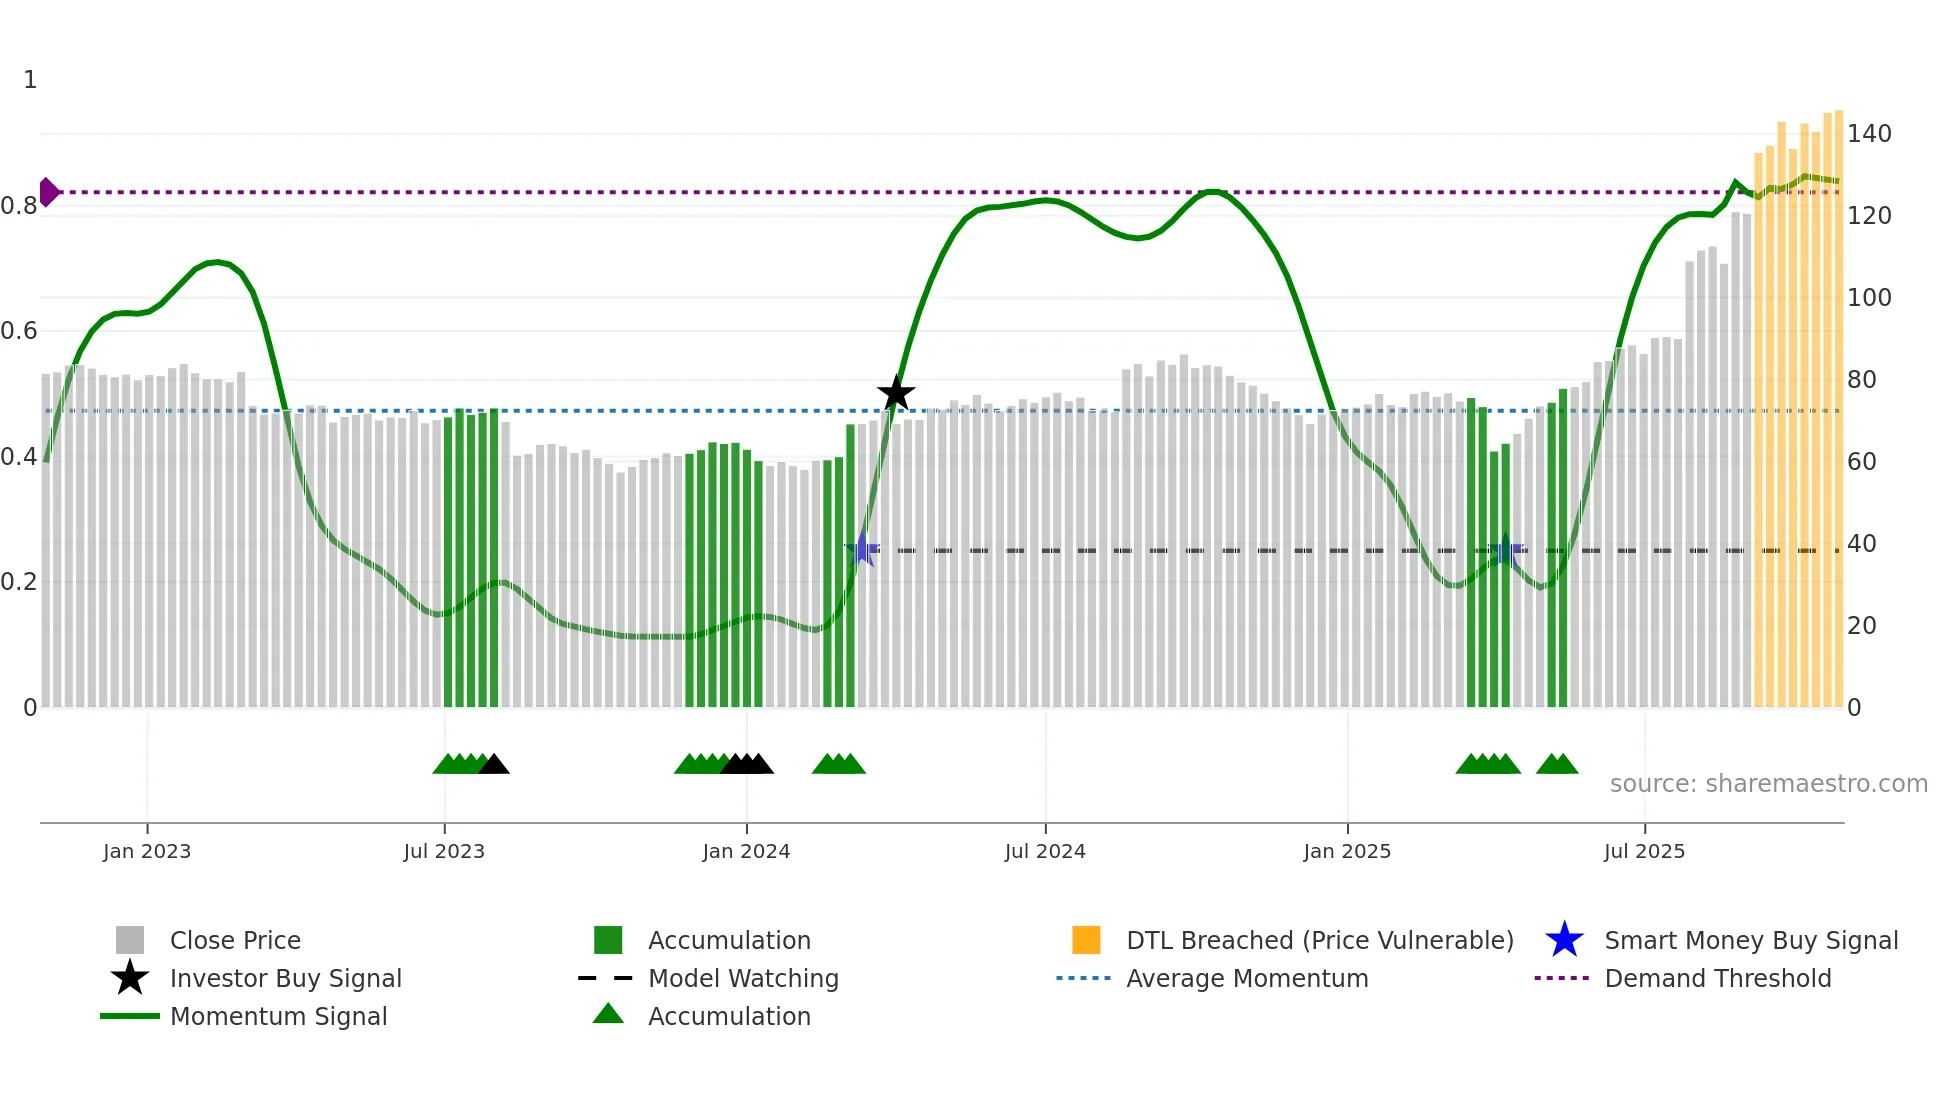
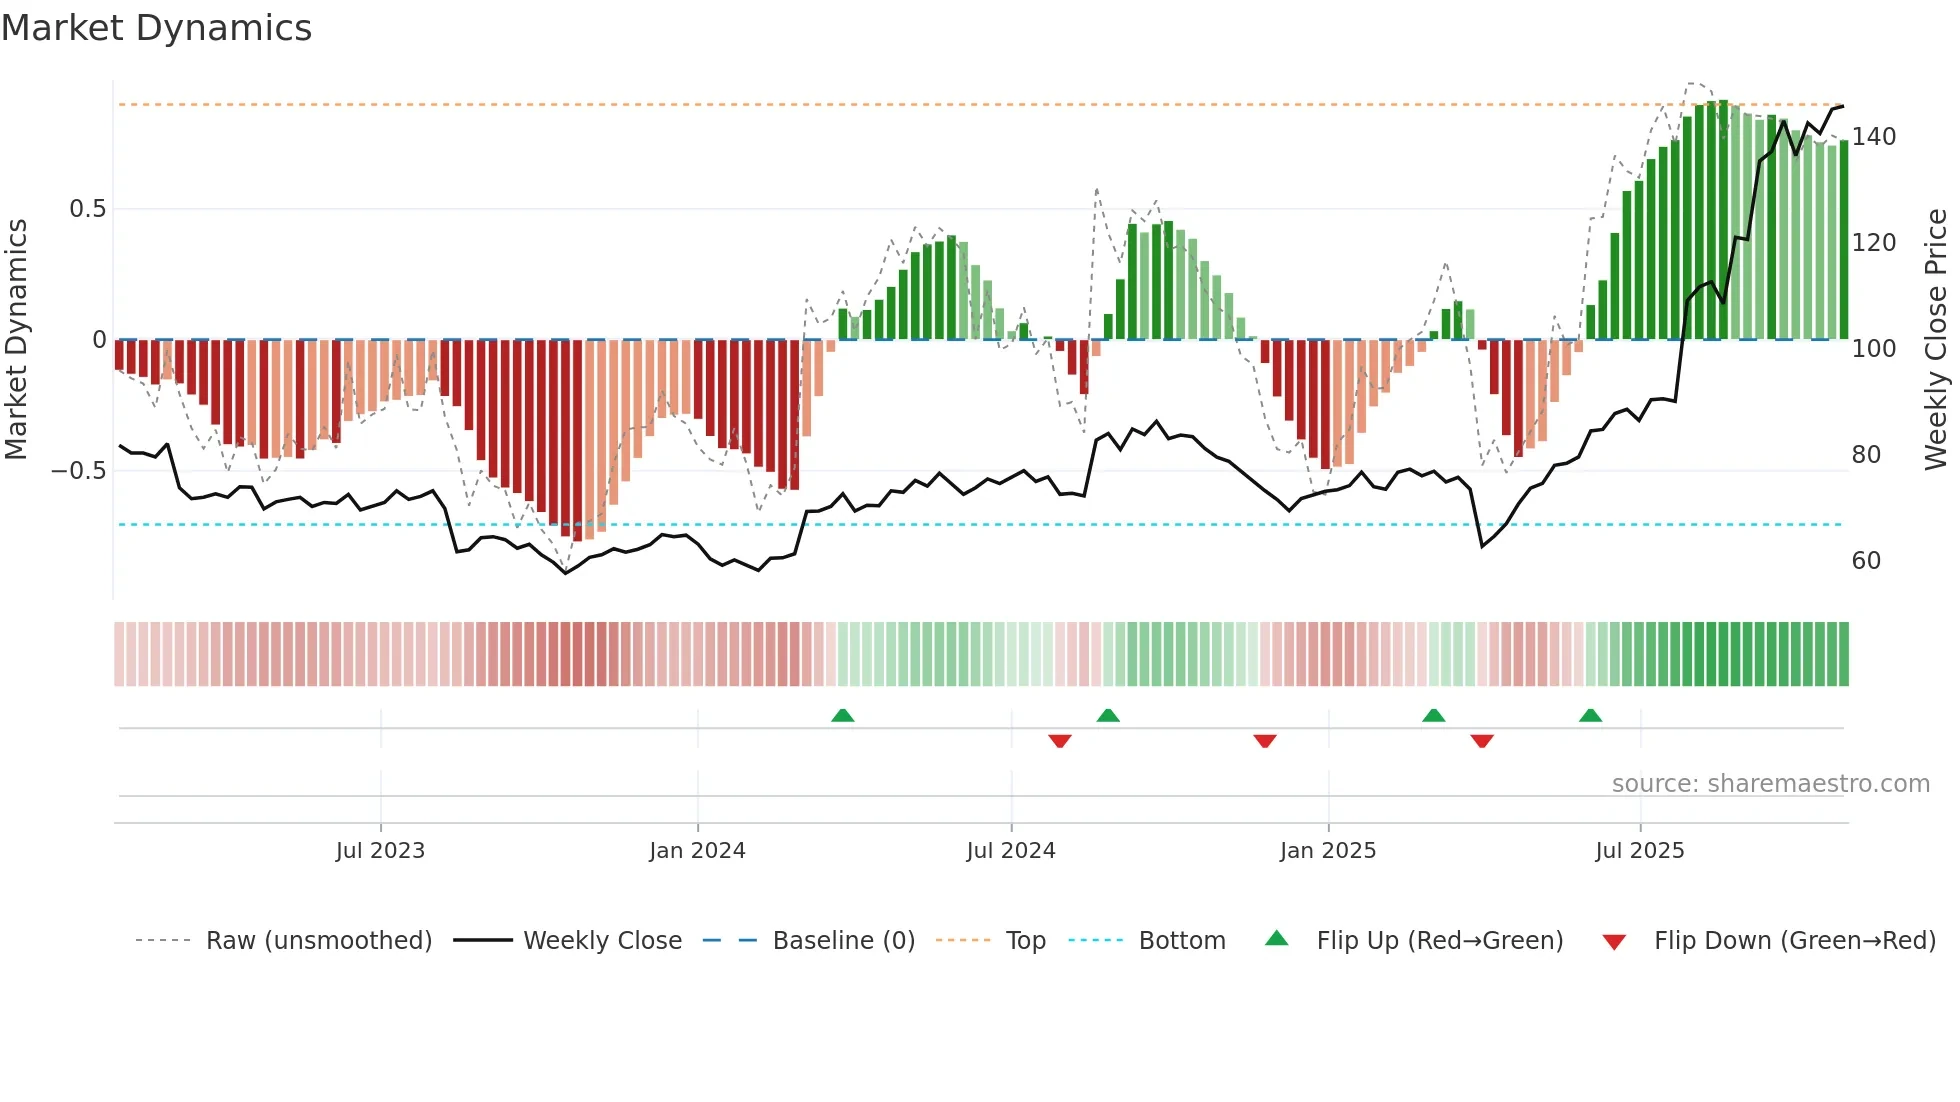
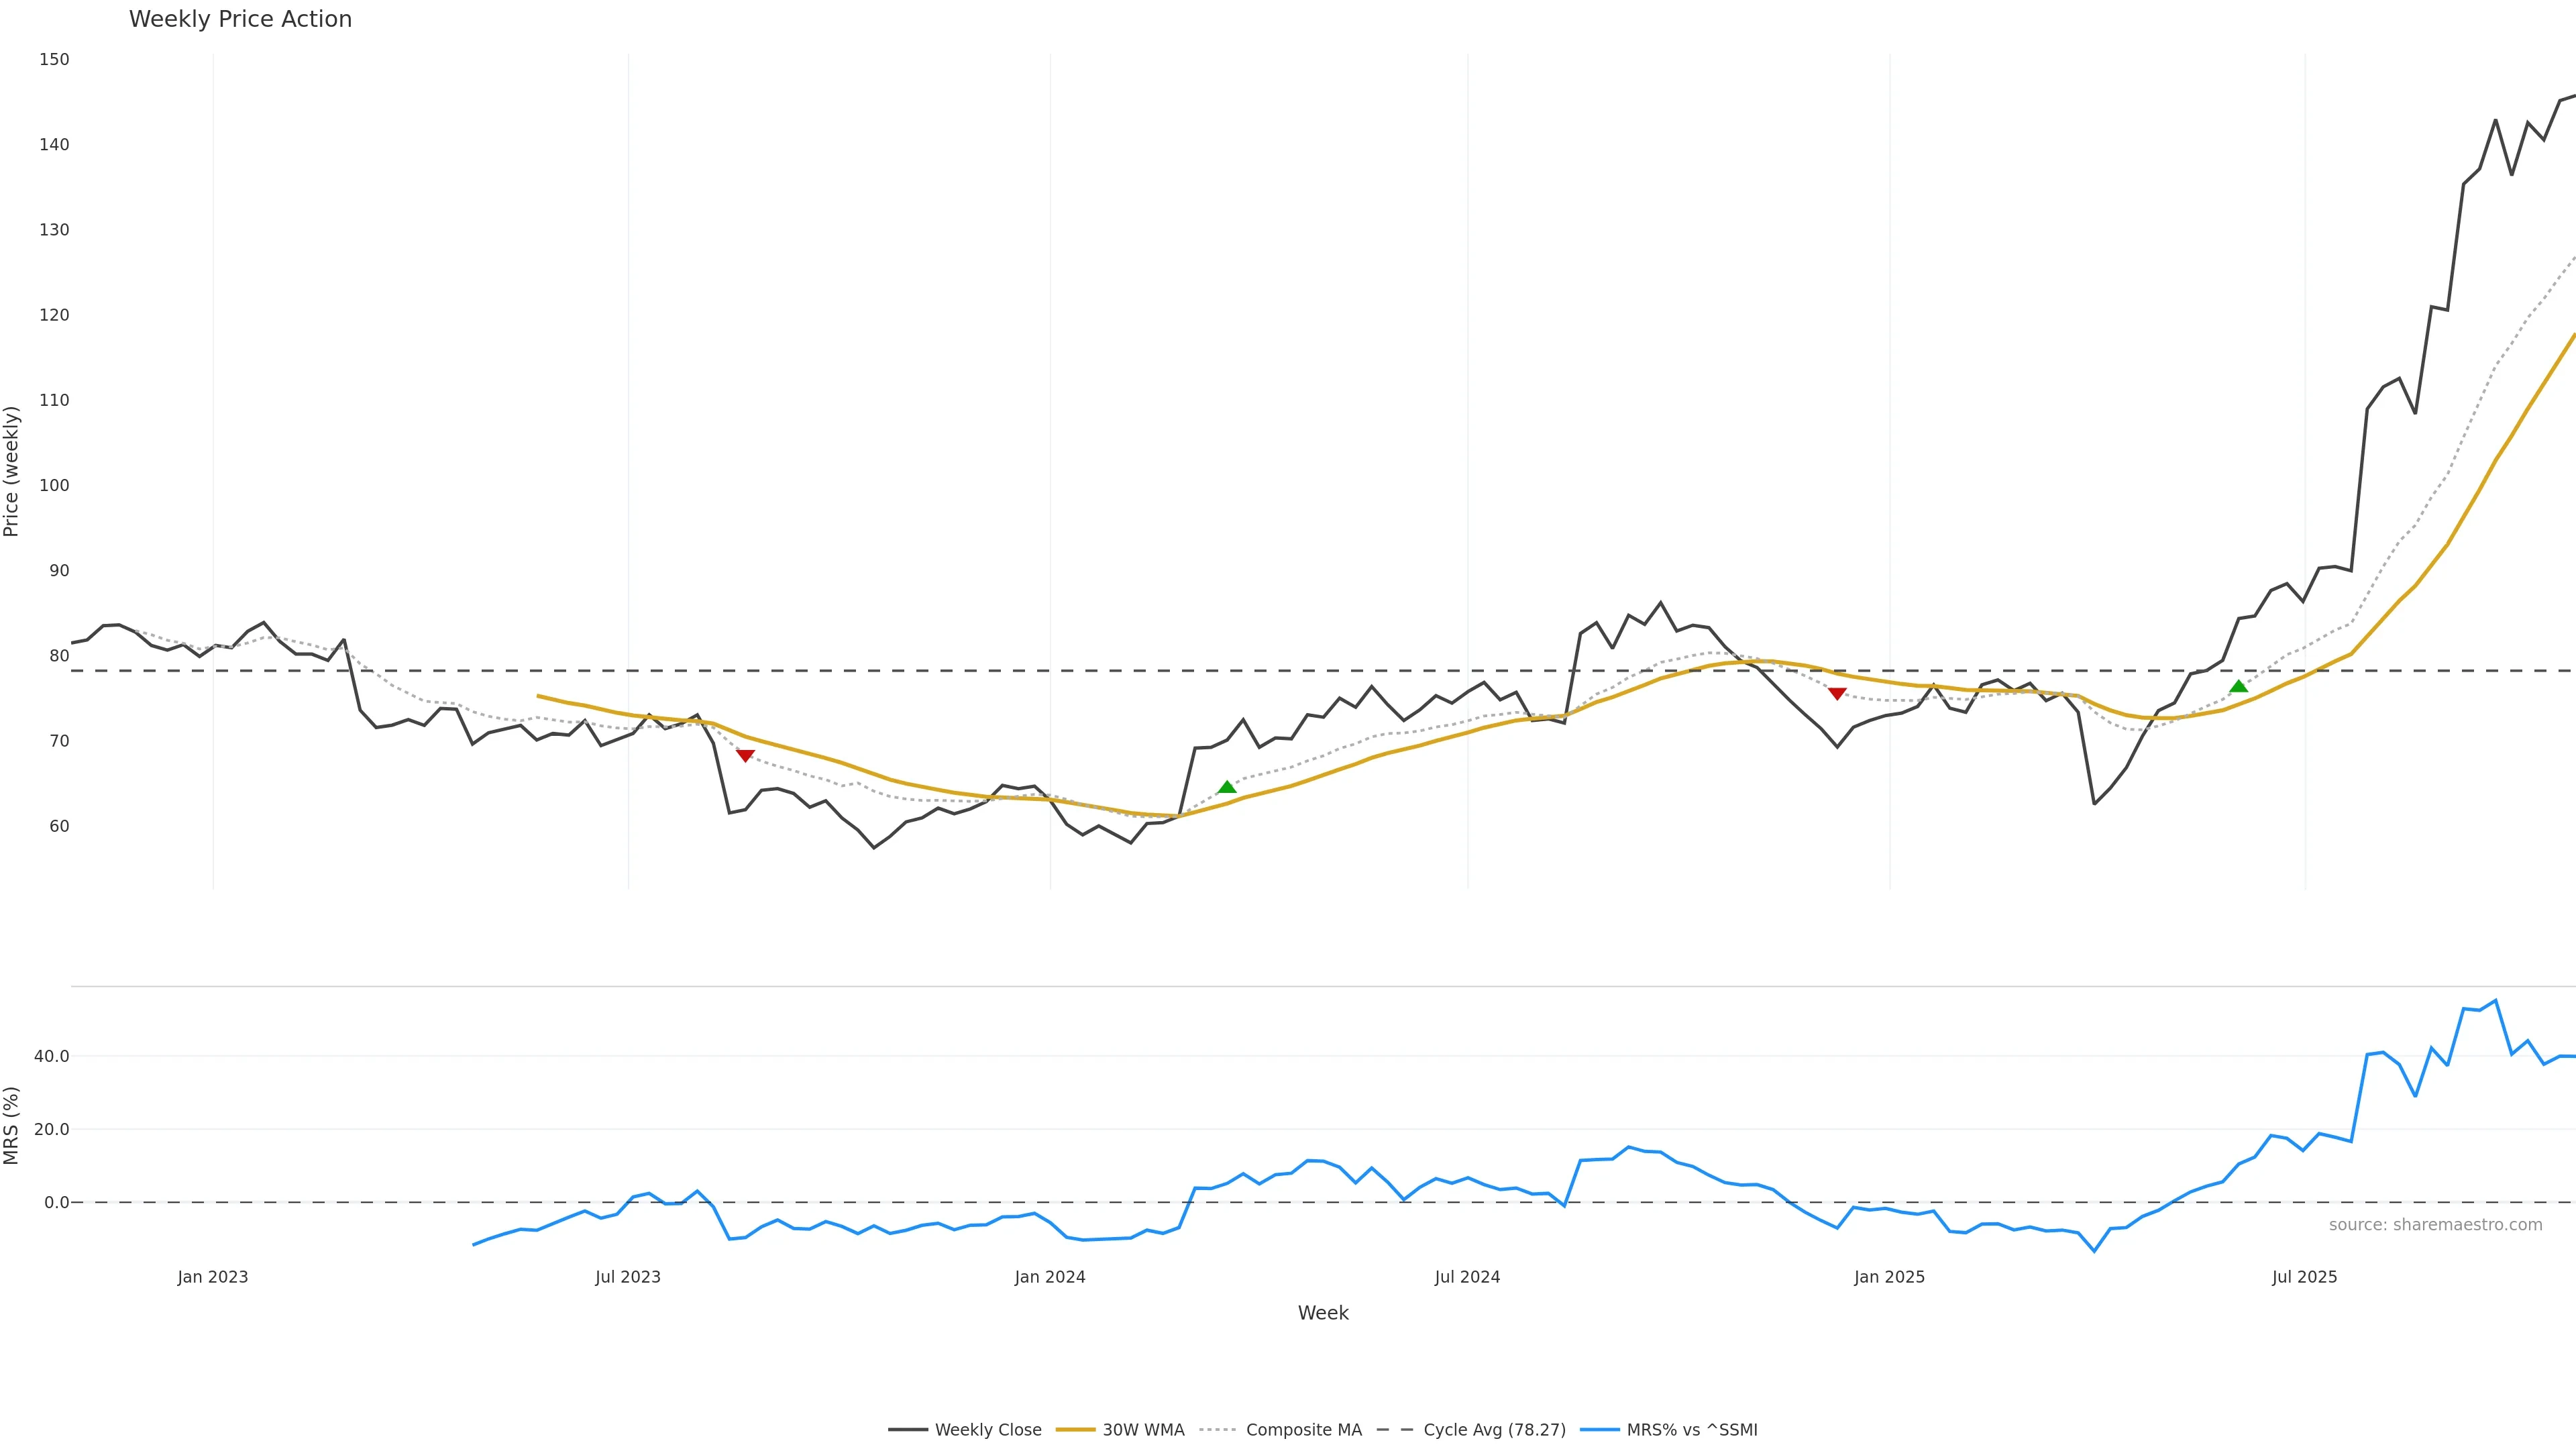
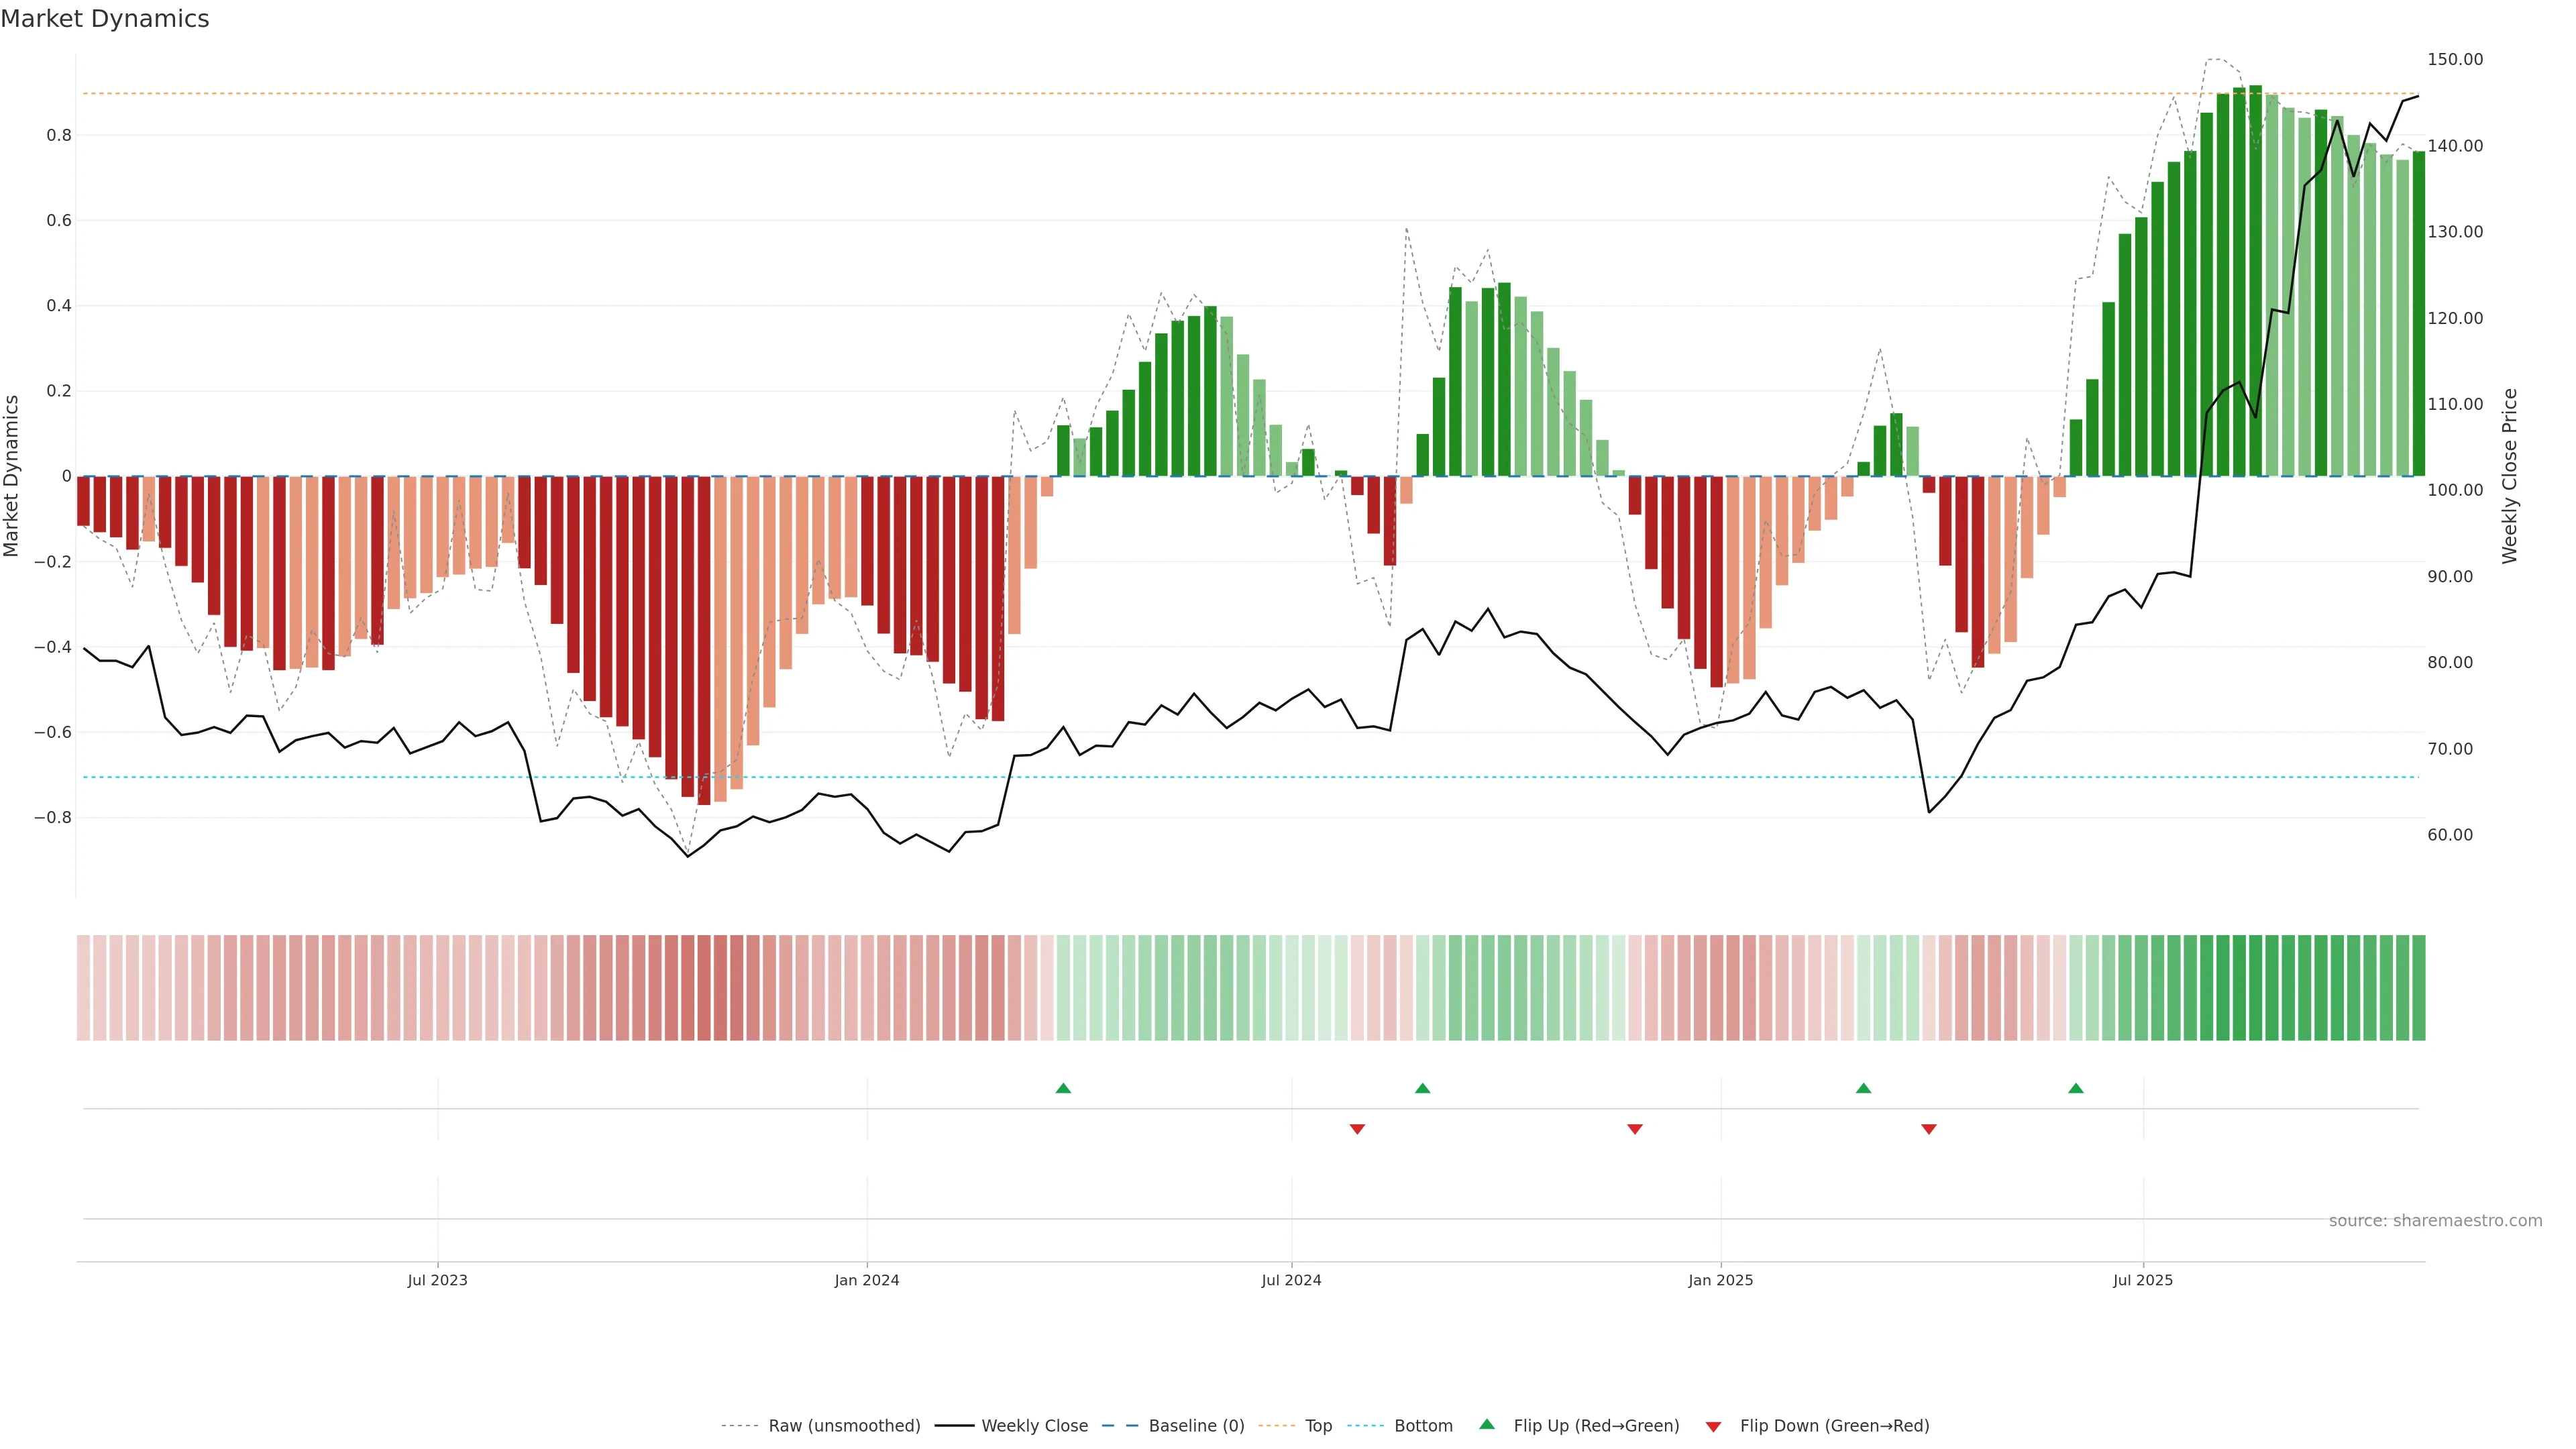
Menu
No results found.
“Patience reduces risk more reliably than prediction.”
Weekly Share Price & Valuation Overview
Huber+Suhner AG
Huber+Suhner AG engages in the provision of electrical and optical connectivity components and system solutions. It operates in three segments: Industry, Communication, and Transportation. The company offers antennas and antenna accessories; optical fiber connectors, coaxial connectors, optical fiber adapters, and coaxial adapters; optical fiber, coaxial, signal and control, power, databus, jumper, rolling stock instrumentation, system, and hybrid cables; coaxial and optical fiber cable assemblies, hybrid and power assemblies and systems, and connection systems EV; and fiber cable management products, such as chassis, modules, fiber management accessories, optical distribution frames, and enclosures. It also offers components, including terminations, attenuators, filters, splitters and couplers, tappers, coaxial DC blocks, and surge protective devices; tools and accessories; pluggable transceivers and transceiver cables; and other systems, such as optical switches, RF-over-fiber solutions, ethernet switches, optical multiplexers, and CPE. In addition, the company provides e-business and supply management services, as well as RF Tools, an application that operates as a cable assembly calculator. It serves aerospace, defense, energy, EV charging infrastructure, medical device, test and measurement, and other industry markets. Huber+Suhner AG was founded in 1864 and is headquartered in Herisau, Switzerland.
- Quick ratio ≥1.0 indicates obligations can be met without inventory.
- Net cash balance sheet provides flexibility for downturns and investment.
- Market Cap Total equity value of the company (share price × shares outstanding).
- CHF 2.40B
- Enterprise Value Operating value: market cap + total debt − cash.
- CHF 2.22B
- Total Revenue (TTM) Sales over the last twelve months. May be estimated from revenue per share when inconsistent.
- CHF 909.21M
- Gross Profit (TTM) Revenue minus cost of goods sold over the last twelve months. Hidden for financial institutions or if redundant.
- CHF 316.15M
- EBITDA (TTM) Earnings before interest, taxes, depreciation and amortization (TTM). Hidden for financials or if implausible.
- CHF 122.60M
- Revenue per Share (TTM) Total revenue divided by shares outstanding (may be estimated).
- CHF 49.29
- EPS (TTM) Earnings per share over the last twelve months (may be estimated from net income ÷ shares).
- 3.97
- Dividend Yield Annual dividend ÷ share price. Reconciled using dividend per share when available.
- 1.46%
- Shares Outstanding
- 18.45M
- Float Shares
- 16.92M
- Implied Shares Outstanding
- 18.47M
- Operating Margin (TTM) Operating income ÷ revenue over the last twelve months (reconciled when possible).
-
10.09%
- EBITDA Margin (TTM) Reconciled EBITDA ÷ revenue over the last twelve months (suppressed if EBITDA implausible/financials).
-
13.48%
- Gross Margin (TTM) Reconciled Gross profit ÷ revenue over the last twelve months (reconciled when possible).
-
34.77%
- Profit Margin (TTM) Net income ÷ revenue over the last twelve months (reconciled when possible).
-
8.05%
- ROA Return on assets: net income ÷ total assets.
-
6.78%
- ROE Return on equity: net income ÷ shareholder equity.
-
11.75%
- Revenue Growth Year-over-year revenue growth.
-
3.60%
- Earnings Growth (YoY) Year-over-year earnings growth.
-
5.30%
- Earnings Growth (QoQ) Quarter-over-quarter earnings growth.
-
40.30%
- Quick Ratio Adequate Liquid current assets ÷ current liabilities (ex-inventory).
- 2.26
- Total Cash Cash and equivalents.
- CHF 178.11M
- Net Debt Net Cash Total debt − cash (negative = net cash).
- CHF -178.11M
- Operating Cash Flow (TTM) Cash generated by core operations (pre-capex).
- CHF 115.76M
- Free Cash Flow (TTM) Cash after capex; funds buybacks, dividends, and debt paydown.
- CHF 67.18M
- OCF Margin (TTM) Operating cash flow ÷ revenue (TTM).
-
12.73%
- FCF Margin (TTM) Free cash flow ÷ revenue (TTM).
-
7.39%
- Cash Conversion (OpCF/EBITDA)
- 0.94
- Margins shown on a TTM basis. “Reconciled” = numerator ÷ TTM revenue for internal consistency.
- Cash Flow section is displayed only when figures are self-consistent (and hidden for financials).
Disclaimer: Information is compiled from publicly available sources and is subject to errors and omissions. It is provided as a guide only and does not constitute investment advice. Please do your own research.