Shanghai Fudan Microelectronics Group Company Limited
688385 SHA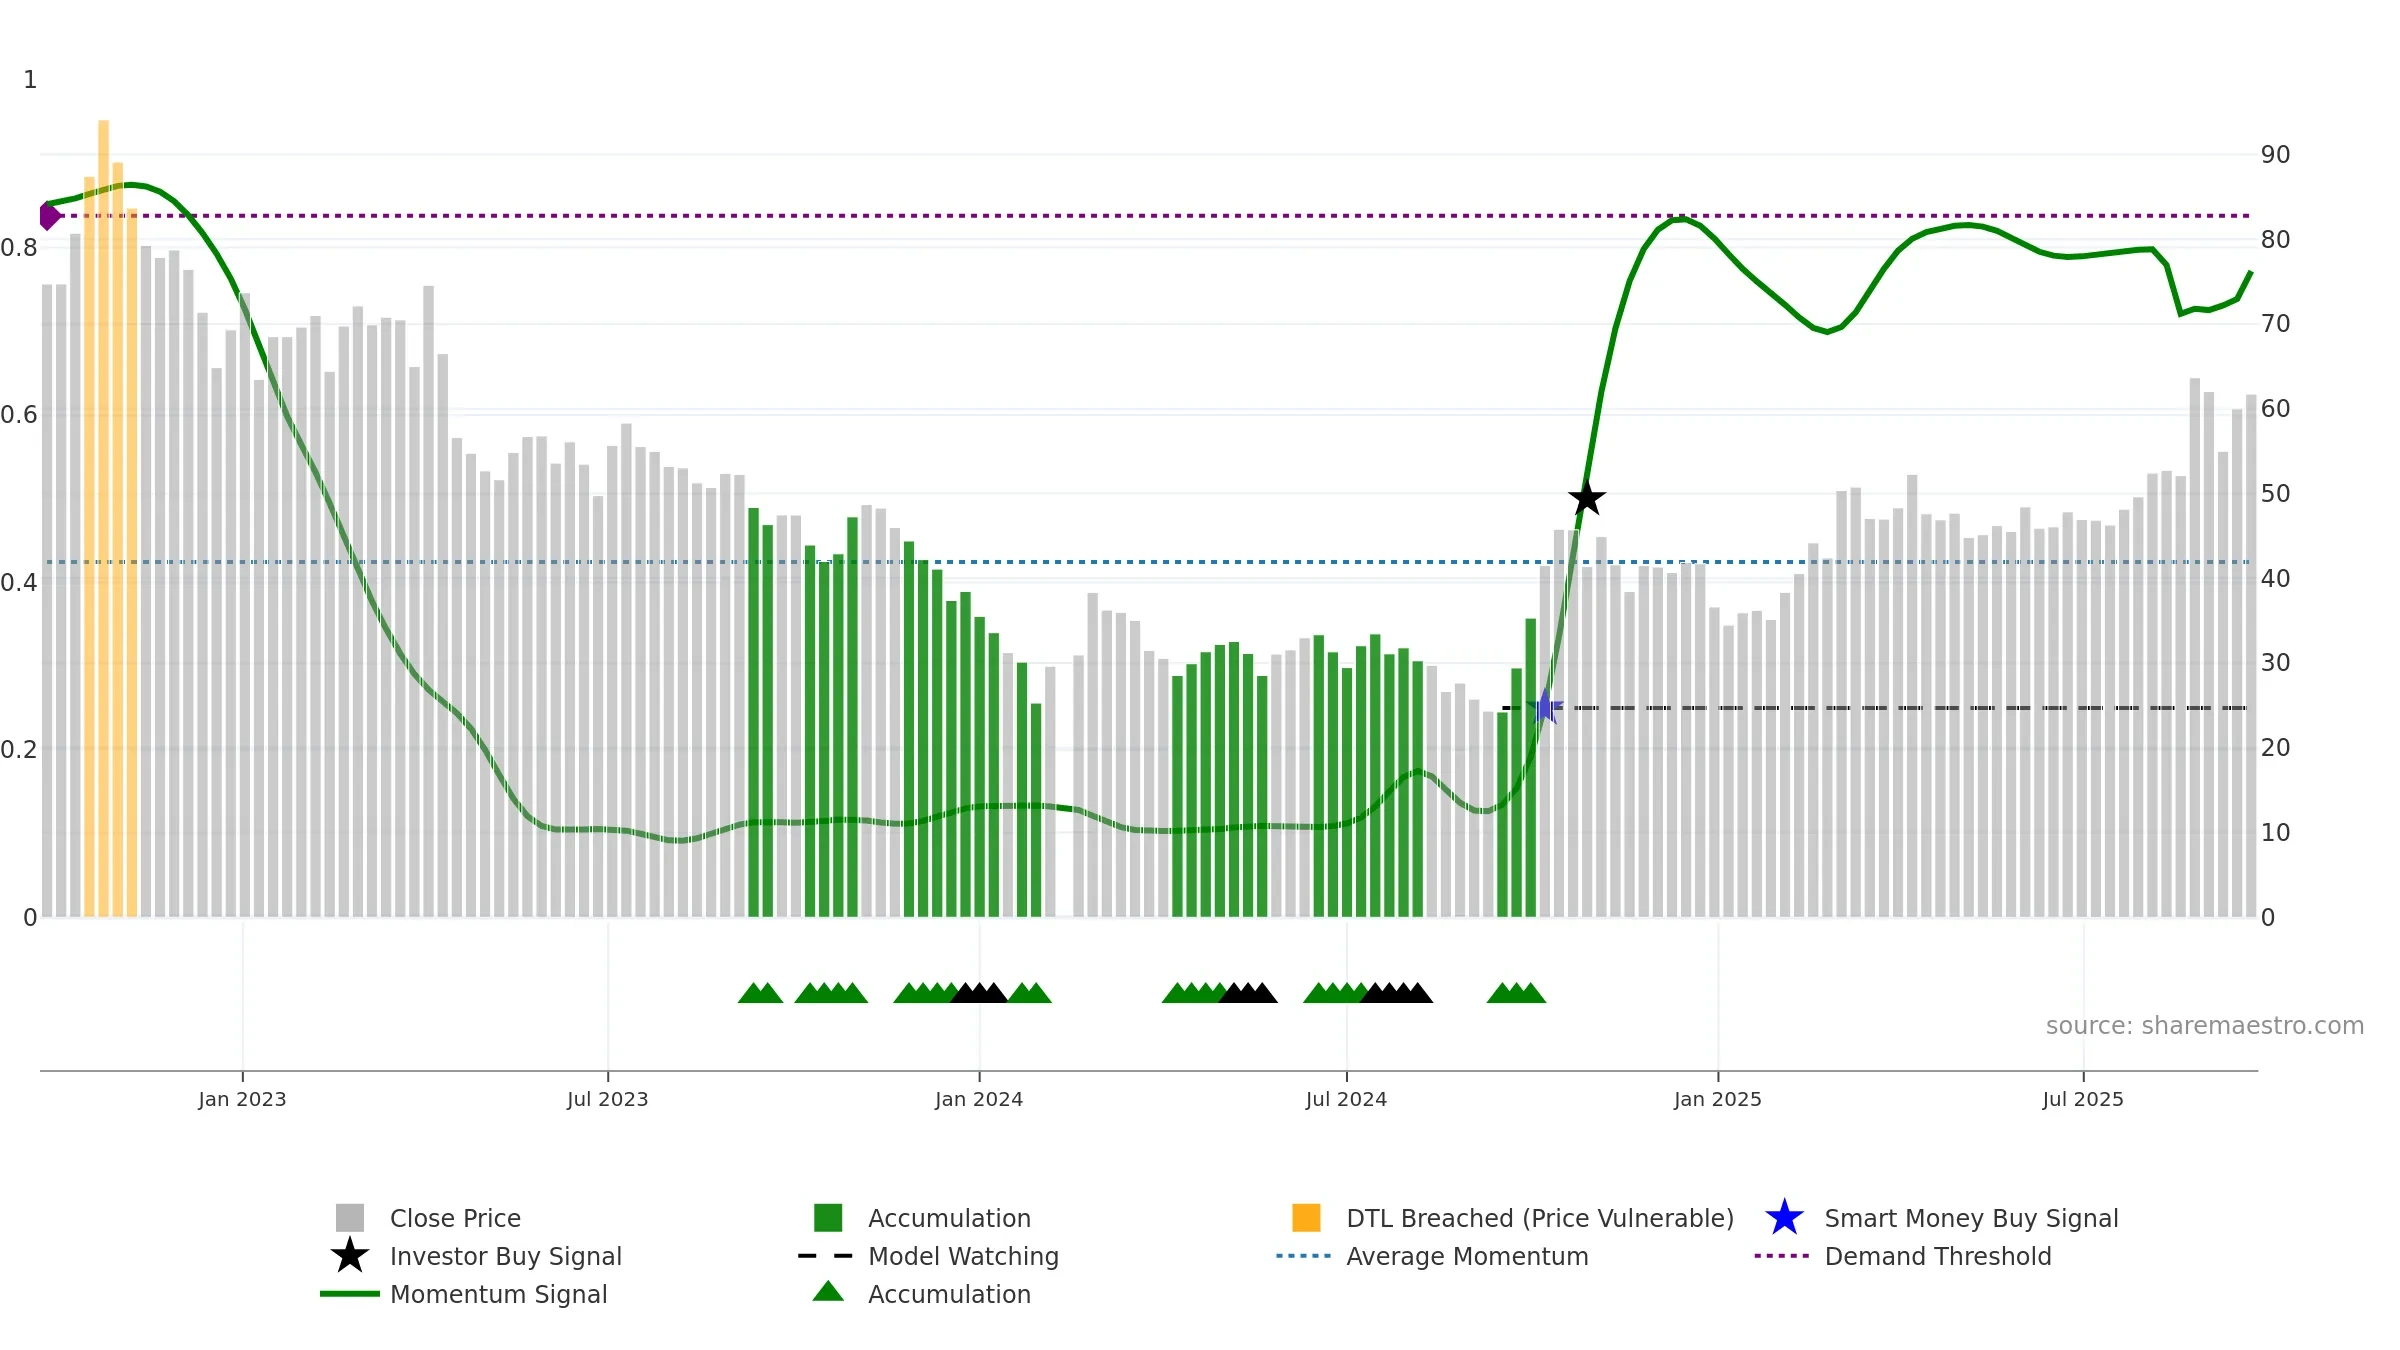
Weekly Summary
Shanghai Fudan Microelectronics Group Company Limited closed at 61.7400 (-0.08% WoW) . Data window ends Mon, 22 Sep 2025.
How to read this — Price slope is upward, indicating persistent buying over the window. Elevated weekly volatility increases whipsaw risk. Volume trend diverges from price — watch for fatigue or rotation. Returns are positively correlated with volume — strength tends to arrive on higher activity. Constructive MA stack supports the up-drift; pullbacks may find support at the 8–13 week region. Price holds above key averages, indicating constructive participation.
Up-slope supports buying interest; pullbacks may be contained if activity stays firm. Because liquidity isn’t confirming, prefer evidence of fresh demand before chasing moves.
Gauge maps the trend signal to a 0–100 scale.
How to read this — Range-bound conditions; conviction is limited until a break or acceleration emerges.
Wait for a directional break or improving acceleration.

Relative strength is Positive
(> 0%, outperforming).
Latest MRS: 10.28% (week ending Fri, 19 Sep 2025).
Slope: Rising over 8w.
Notes:
- Holding above the zero line indicates relative bid.
- MRS slope rising over ~8 weeks.
Price is below fair value; potential upside if momentum constructive.
Conclusion
Neutral setup. ★★★☆☆ confidence. Trend: Range / Neutral · 17.78% over window · vol 6.37% · liquidity divergence · posture above · RS outperforming
- Price holds above 8–26 week averages
- Constructive moving-average stack
- Solid multi-week performance
- Mansfield RS: outperforming & rising
- Momentum is weak/falling
- Liquidity diverges from price
- High return volatility raises whipsaw risk
Why: Price window 17.78% over w. Close is -3.03% below the prior-window high. Return volatility 6.37%. Volume trend falling. Liquidity divergence with price. Trend state range / neutral. MA stack constructive. Momentum bullish and falling. Valuation supportive skew.
Tip: Most metrics include a hover tooltip where they appear in the report.