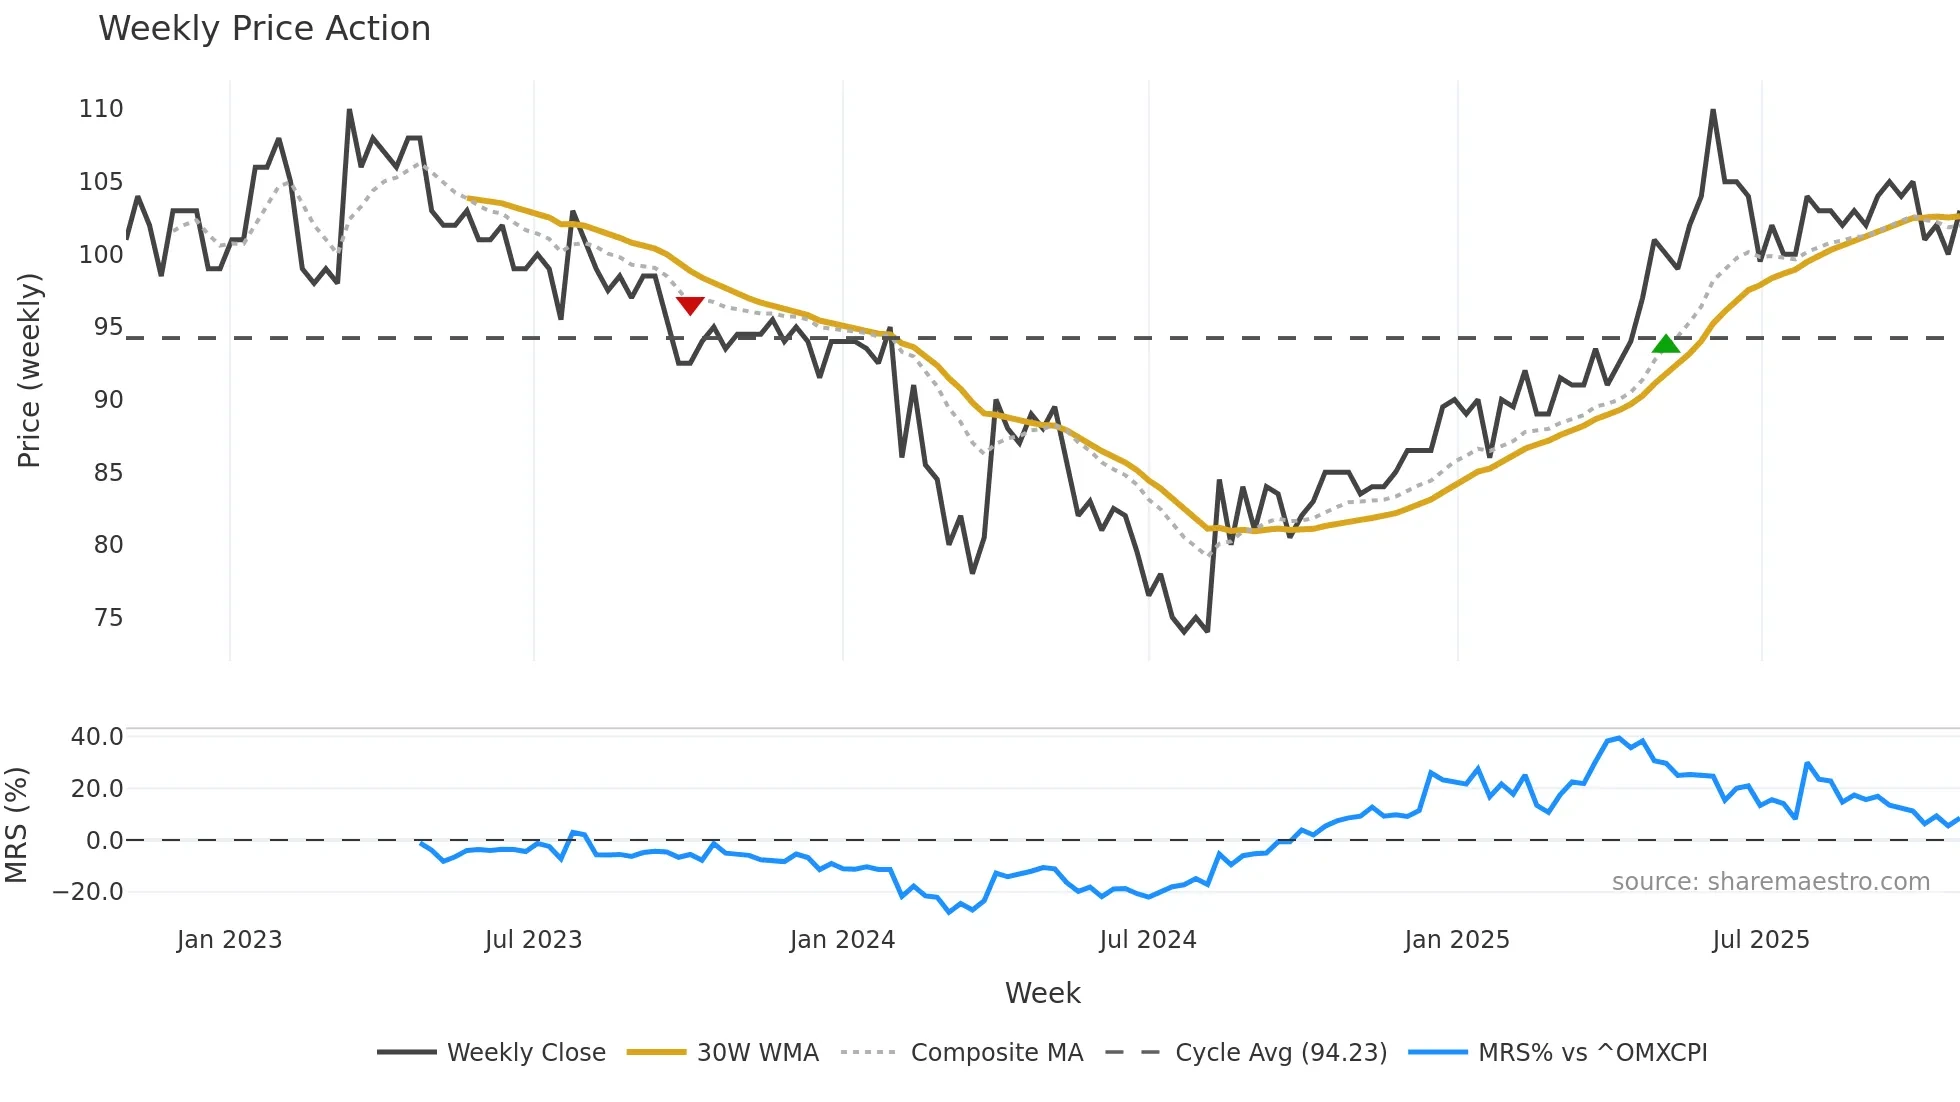
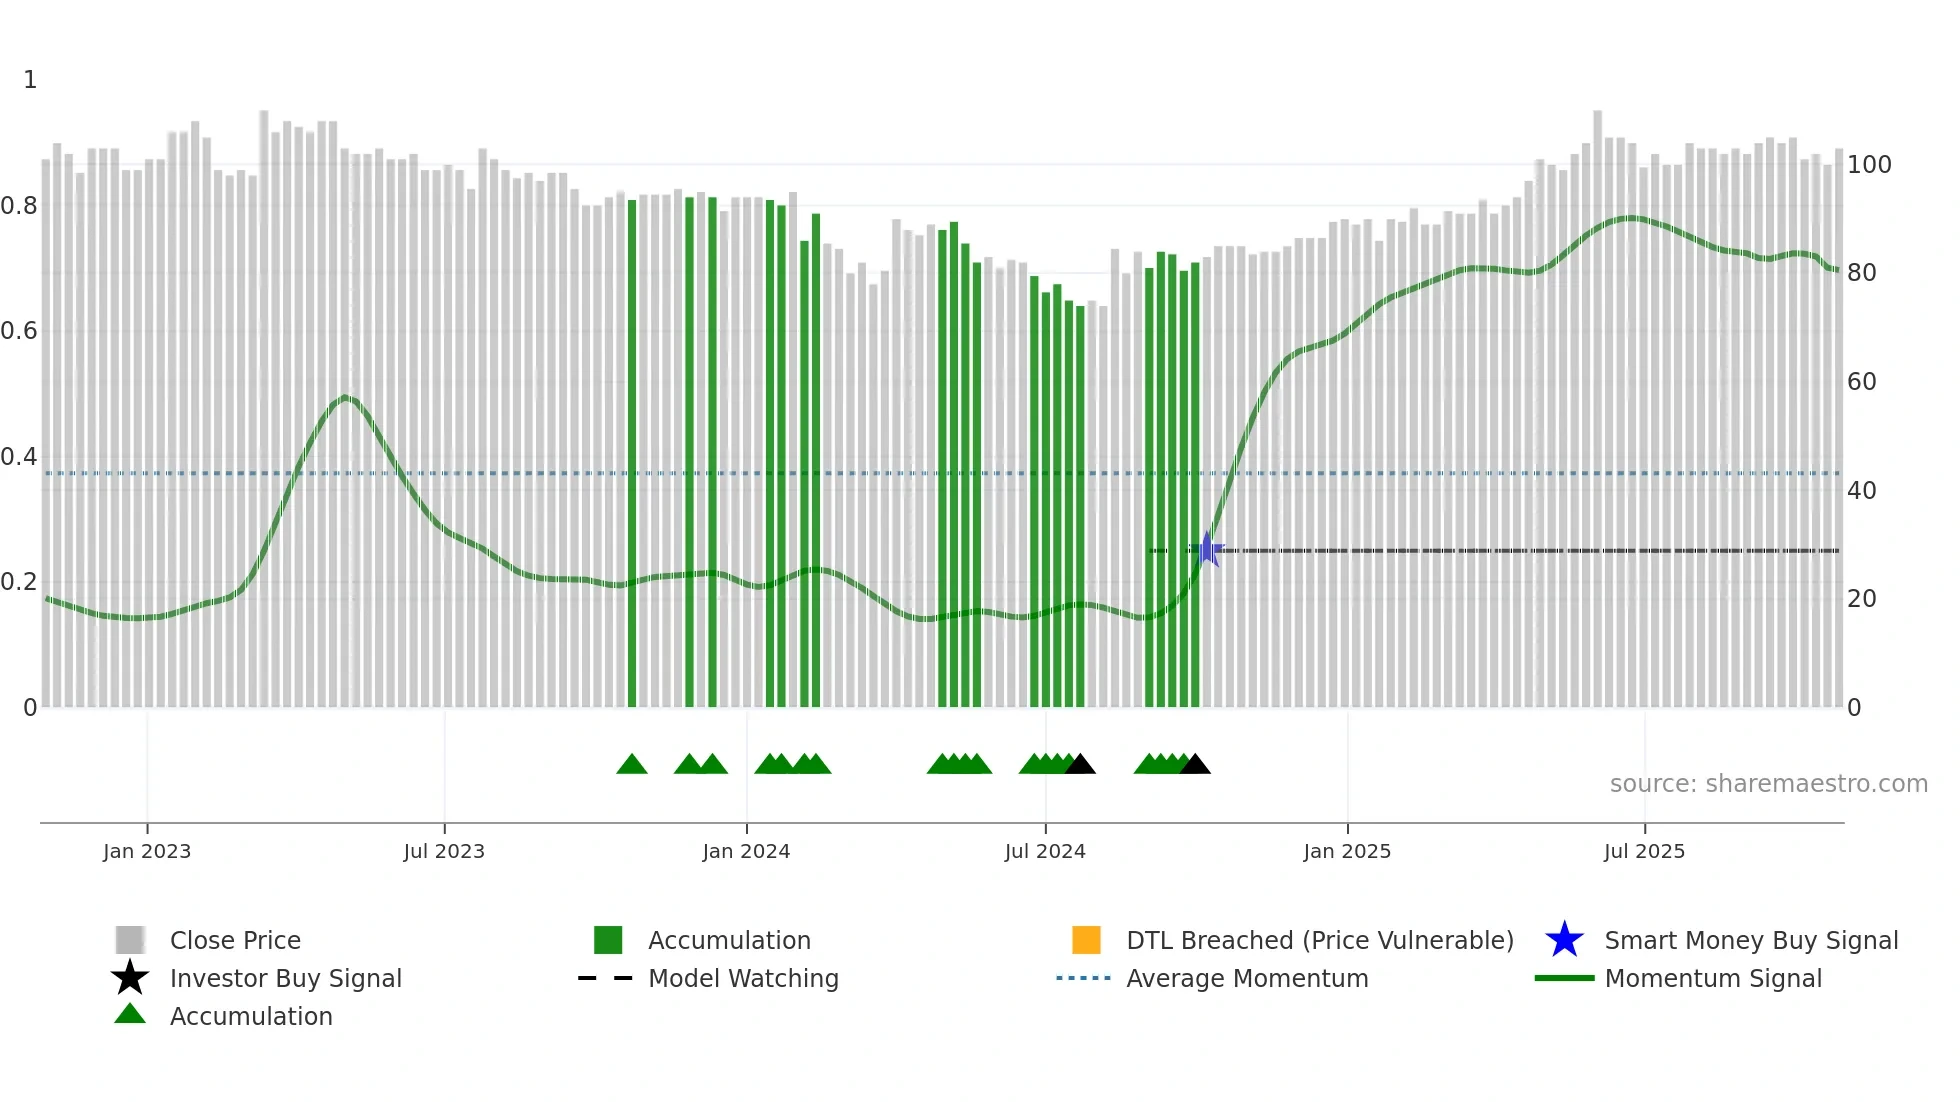
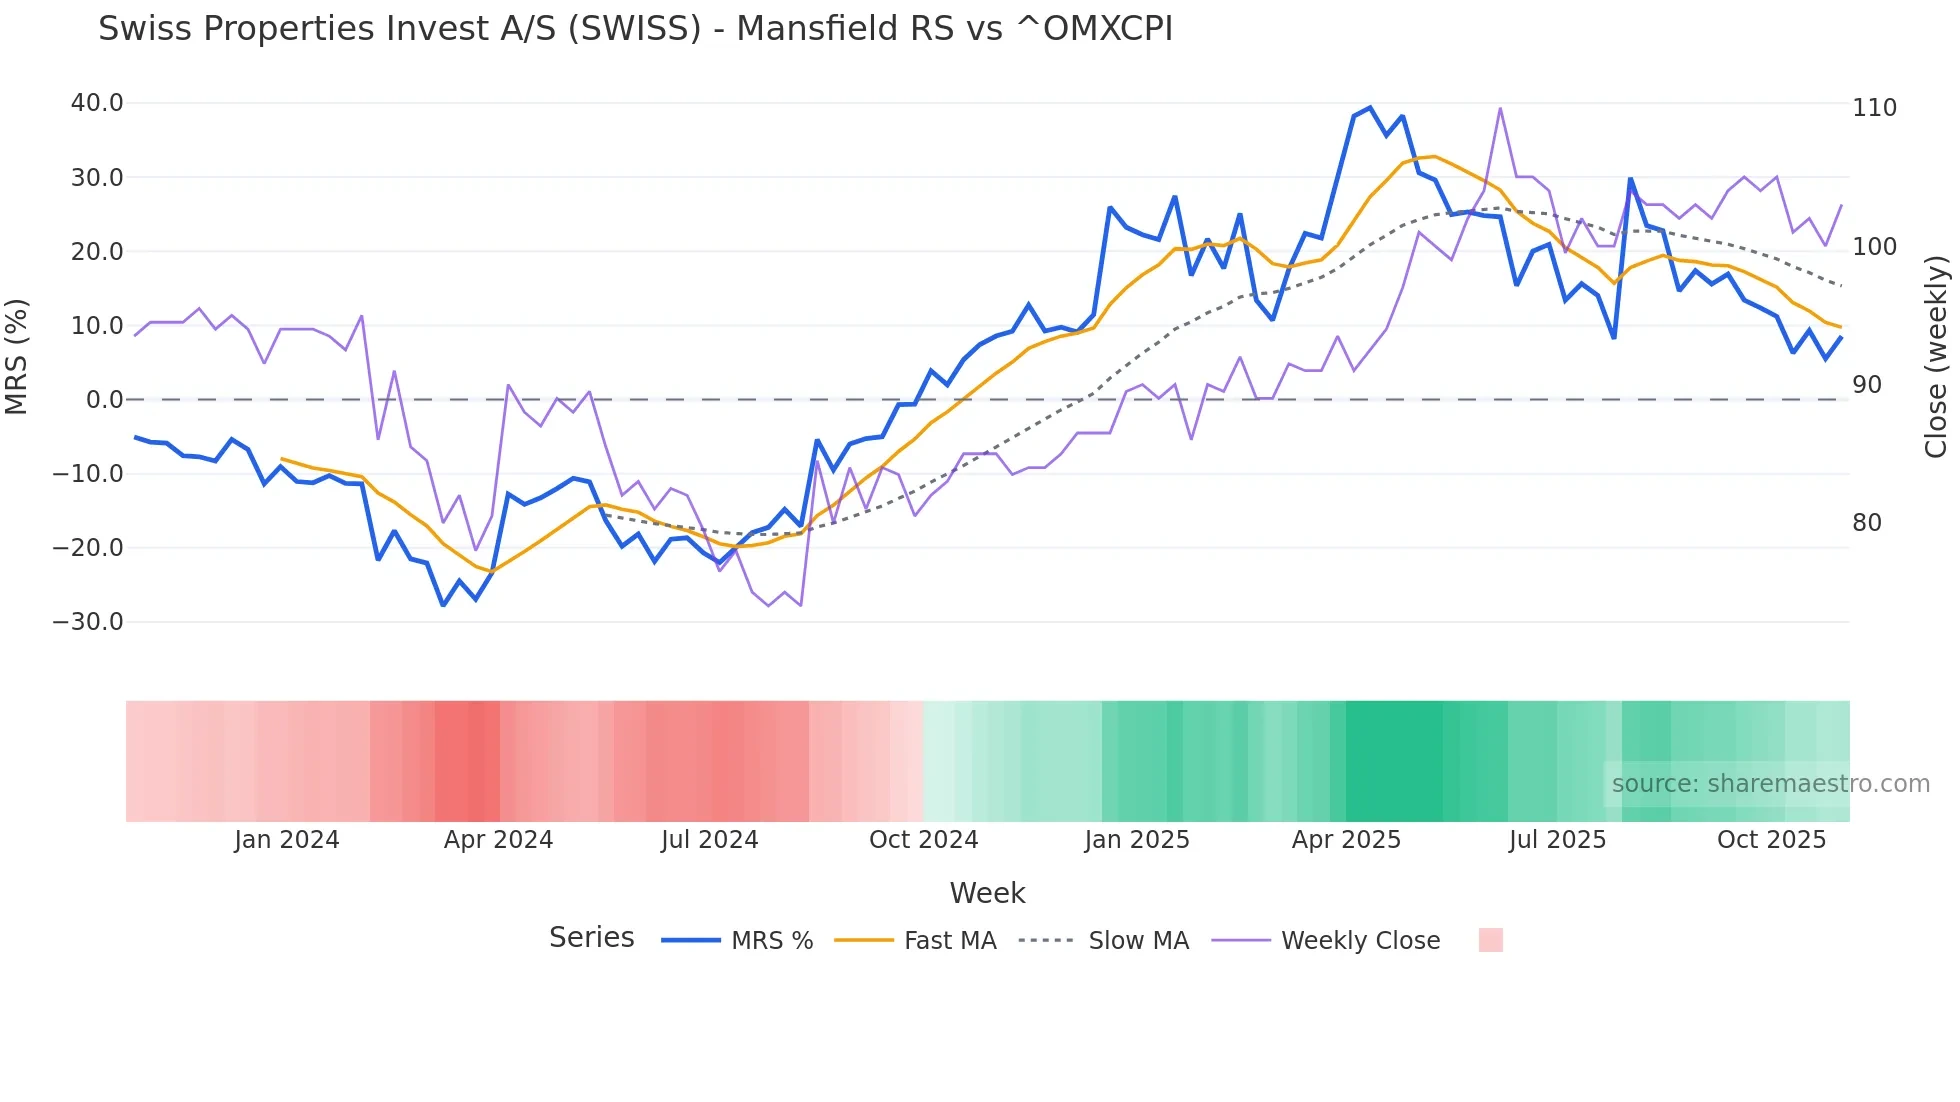
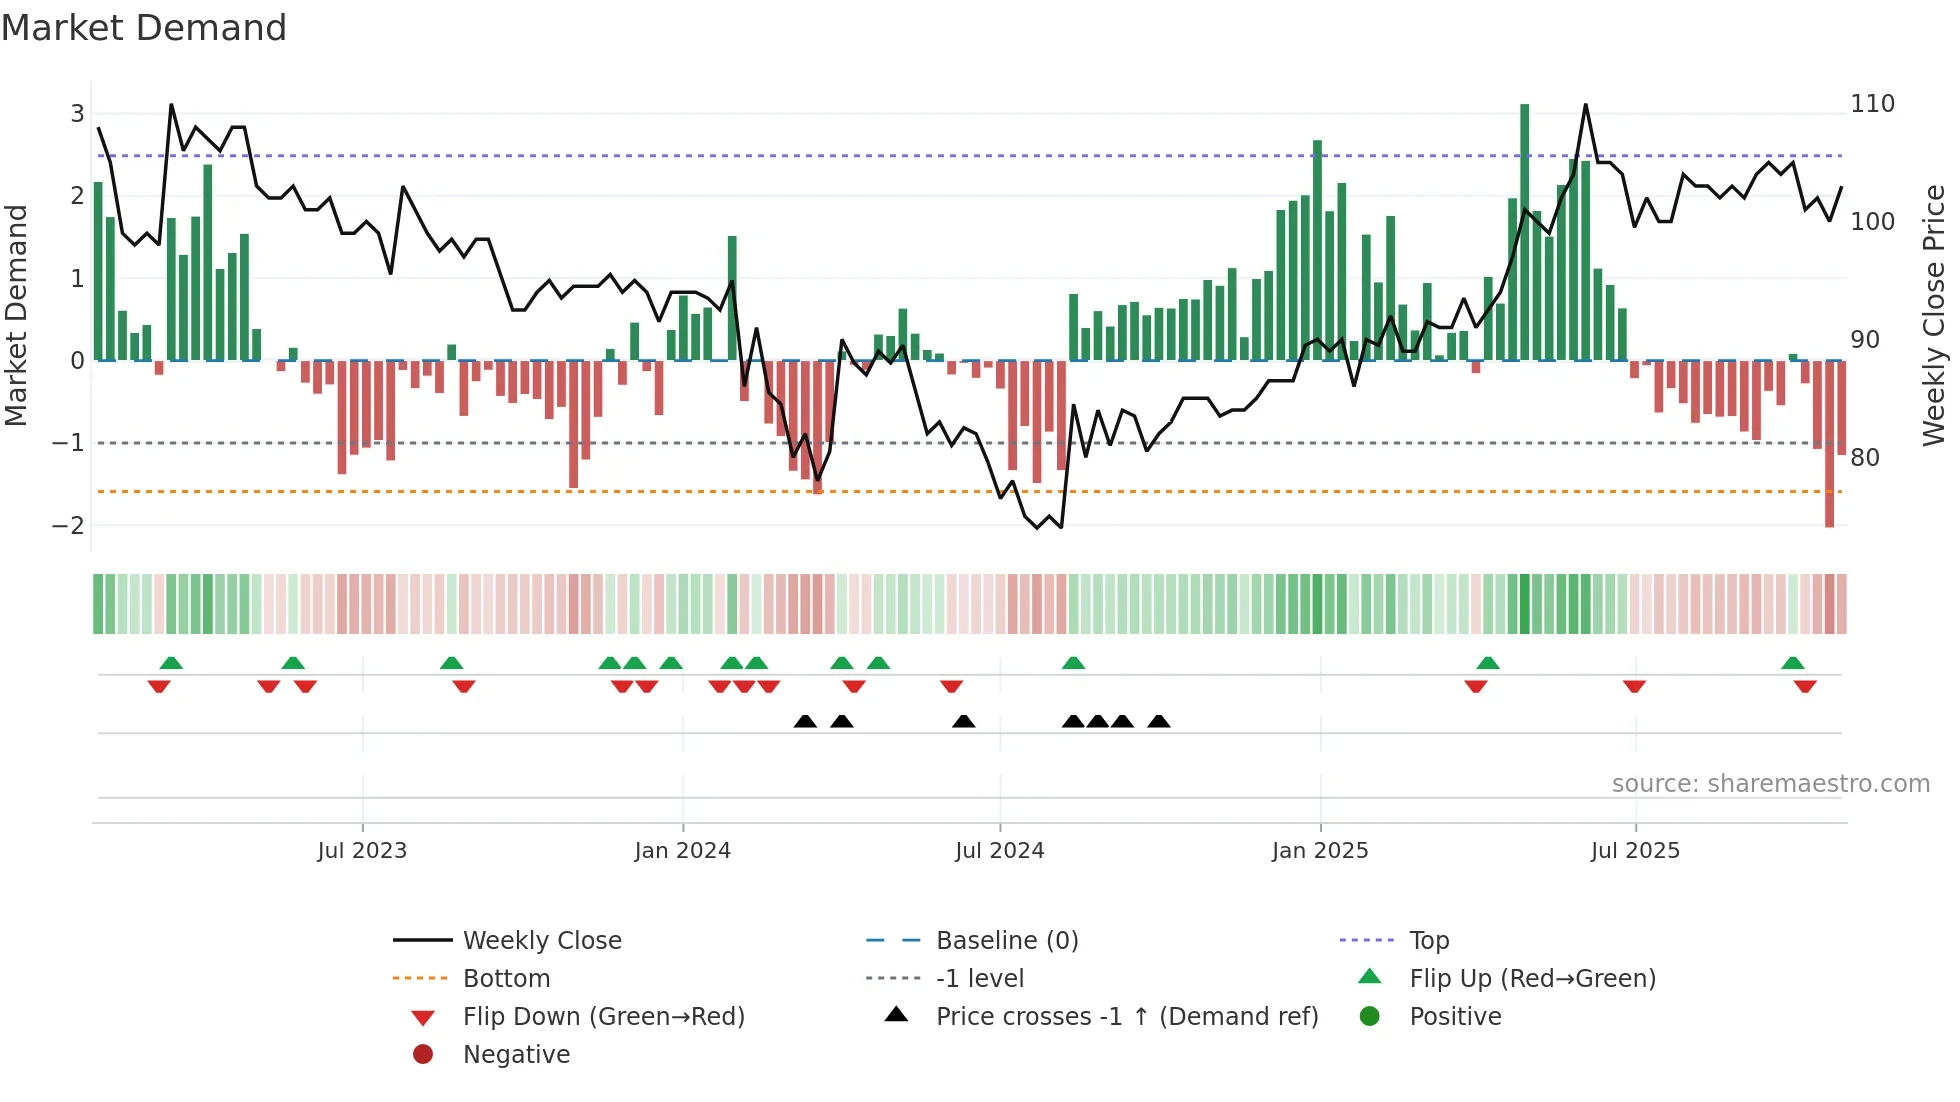
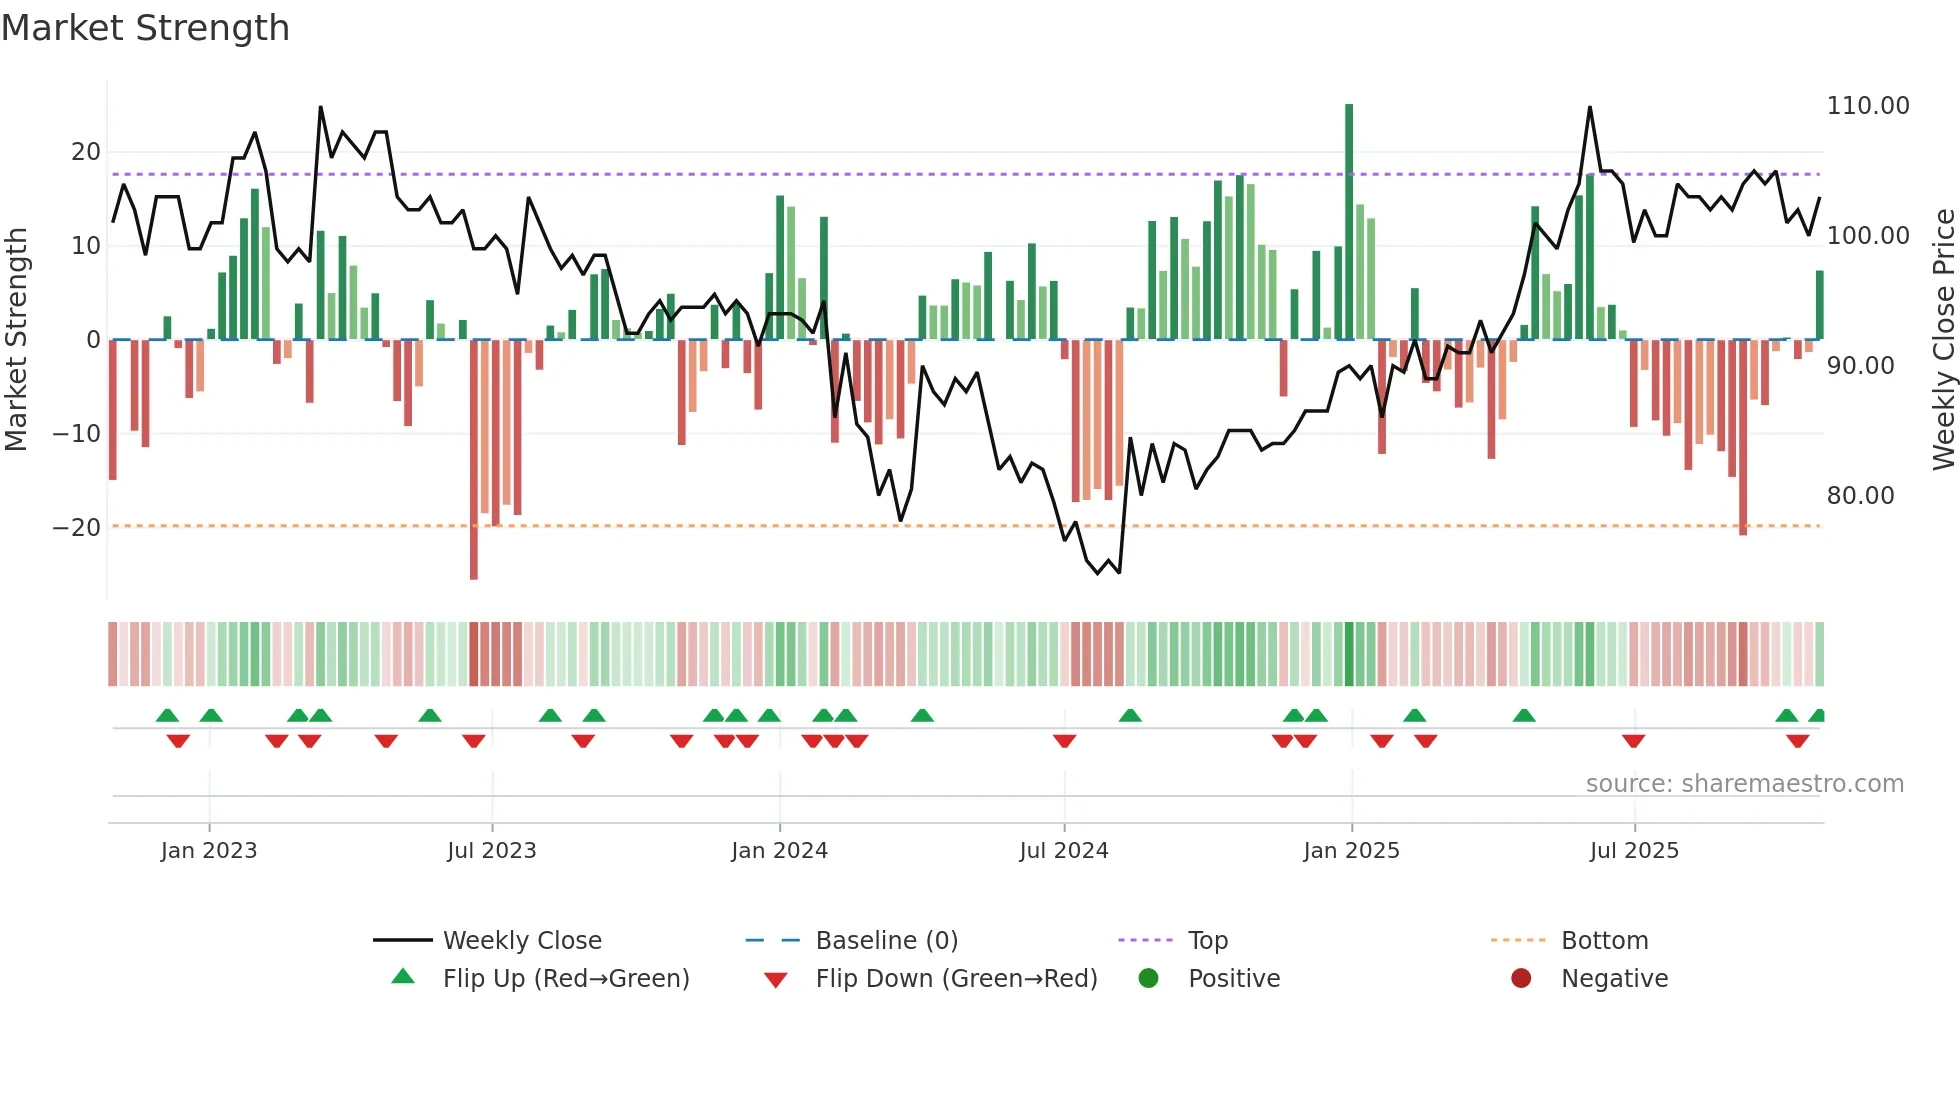
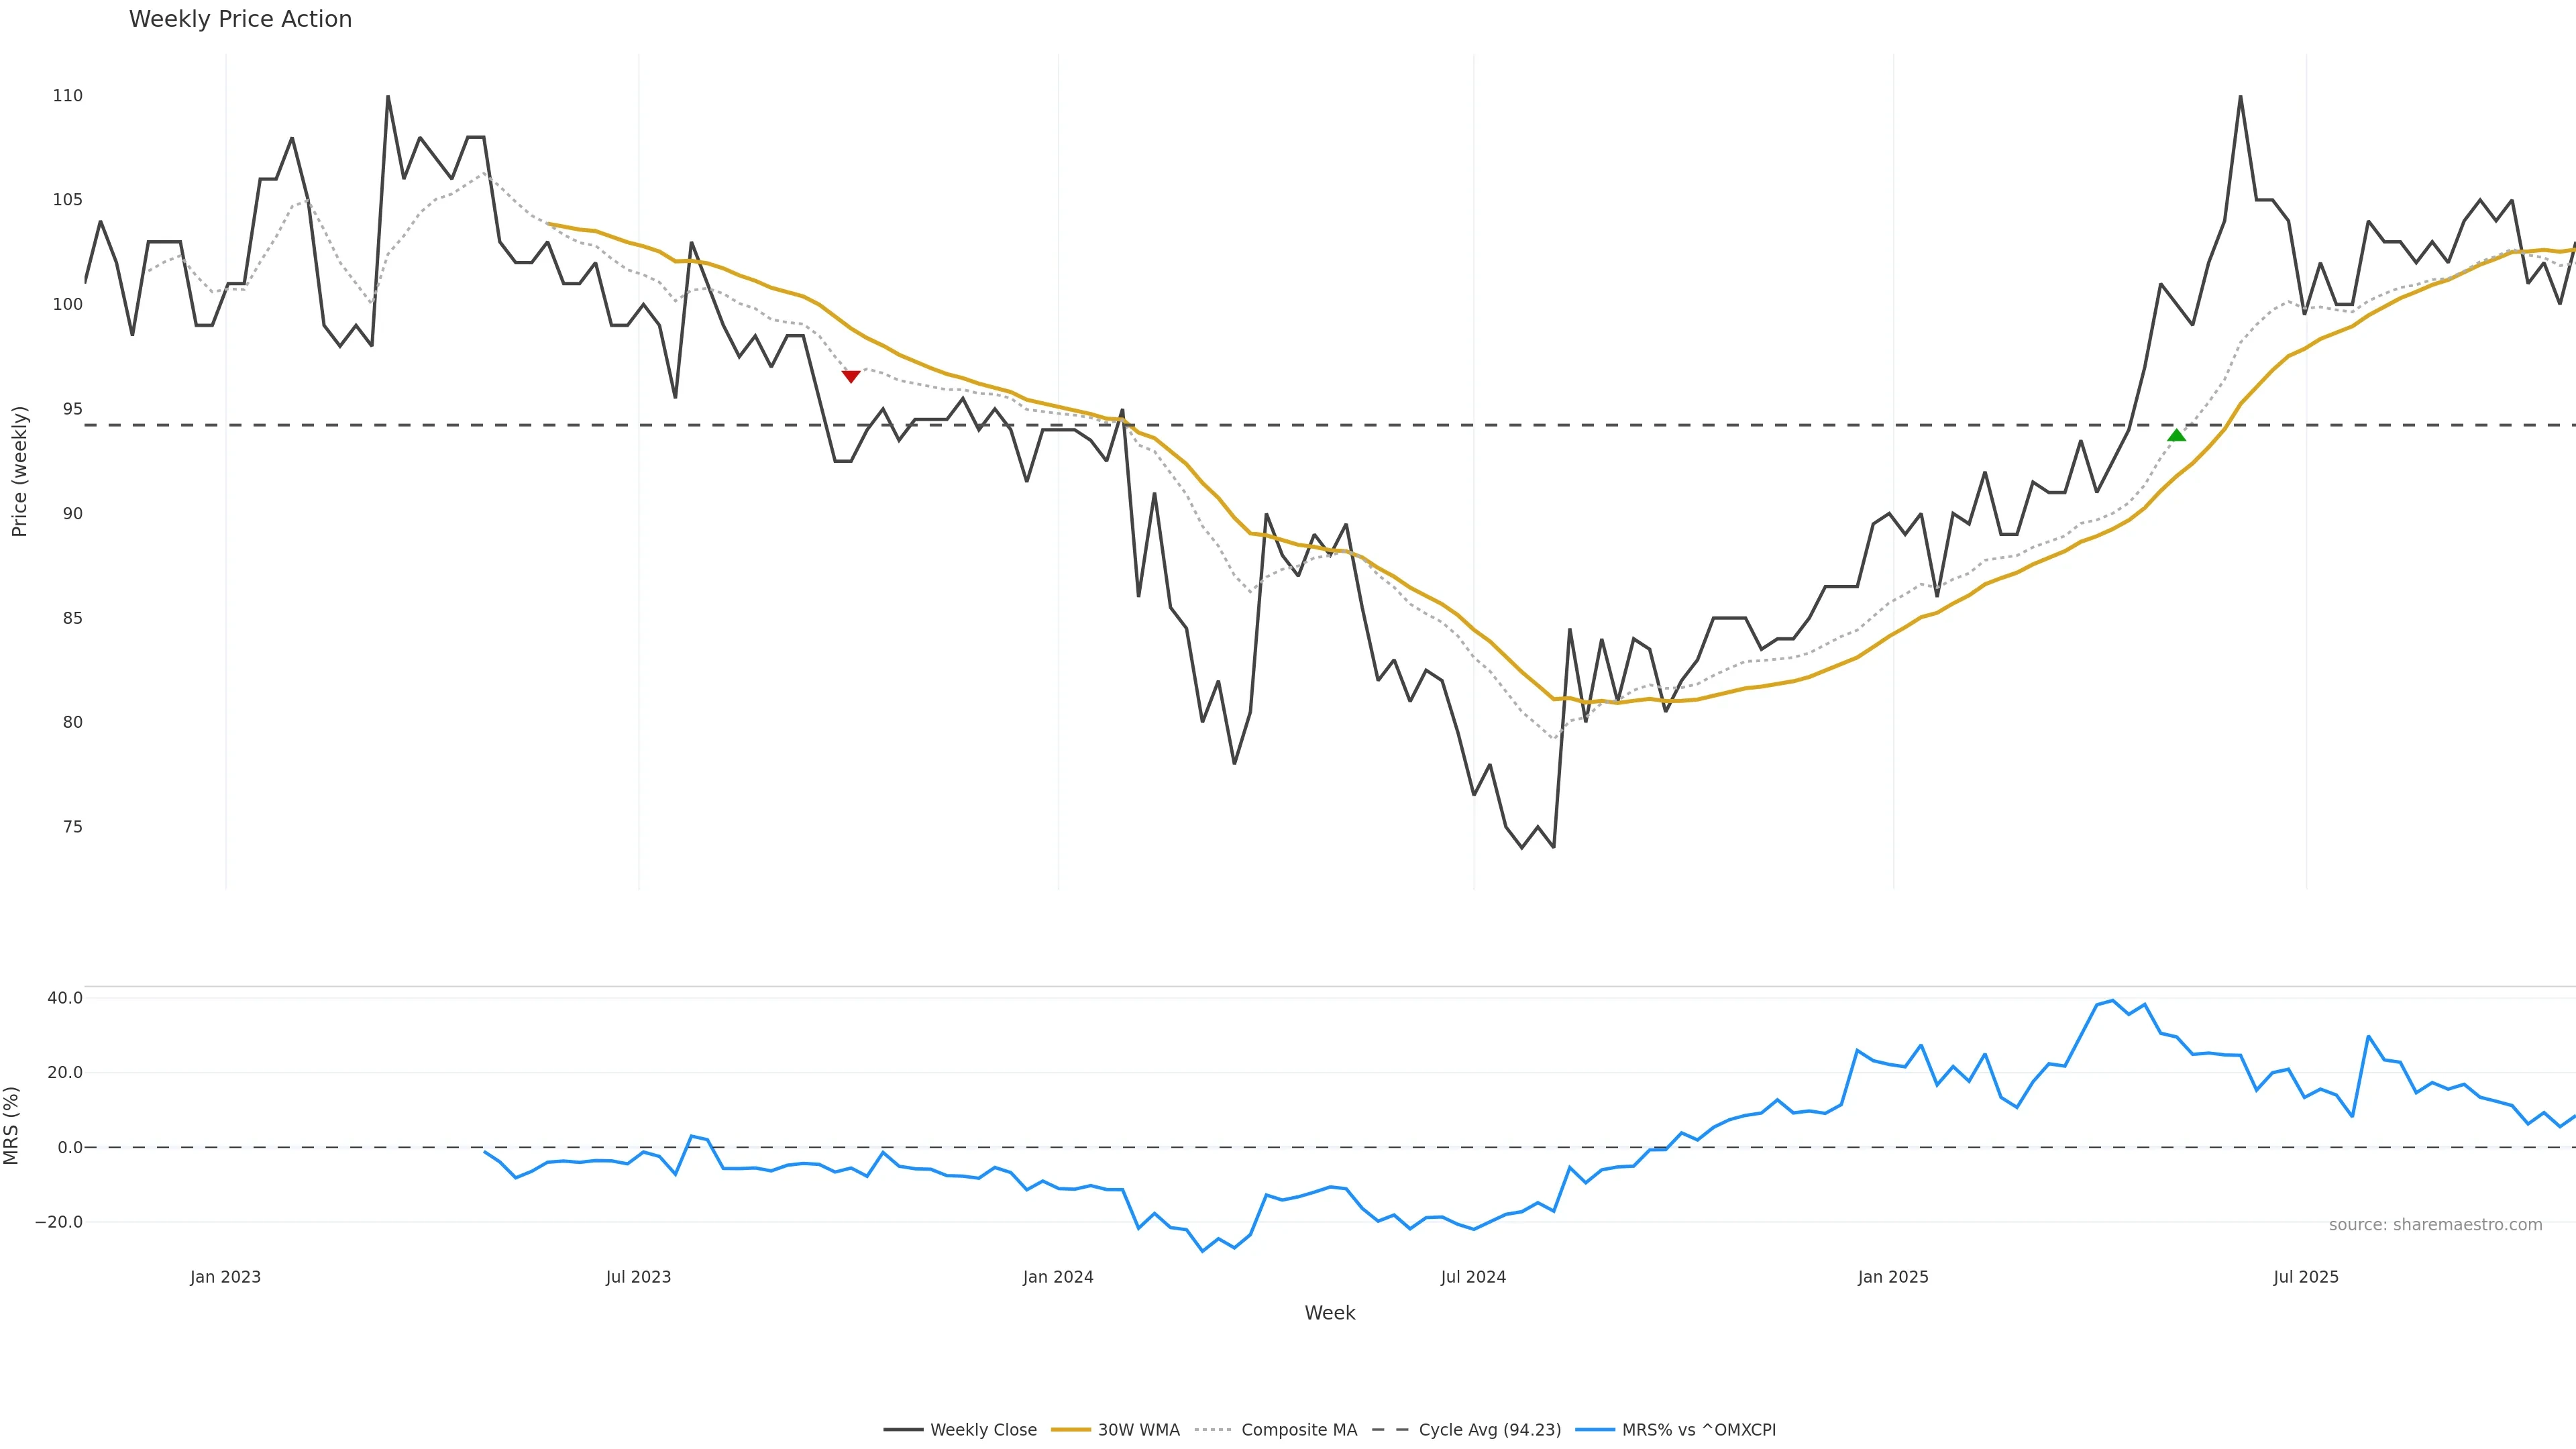
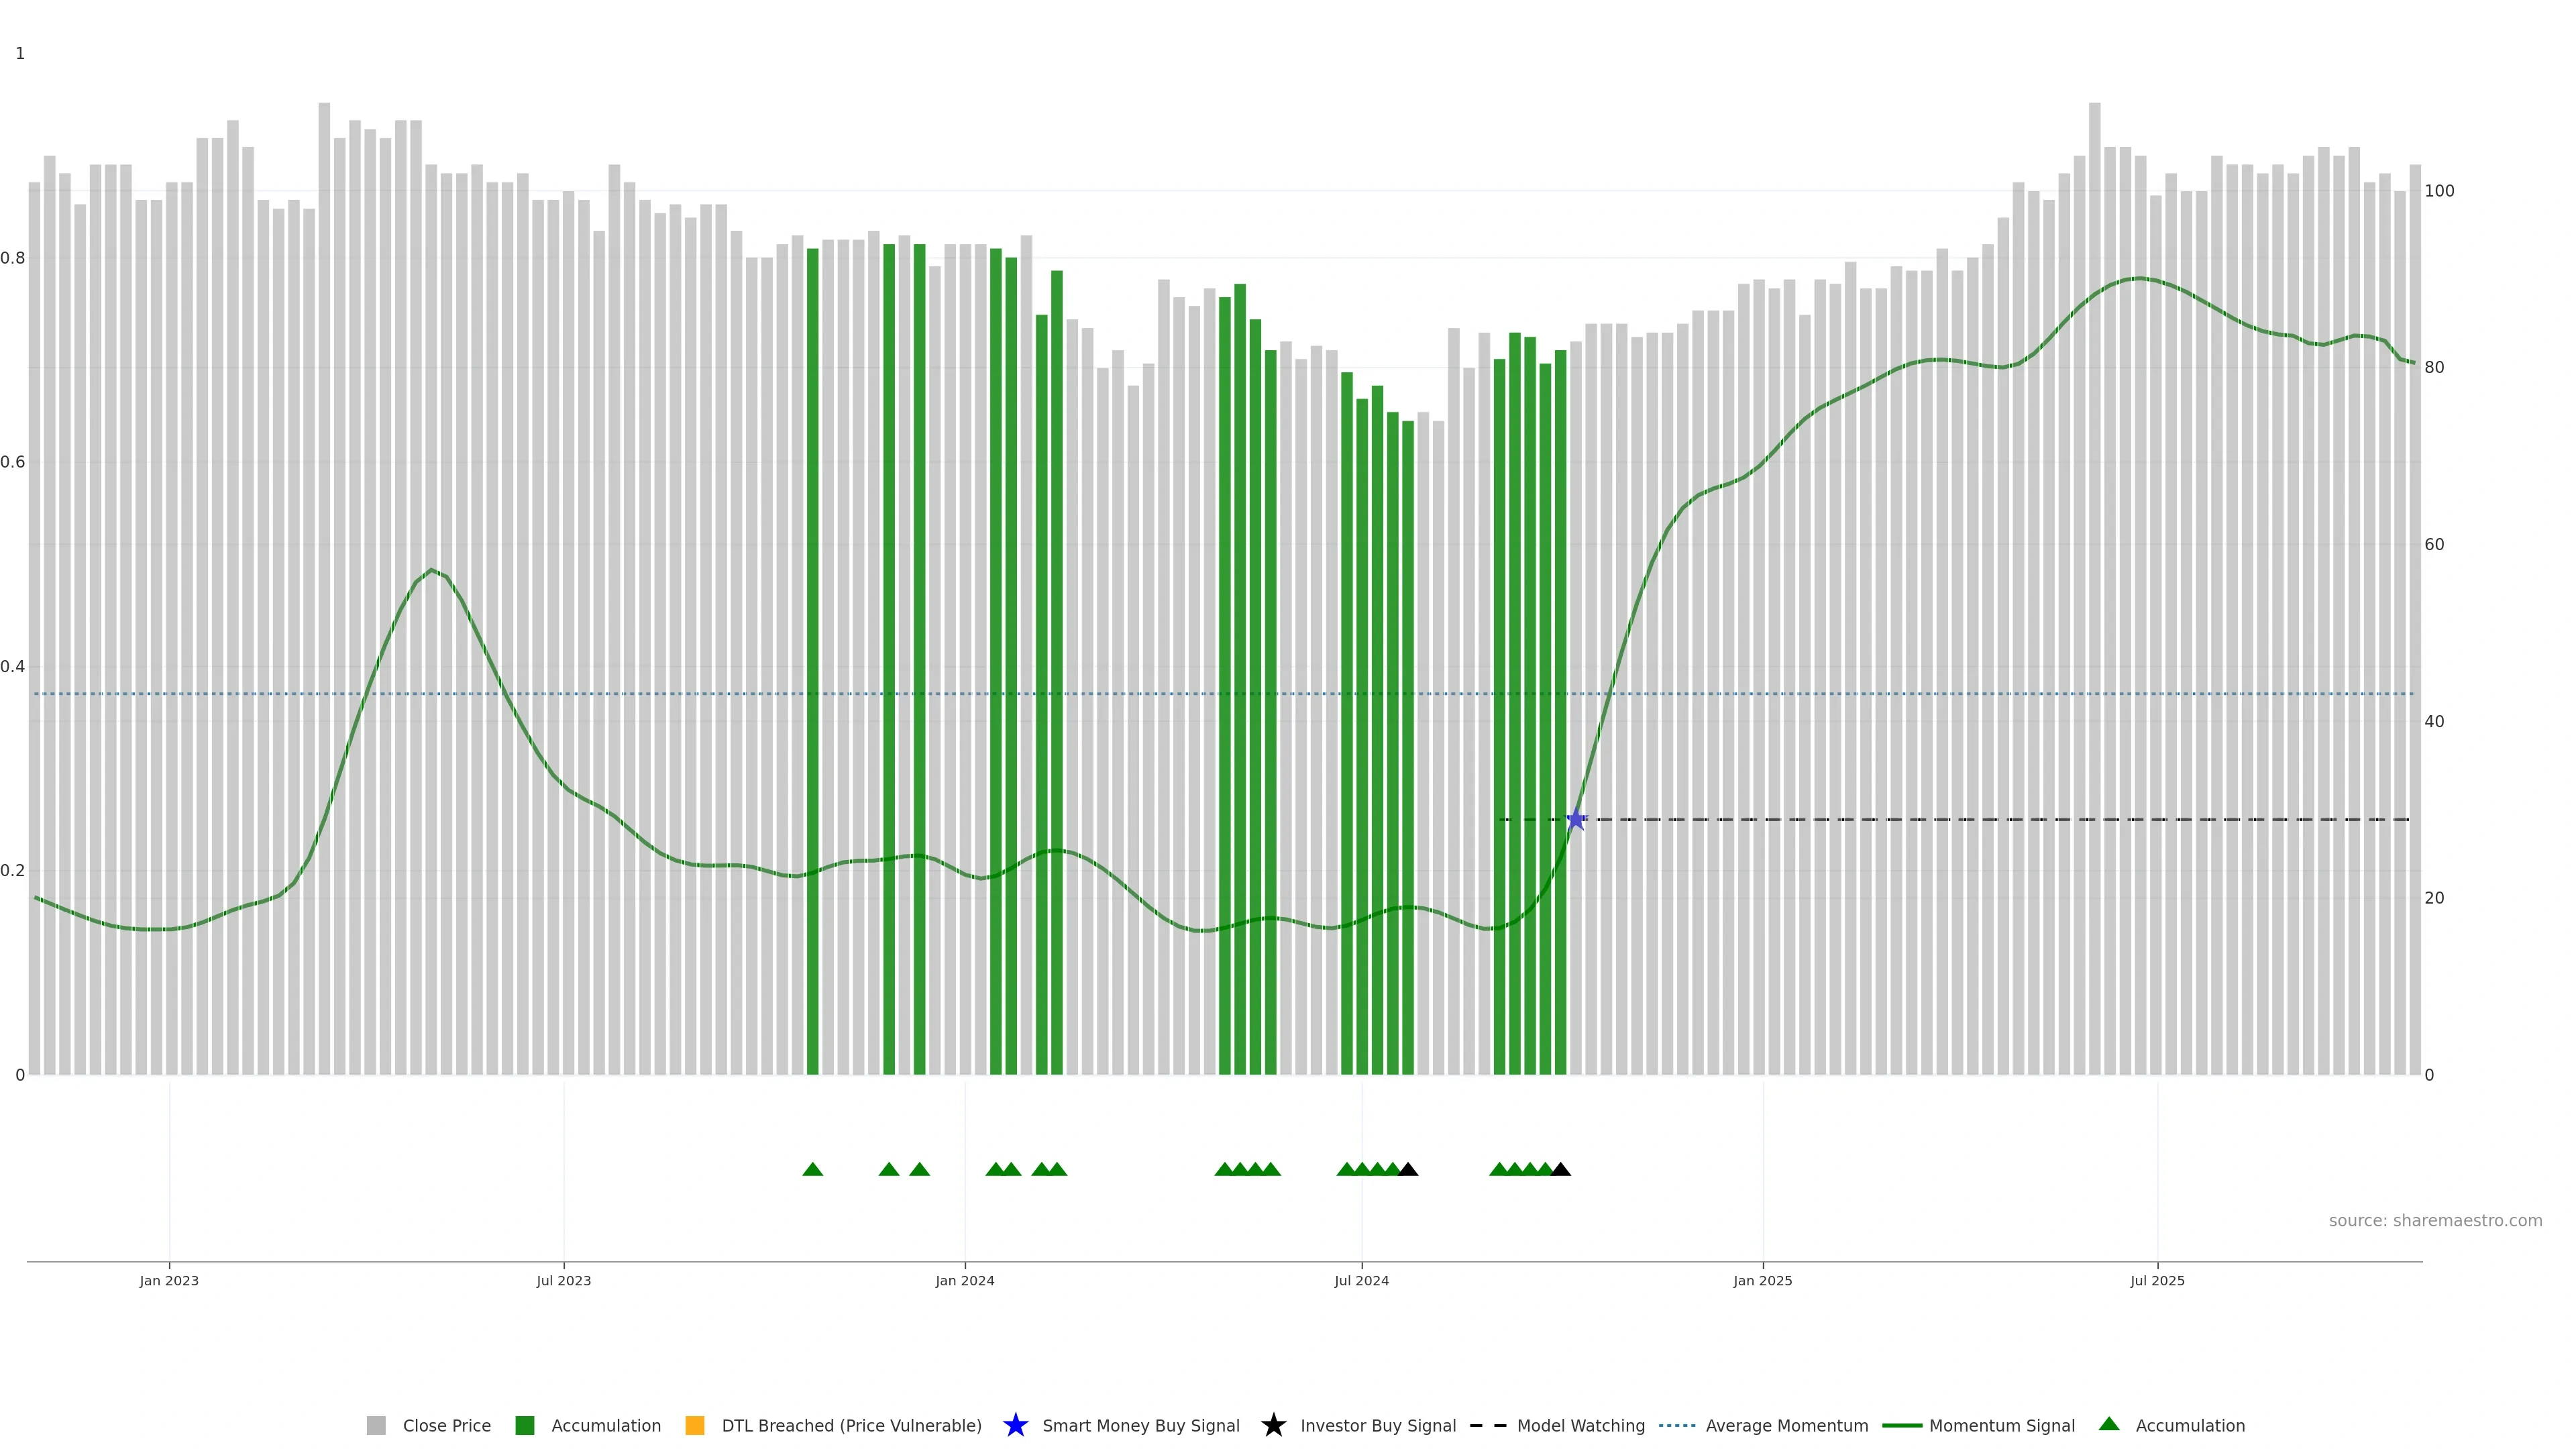
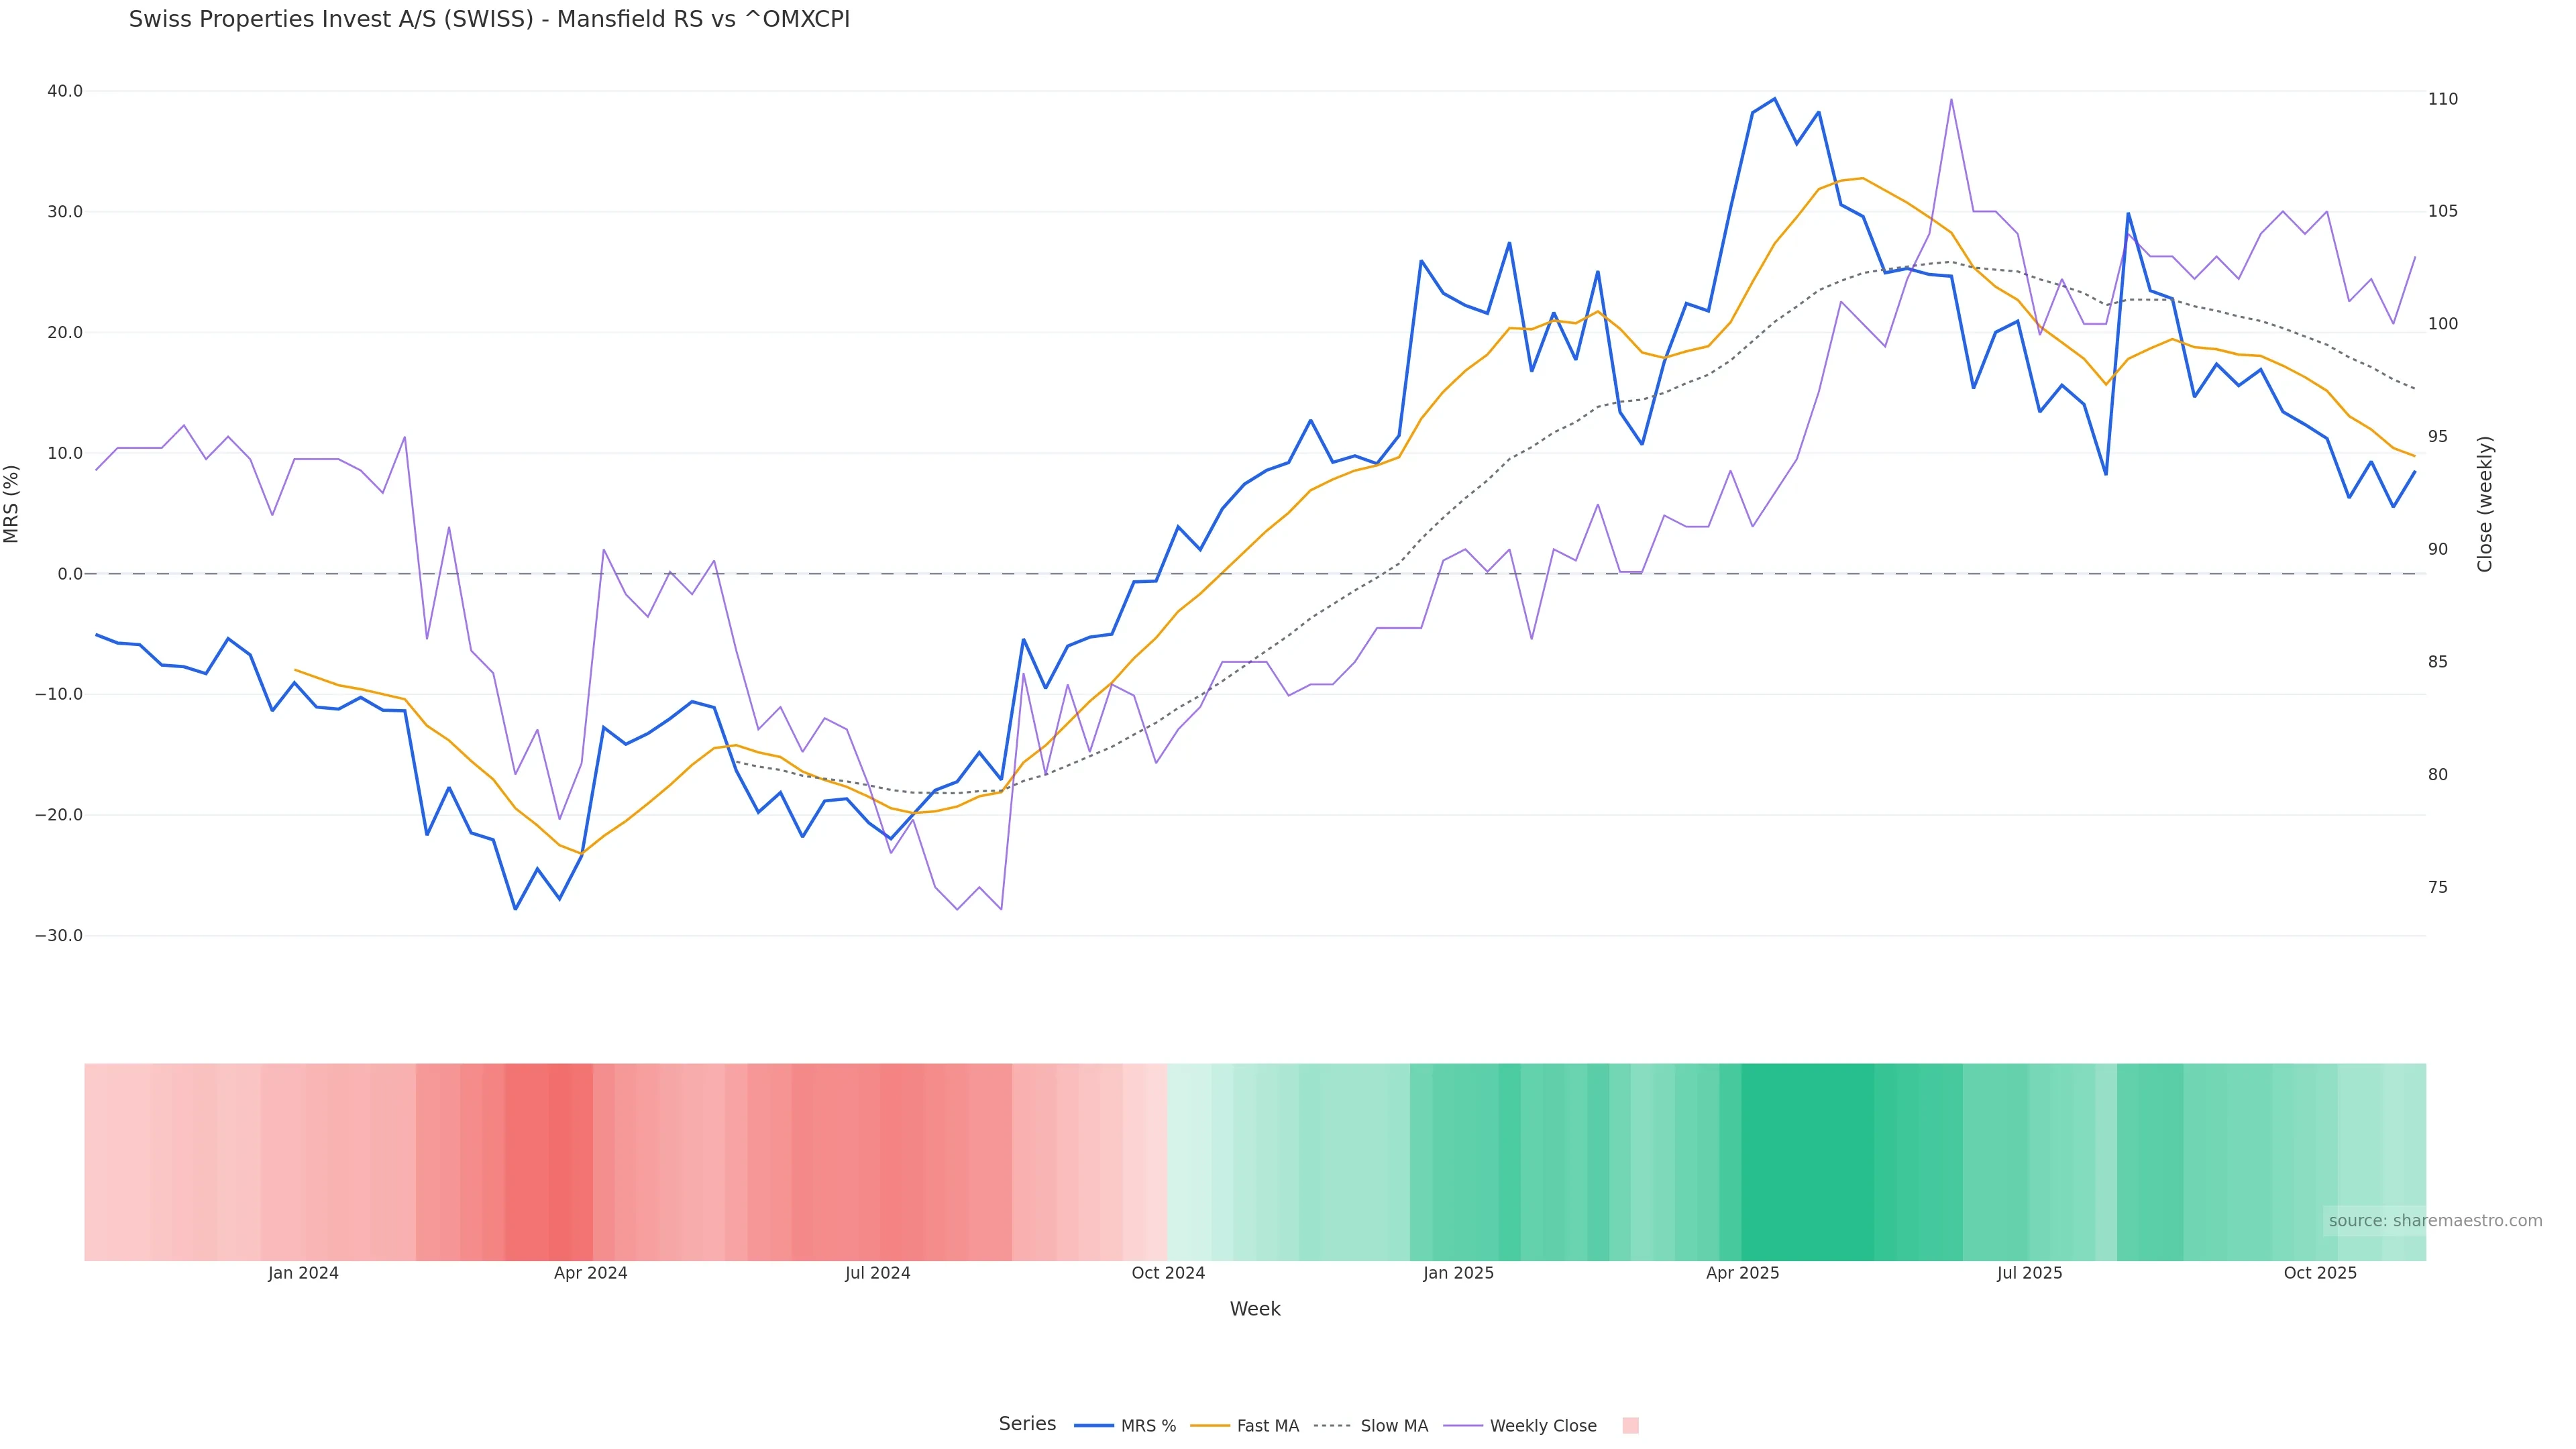
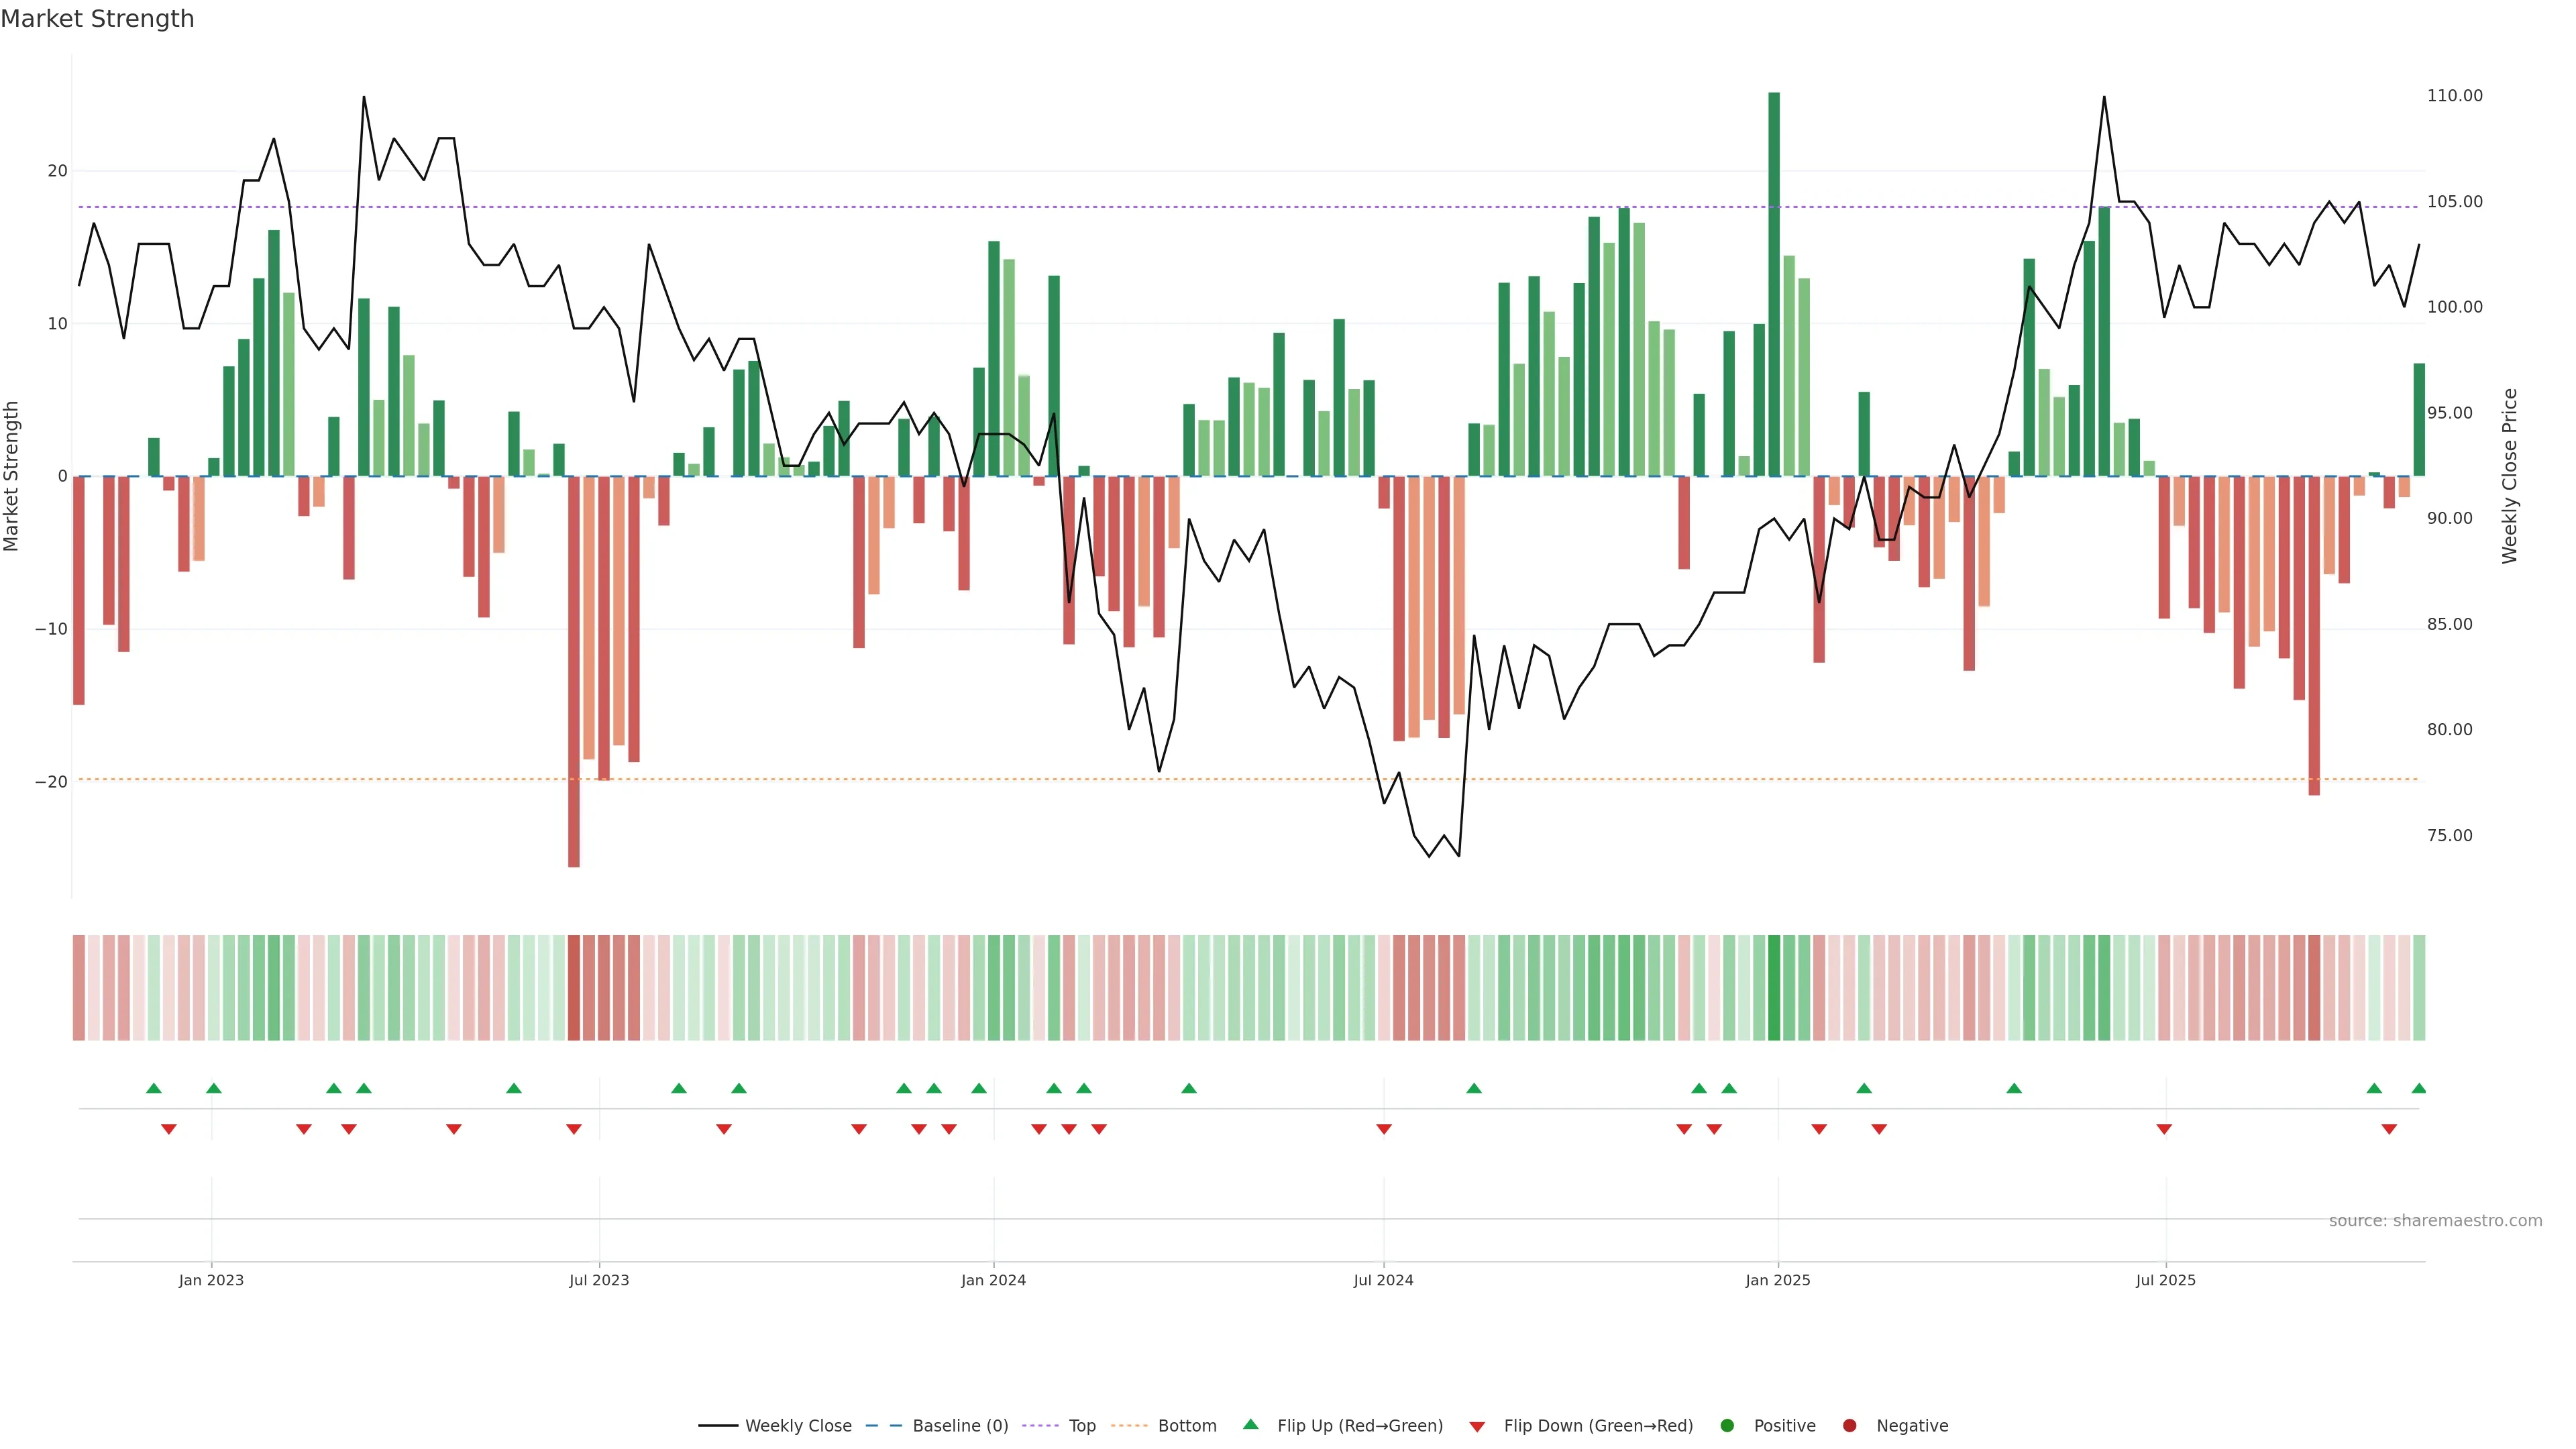
Menu
No results found.
SWISS
Swiss Properties Invest A/S – CPH
“Patience reduces risk more reliably than prediction.”
Weekly Share Price & Valuation Overview
Market Overview
Open
104.0000
Close
104.0000
High
104.0000
Low
104.0000
Trend
0.71644
Swiss Properties Invest A/S
Denmark
• CPH - Copenhagen Stock Exchange
• SWISS
• Currency: DKK
Swiss Properties Invest A/S owns, acquires, operates, develops, and optimizes commercial properties in Switzerland. It is also involved in renting out commercial space. The company was incorporated in 2021 and is based in Copenhagen, Denmark.
Key strengths
- High gross margin (≥35%) suggests strong pricing power or cost control.
- ROE ≥15% reflects strong returns on shareholder equity.
Potential weaknesses
- Quick ratio <0.8 — tight near-term liquidity without inventory.
- Negative free cash flow — operations may rely on external financing.
Scale & Structure
Core size and share structure. TTM values unless noted. “Estimated” where reconciled from per-share × shares.
- Market Cap Total equity value of the company (share price × shares outstanding).
- DKK 237.67M
- Enterprise Value Operating value: market cap + total debt − cash.
- DKK 664.66M
- Total Revenue (TTM) Sales over the last twelve months. May be estimated from revenue per share when inconsistent.
- DKK 19.16M
- Gross Profit (TTM) Revenue minus cost of goods sold over the last twelve months. Hidden for financial institutions or if redundant.
- DKK 17.53M
- Revenue per Share (TTM) Total revenue divided by shares outstanding (may be estimated).
- DKK 8.38
- EPS (TTM) Earnings per share over the last twelve months (may be estimated from net income ÷ shares).
- 25.30
- Shares Outstanding
- 2.29M
- Implied Shares Outstanding
- 2.31M
Profitability & Efficiency
TTM basis. “Reconciled” = numerator ÷ TTM revenue. Margins reflect latest TTM calculations.
- Operating Margin (TTM) Operating income ÷ revenue over the last twelve months (reconciled when possible).
-
2.54%
- Gross Margin (TTM) Reconciled Strong Gross profit ÷ revenue over the last twelve months (reconciled when possible).
-
91.48%
- Profit Margin (TTM) Net income ÷ revenue over the last twelve months (reconciled when possible).
-
3.01%
- ROA Return on assets: net income ÷ total assets.
-
1.55%
- ROE Excellent Return on equity: net income ÷ shareholder equity.
-
20.65%
Growth
Growth rates are YoY unless labeled QoQ.
- Revenue Growth Year-over-year revenue growth.
-
-58.70%
- Earnings Growth (YoY) Year-over-year earnings growth.
-
4.67%
- Earnings Growth (QoQ) Quarter-over-quarter earnings growth.
-
4.81%
Liquidity & Solvency
Balance-sheet health. Debt metrics shown as latest ratios; D/E is a ratio (not %).
- Quick Ratio Liquid current assets ÷ current liabilities (ex-inventory).
- 0.33
- Debt to Equity Total debt ÷ shareholder equity; leverage.
- 1.41
- Total Cash Cash and equivalents.
- DKK 3.99M
- Total Debt Short + long-term interest-bearing debt.
- DKK 430.98M
- Net Debt Total debt − cash (negative = net cash).
- DKK 427.00M
Cash Flow
Shown only when internally consistent; margins are TTM.
- Operating Cash Flow (TTM) Cash generated by core operations (pre-capex).
- DKK 16.06M
- OCF Margin (TTM) Operating cash flow ÷ revenue (TTM).
-
83.81%
Sharemaestro House View
Confidence: 2
Sharemaestro internal conviction (0–3, higher is better).
Risk: 1
Sharemaestro internal risk profile (0–3, higher is safer).
Composite Score: 3
Overall internal composite (0–3, higher is better).
Suggested Allocation: 5.00%
Indicative portfolio weighting suggestion based on house view.
Structural Insights
(experimental)
Ownership & Liquidity
Free Float
Proportion of shares available for public trading.
—
Insiders
Shares held by company insiders (officers, directors).
—
Institutions
Shares held by institutions (funds, pensions).
3.2%
Capital Structure
Potential Dilution
Increase in share count if options/convertibles exercise.
1.0%
Net Debt
Total debt − cash (negative = net cash).
DKK 427.00M
2228.8% of revenue
Net debt relative to revenue — debt load vs business scale.
Resilience Score
0–100 composite of liquidity, leverage and cash conversion; higher is better. If inputs are unavailable, we estimate using proxies (Net debt vs revenue, Cash-to-Debt). It is a guide, not a rating.
27
Methodology Notes
- Margins shown on a TTM basis. “Reconciled” = numerator ÷ TTM revenue for internal consistency.
- Cash Flow section is displayed only when figures are self-consistent (and hidden for financials).
As of: 2025-09-09 12:44
Disclaimer: Information is compiled from publicly available sources and is subject to errors and omissions. It is provided as a guide only and does not constitute investment advice. Please do your own research.
Performance Edge:
Signals that work. Valuations that spot mispricing early. A disciplined, data-driven methodology powered by machine learning. Sharemaestro helps high-net-worth investors, hedge funds, family offices, and institutions move sooner - and with conviction - when the market presents asymmetric opportunity.
Subscribe to Sharemaestro: