Annexon, Inc.
ANNX NASDAQ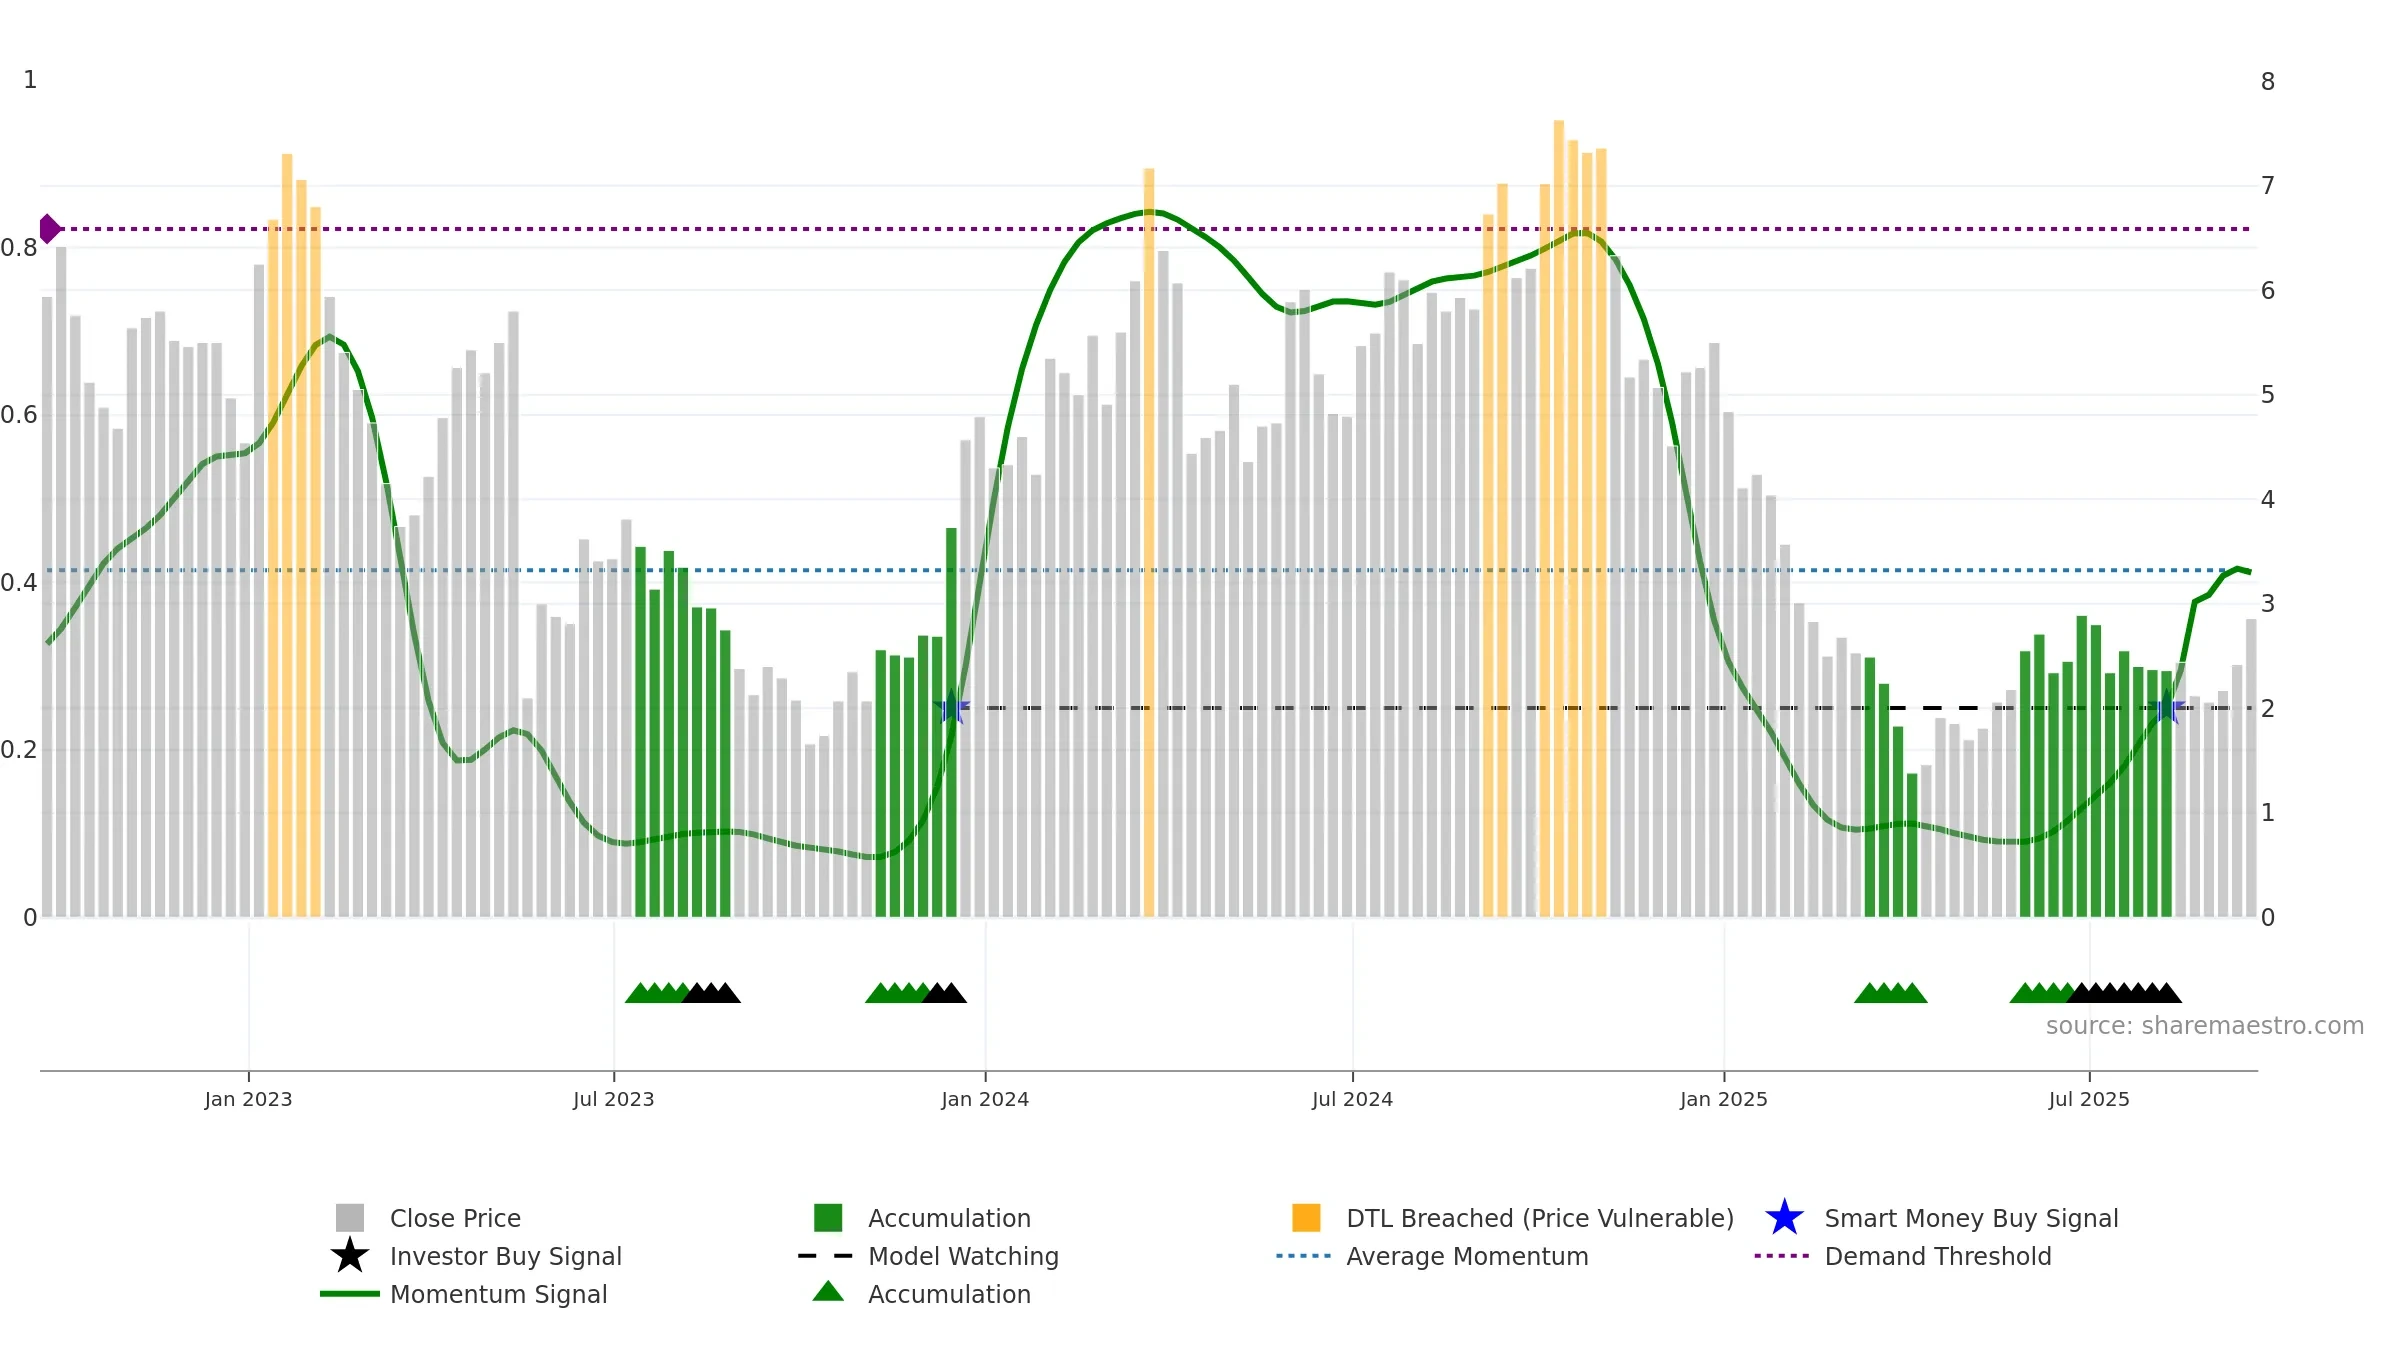
Weekly Report
Annexon, Inc. closed at 2.8600 (7.12% WoW) . Data window ends Fri, 19 Sep 2025.
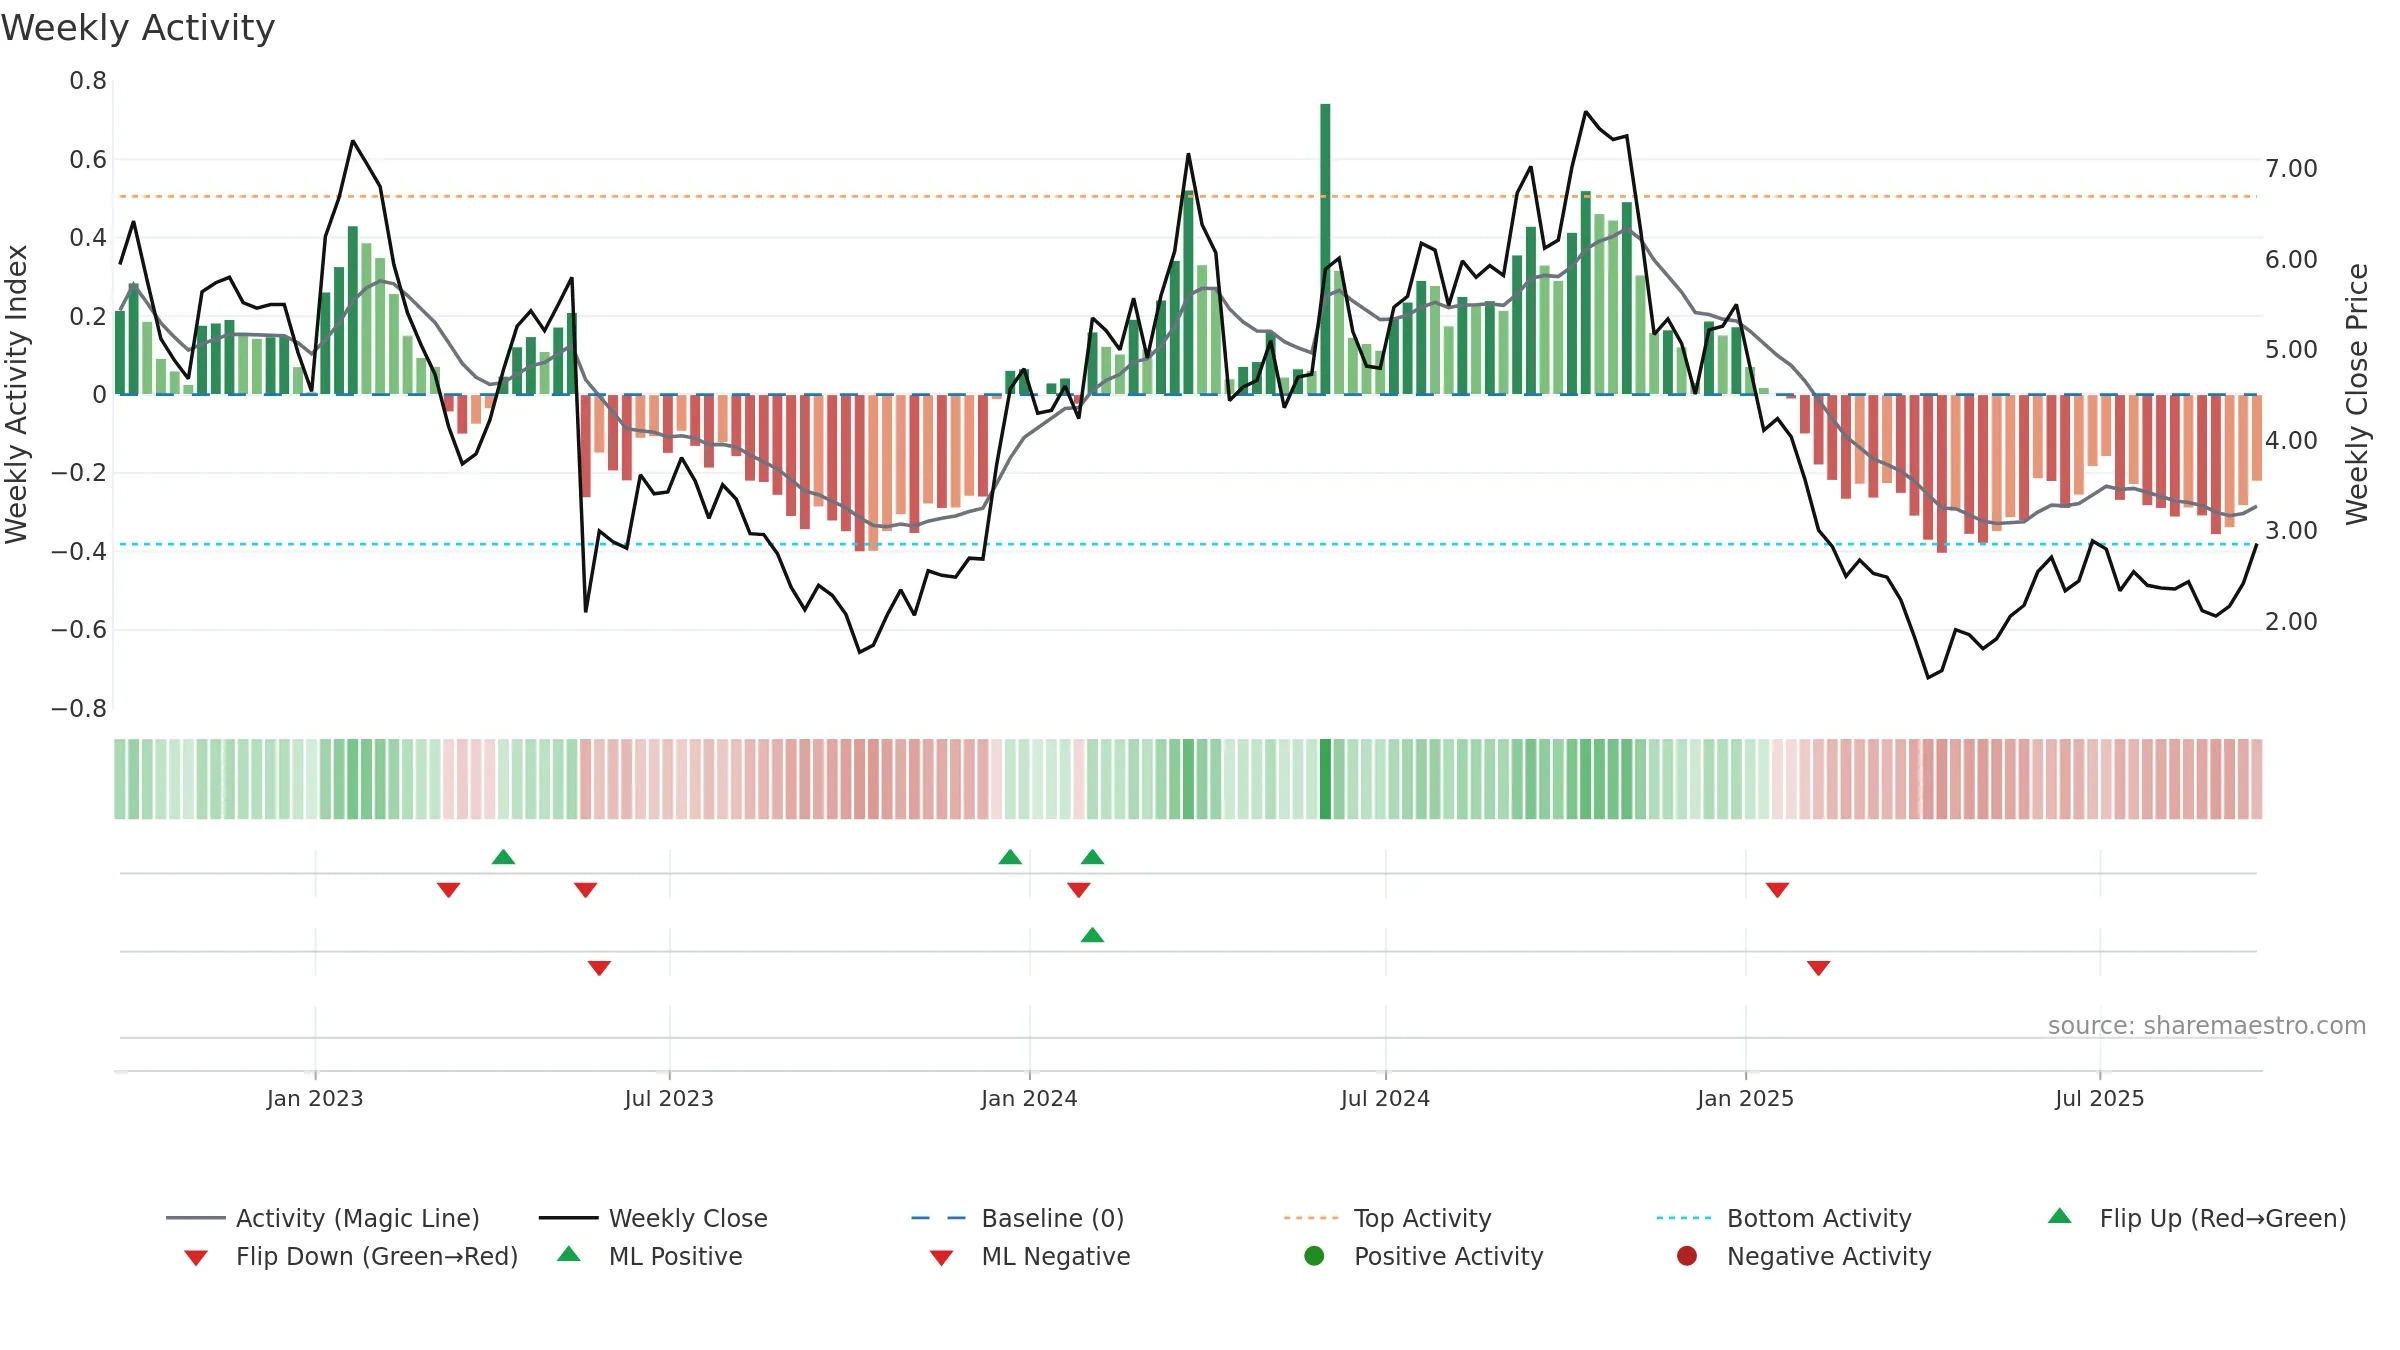
How to read this — Price slope is upward, indicating persistent buying over the window. Volume and price are moving in the same direction — a constructive confirmation. Fresh short-term crossover improves near-term tone. Price holds above key averages, indicating constructive participation.
Up-slope supports buying interest; pullbacks may be contained if activity stays firm.
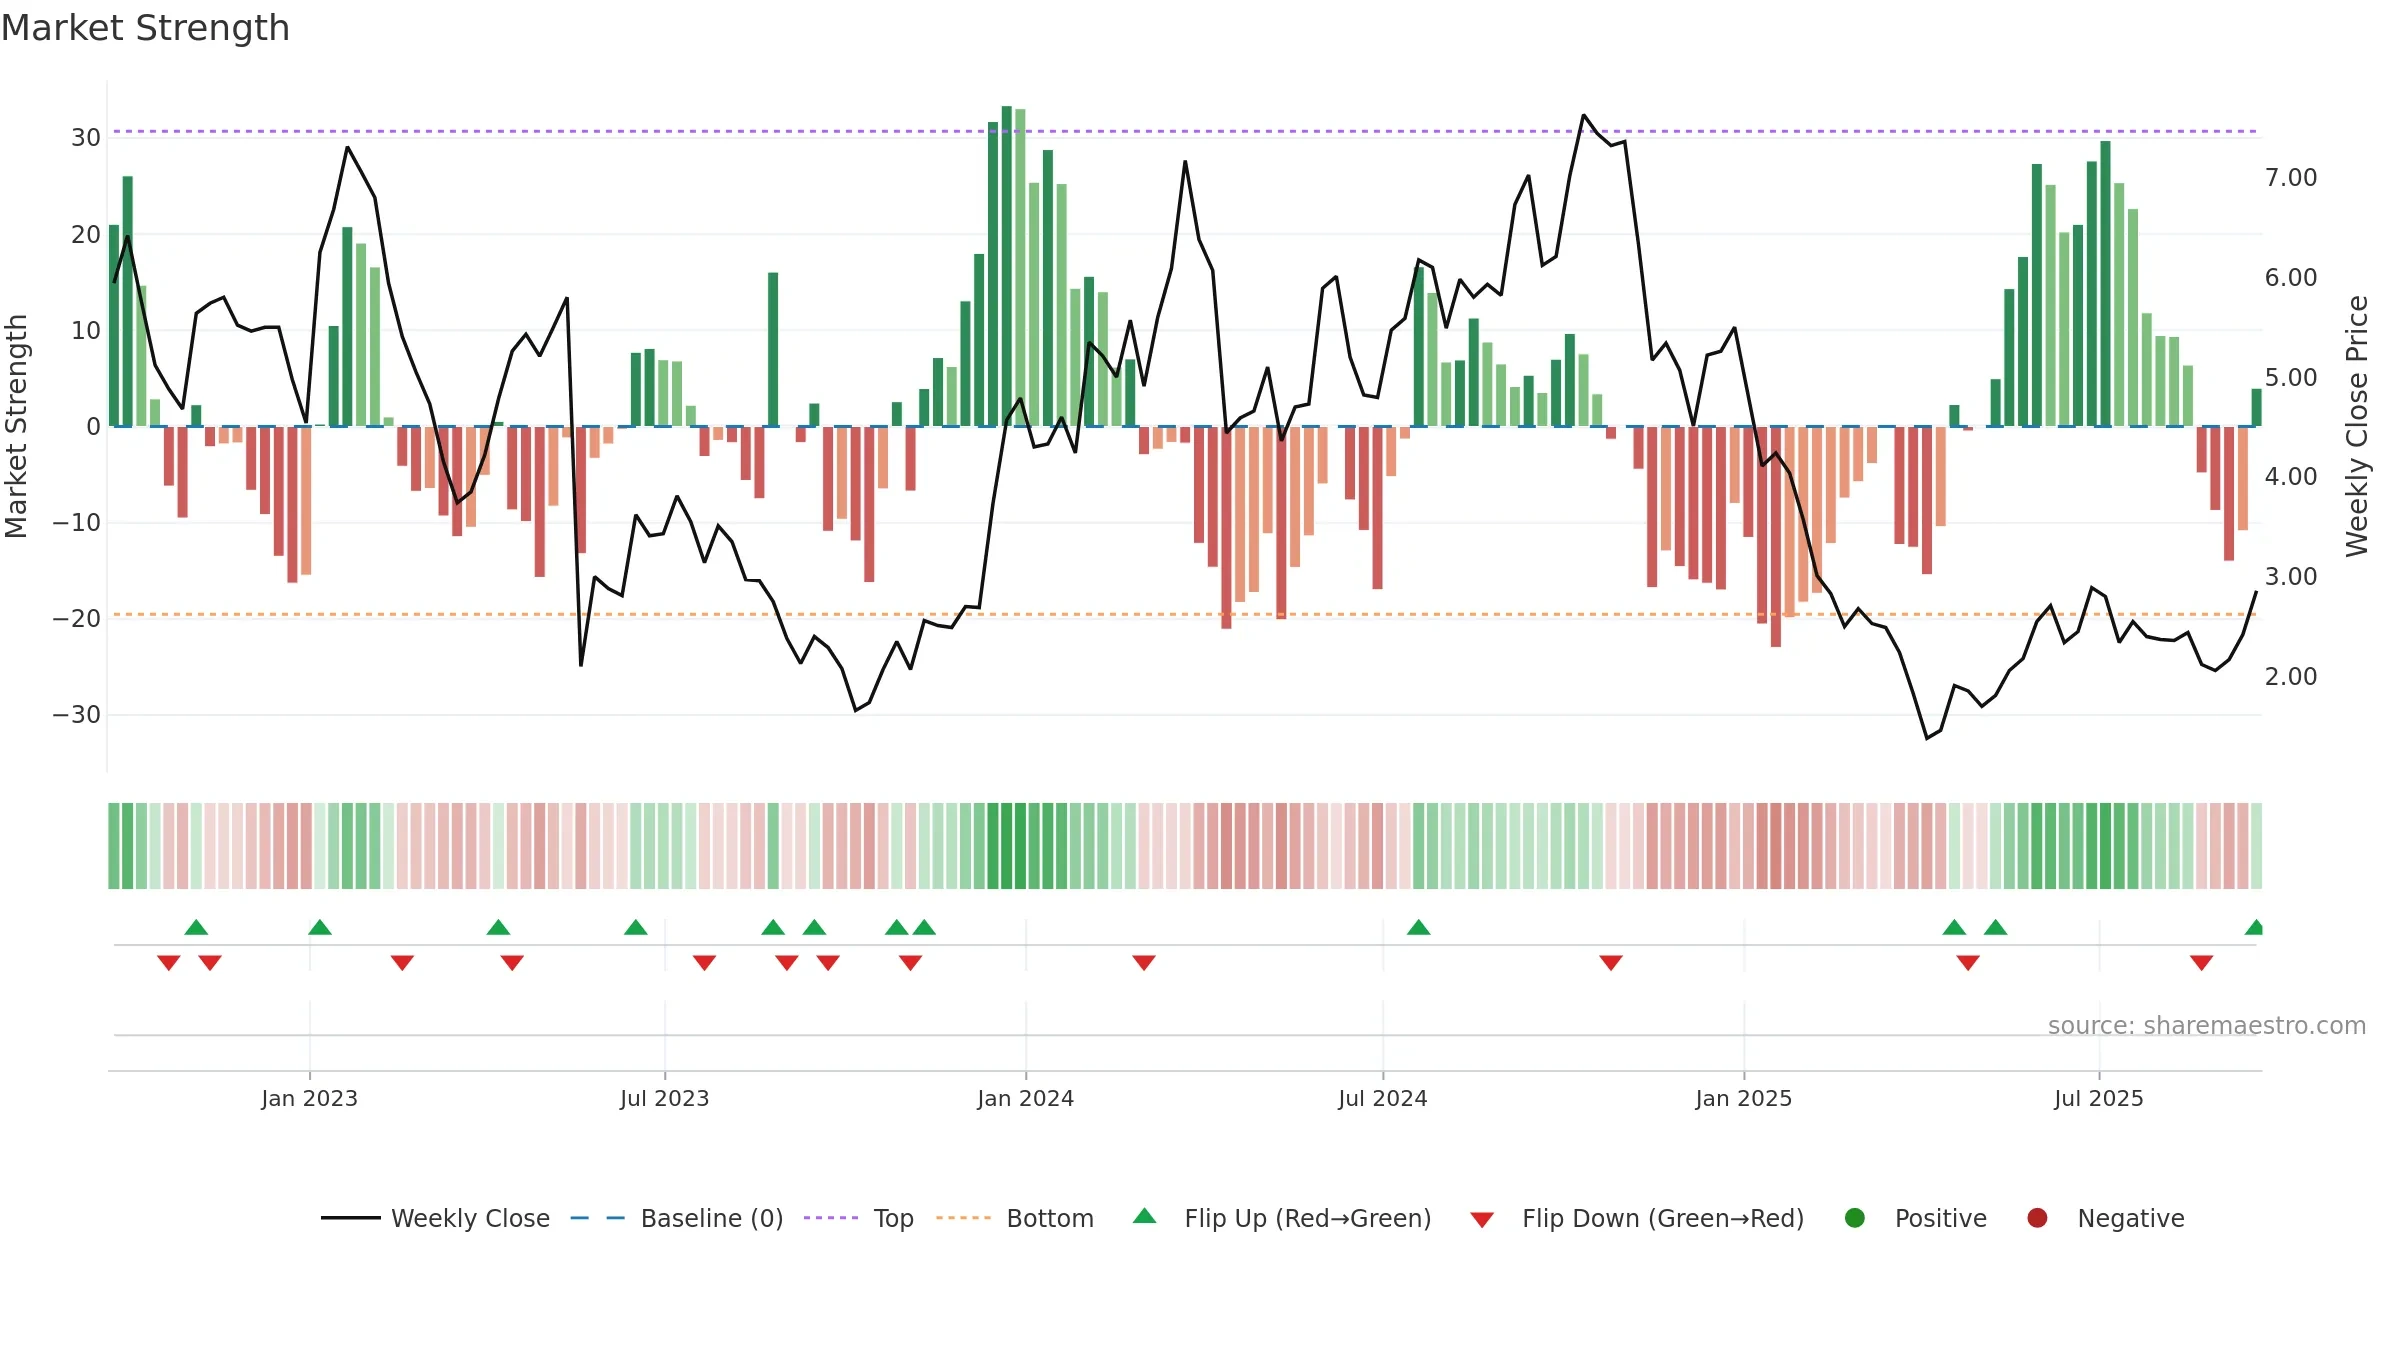
Gauge maps the trend signal to a 0–100 scale.
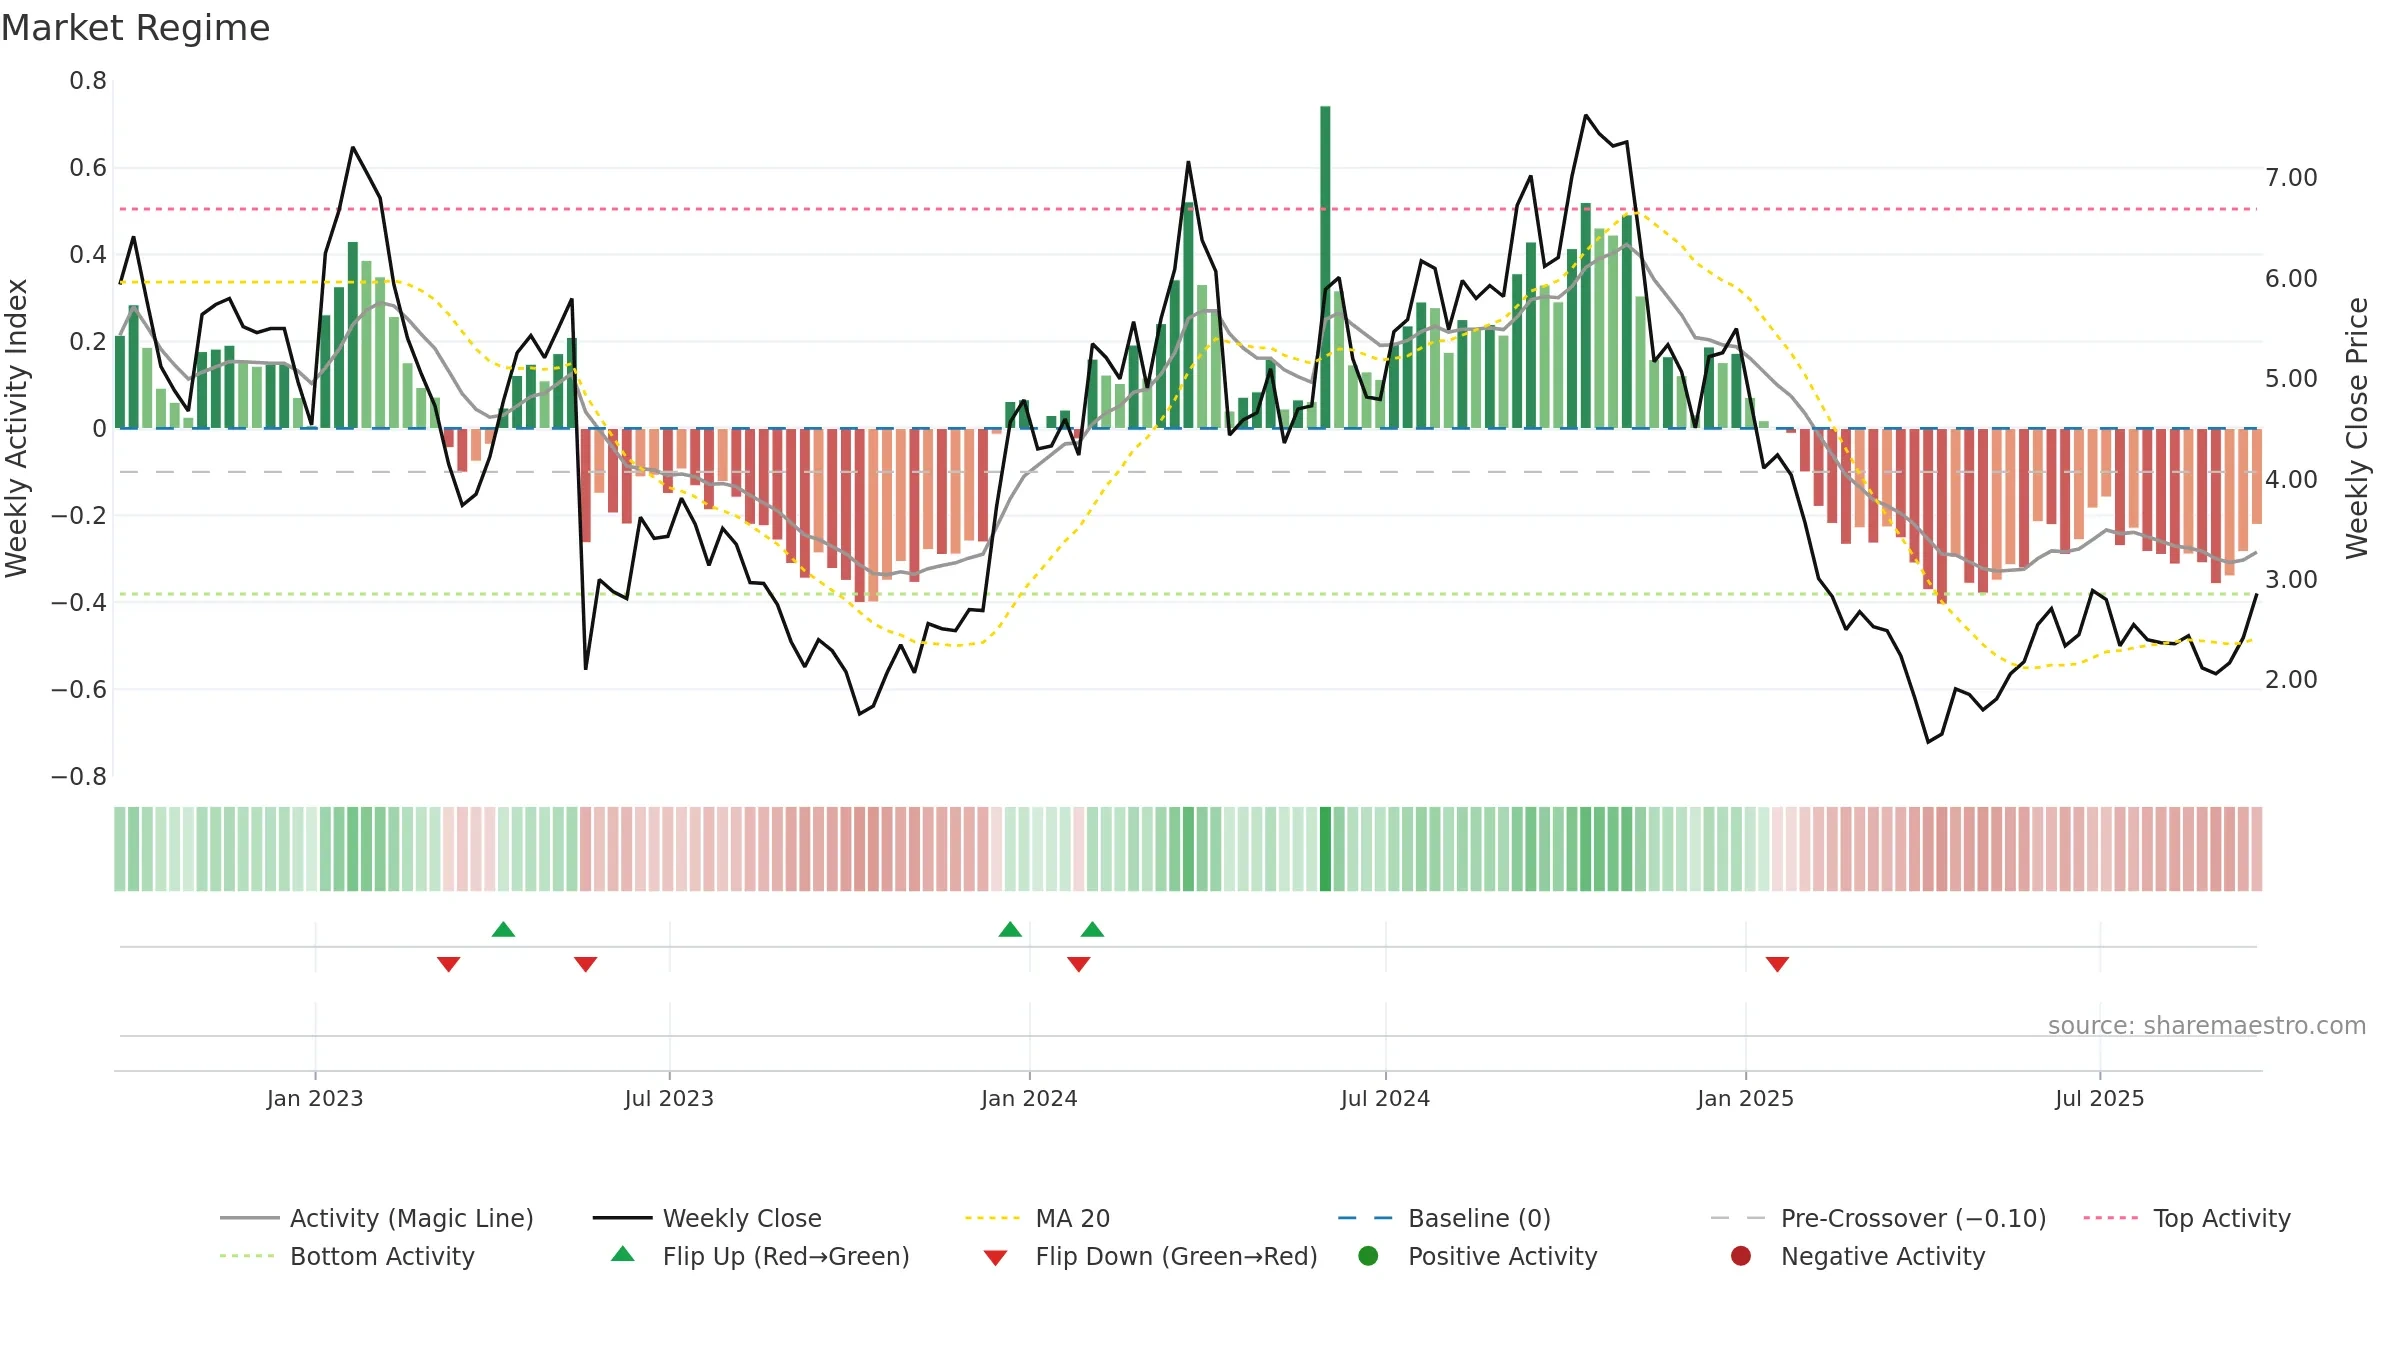
How to read this — Range-bound conditions; conviction is limited until a break or acceleration emerges.
Wait for a directional break or improving acceleration.
Conclusion
Positive setup. ★★★★☆ confidence. Price window: 20. Trend: Range / Neutral; gauge 41. In combination, liquidity confirms the move.
- Price holds above 8w & 26w averages
- Liquidity confirms the price trend
- Solid multi-week performance
- Buyers step in at depressed levels (accumulation)
Why: Price window 20.68% over 8w. Close is 17.21% above the prior-window high. Volume trend rising. Liquidity convergence with price. Trend state range / neutral. Low-regime (≤0.25) upticks 2/2 (100.0%) • Accumulating. 4–8w crossover bullish. Momentum neutral and rising.
Tip: Most metrics include a hover tooltip where they appear in the report.