Victory Capital Holdings, Inc.
VCTR NASDAQ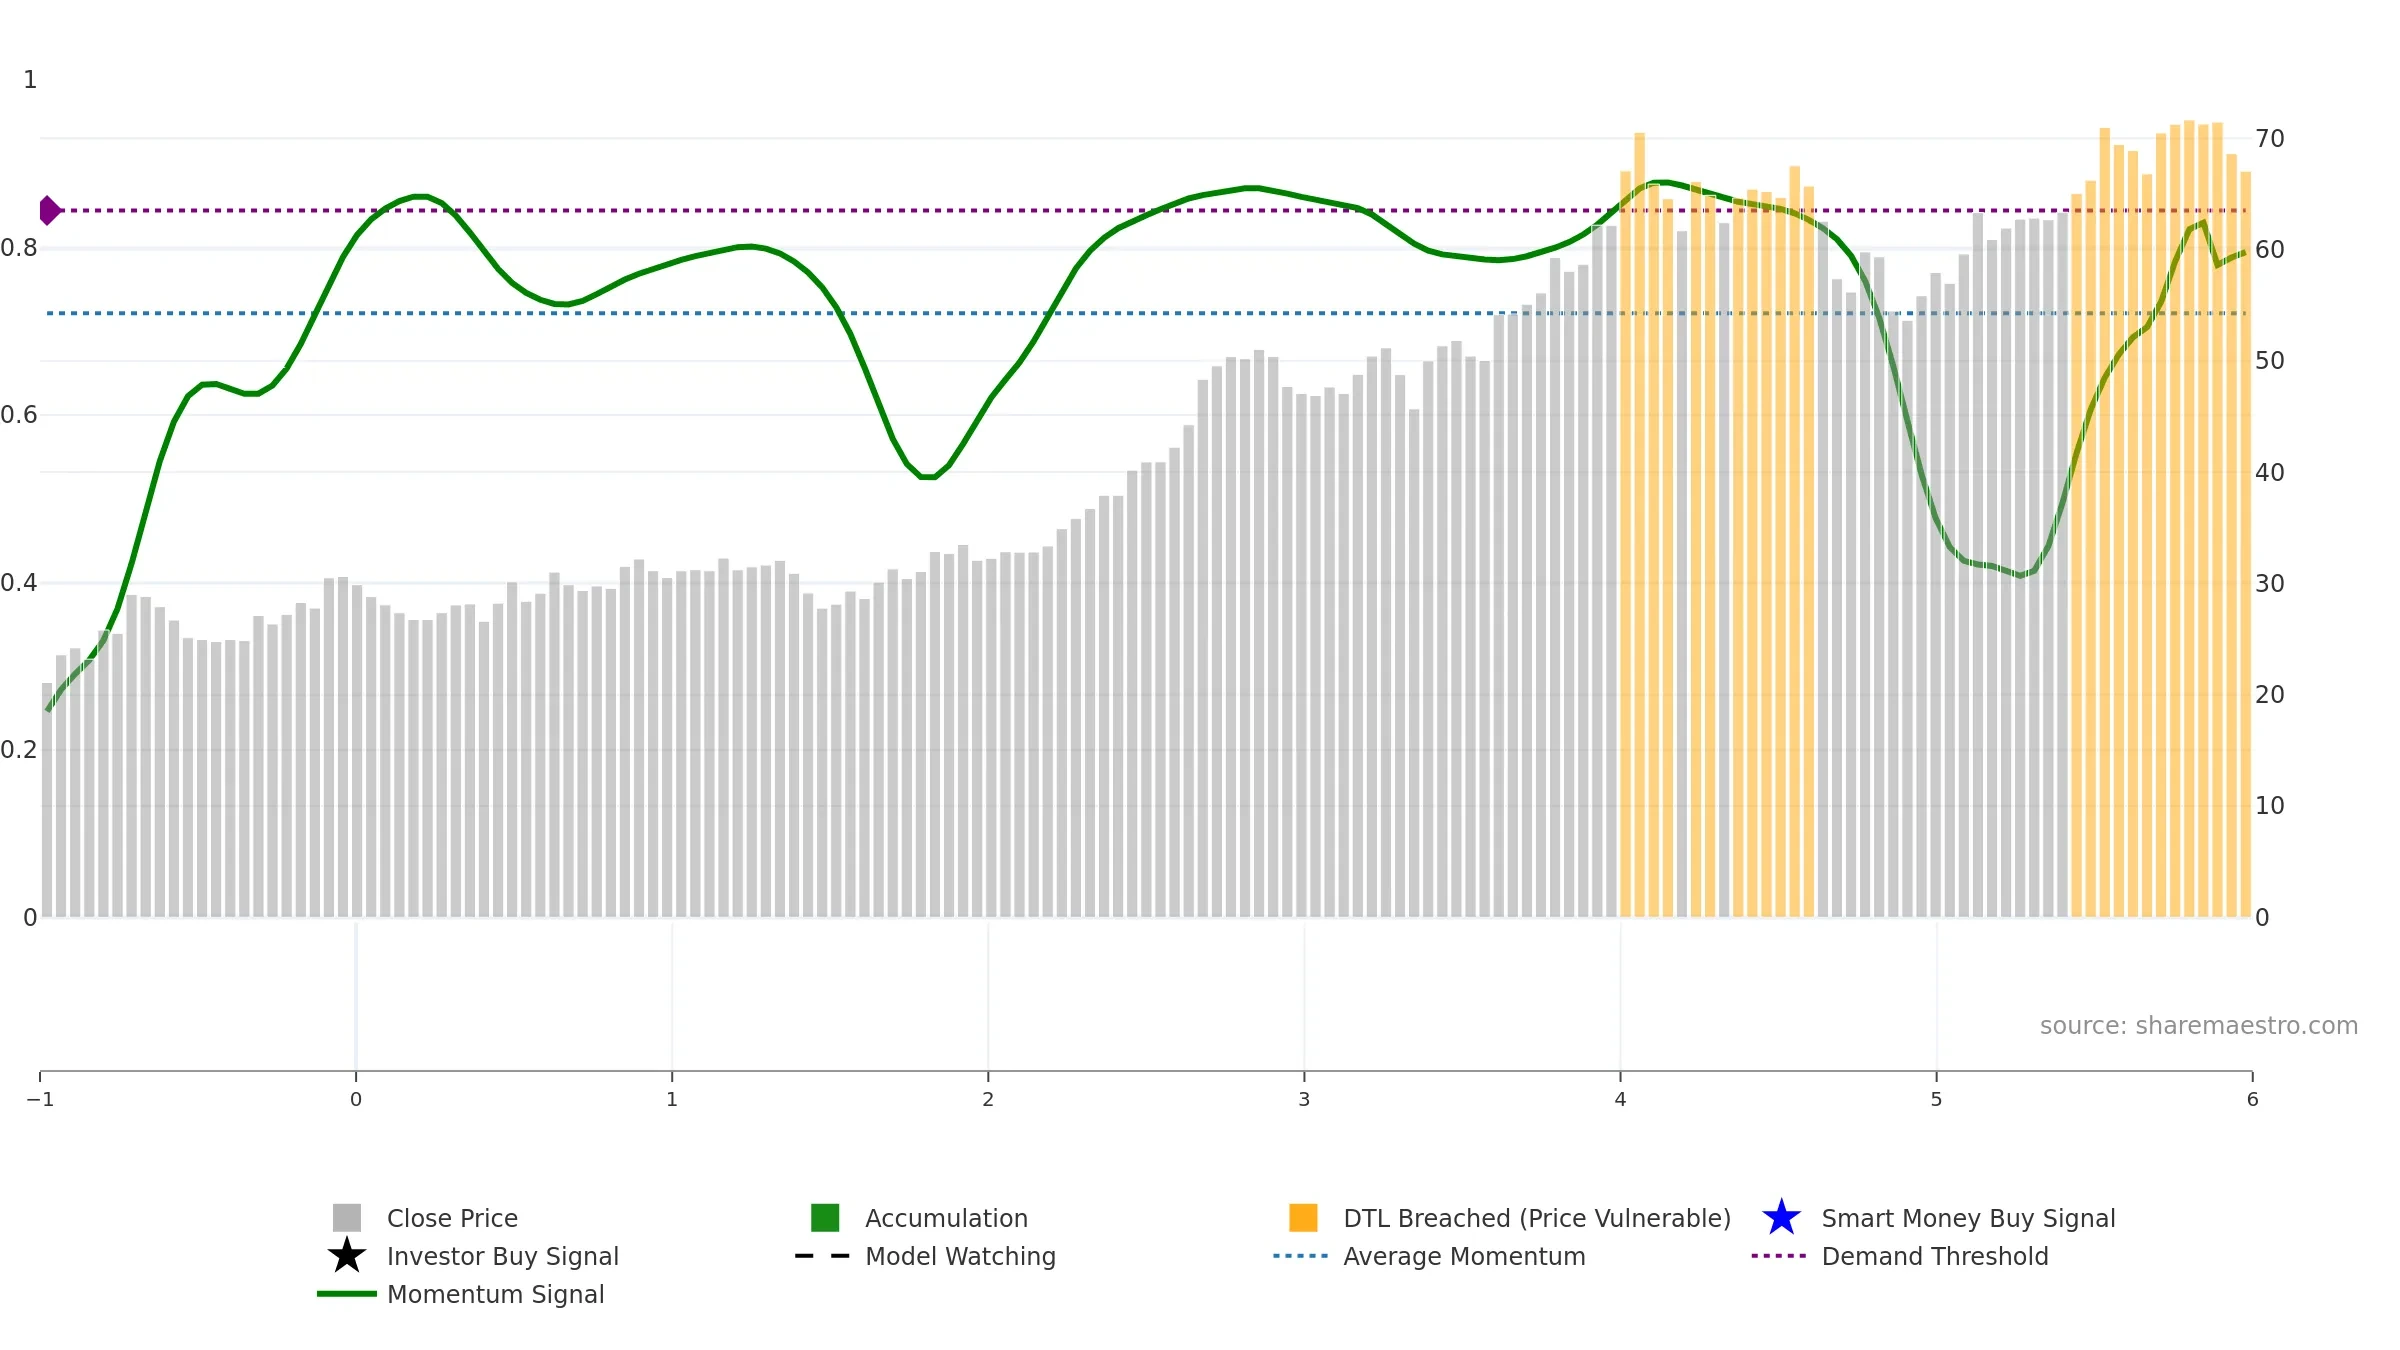
Weekly Report
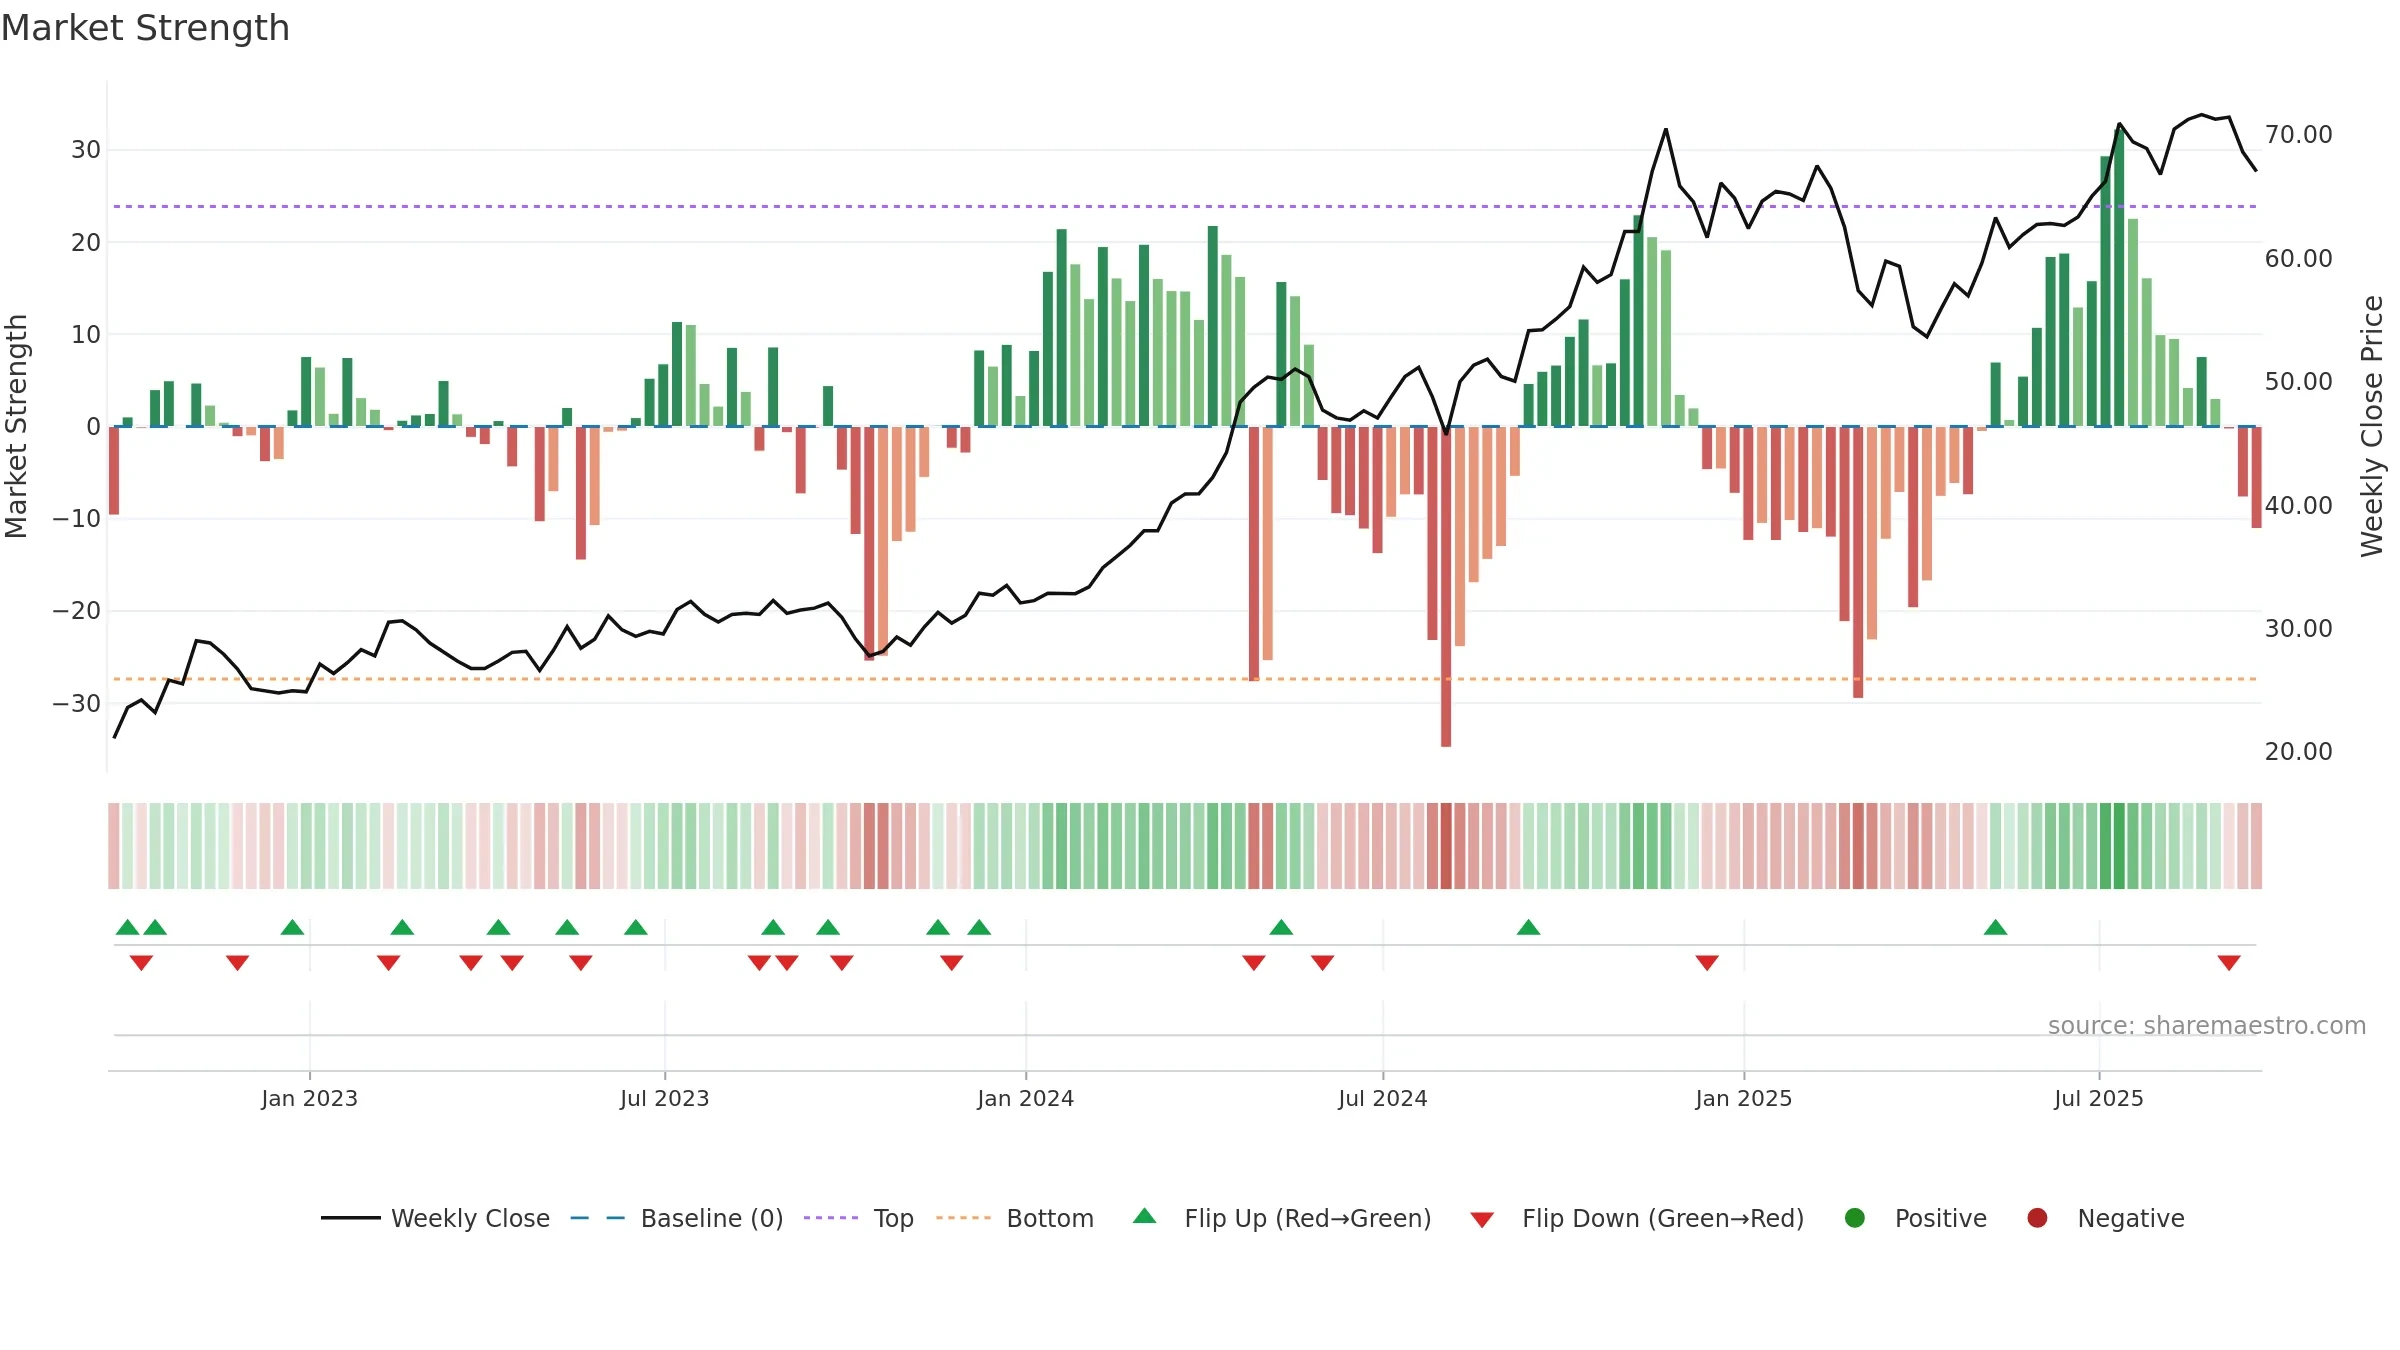
Victory Capital Holdings, Inc. closed at 67.0500 (-2.71% WoW) . Data window ends Fri, 19 Sep 2025.
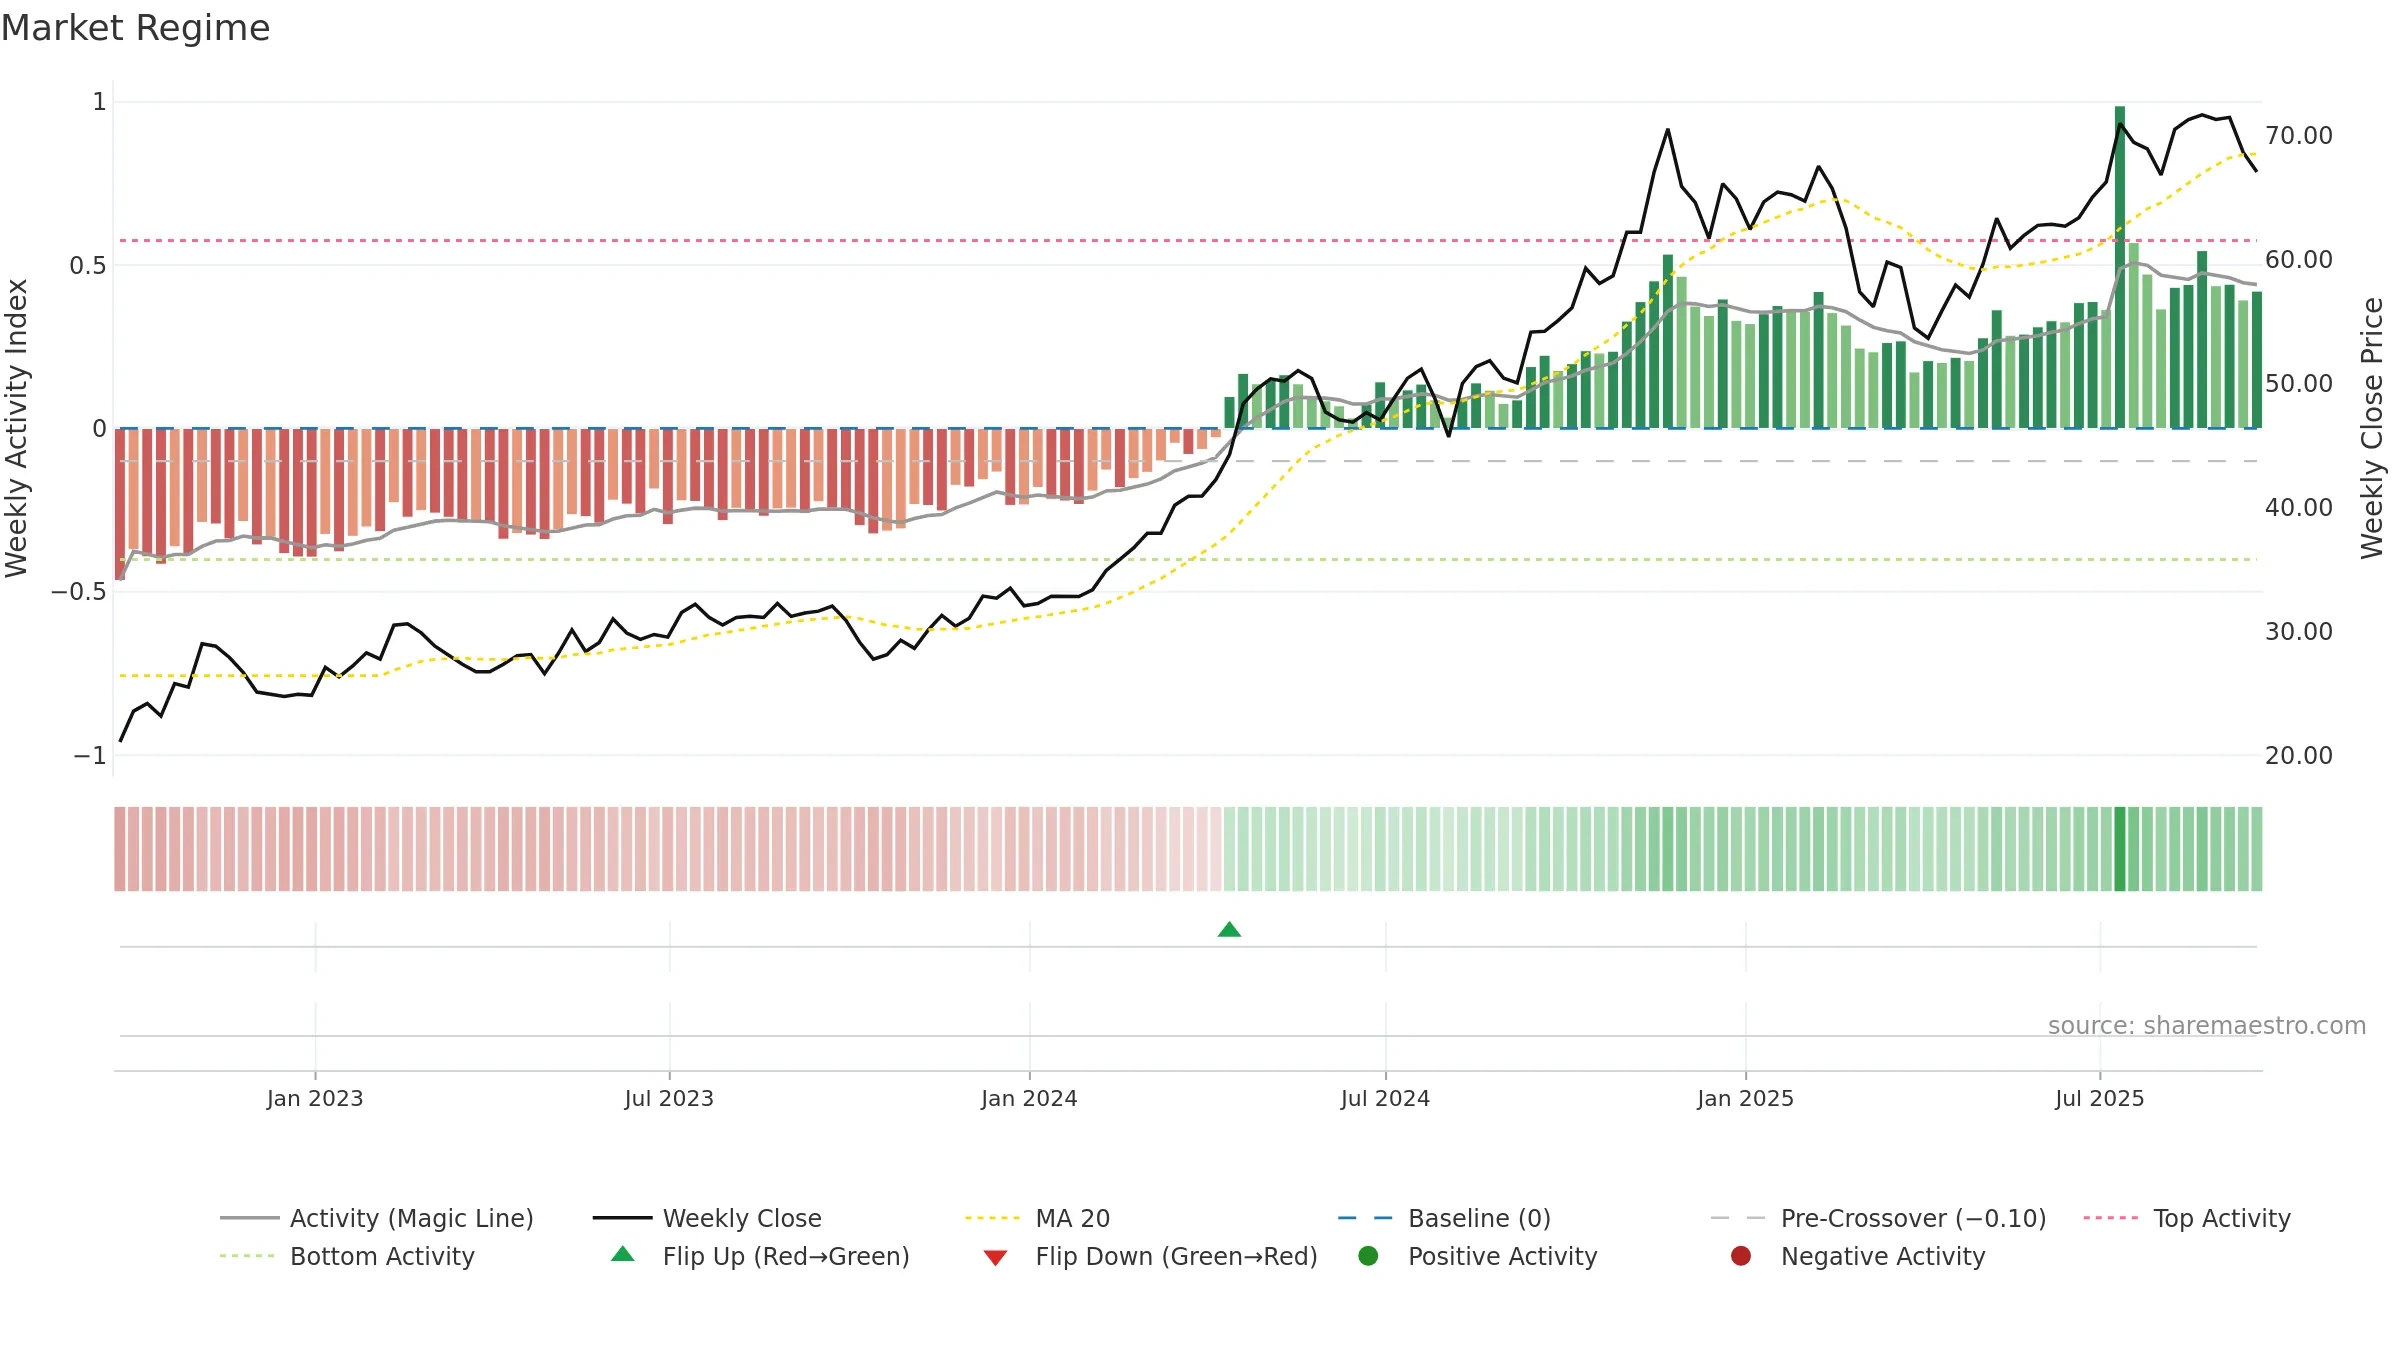
How to read this — Price slope is downward, indicating persistent supply pressure. Low weekly volatility favours steadier follow-through. Volume trend diverges from price — watch for fatigue or rotation. Distance to baseline is narrowing — reverting closer to its fair-value track. Fresh short-term downside crossover weakens near-term tone.
Down-slope argues for patience; rallies can fade sooner unless participation improves. Because liquidity isn’t confirming, prefer evidence of fresh demand before chasing moves.
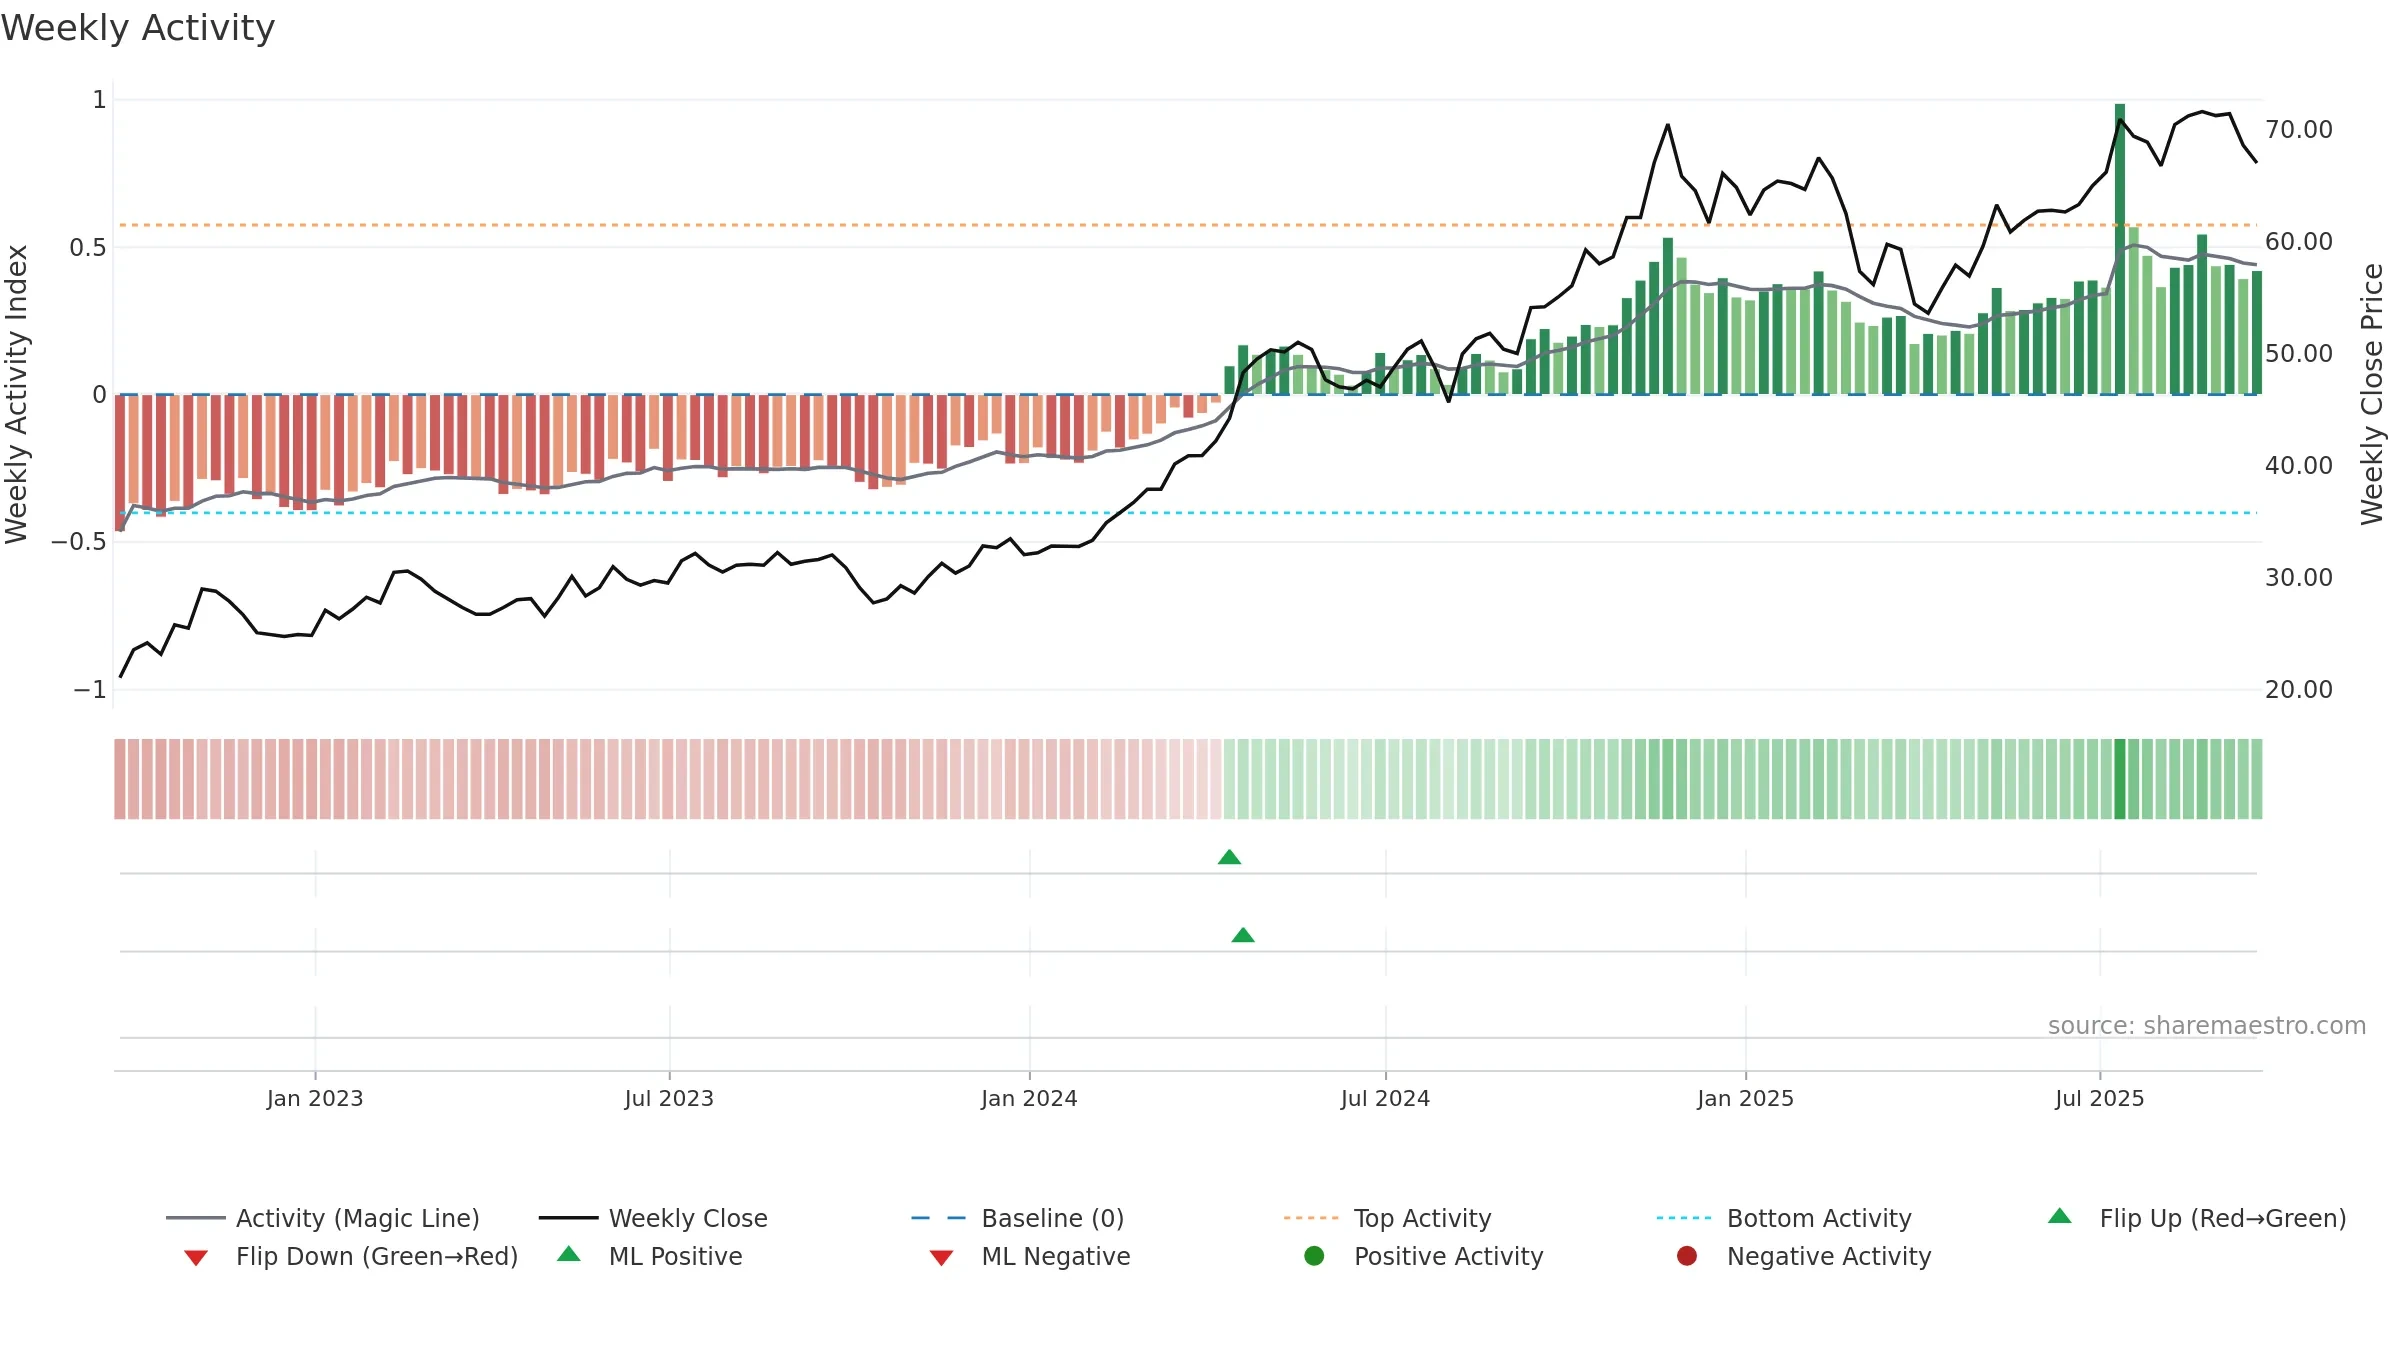
Gauge maps the trend signal to a 0–100 scale.
How to read this — Gauge is elevated but momentum is rolling over; topping risk is rising. Notable breakdown from ≥0.80 weakens trend quality.
Stay alert: protect gains or seek confirmation before adding risk.
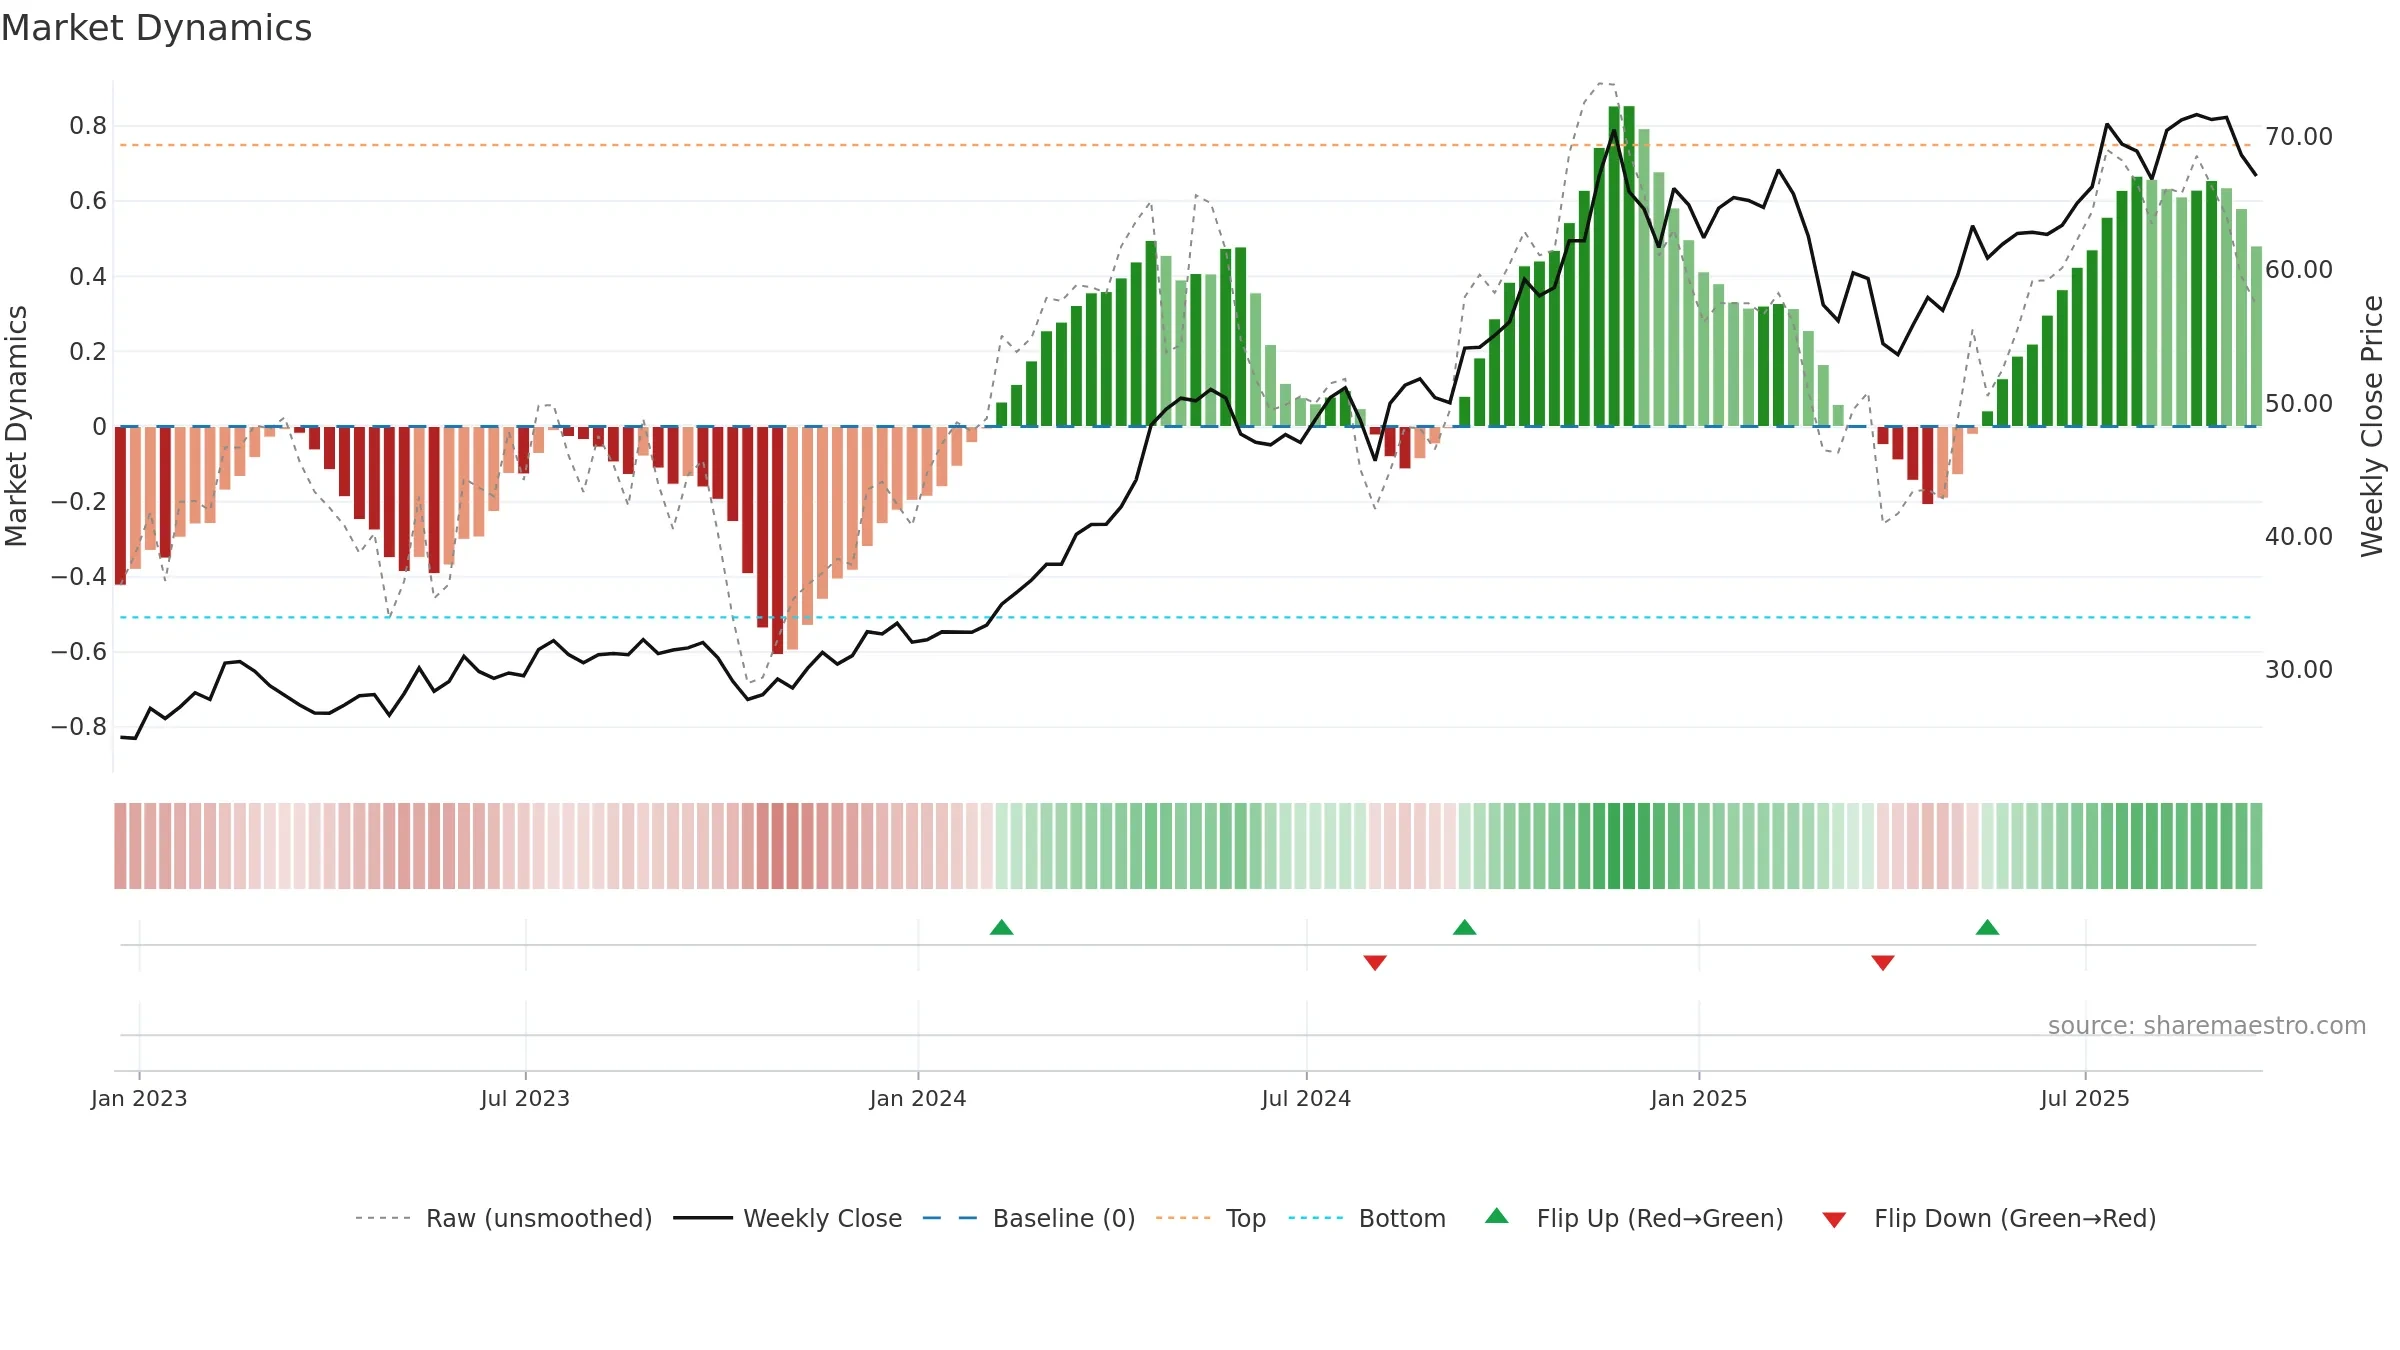
The flag is positive: favourable upside skew with supportive conditions.
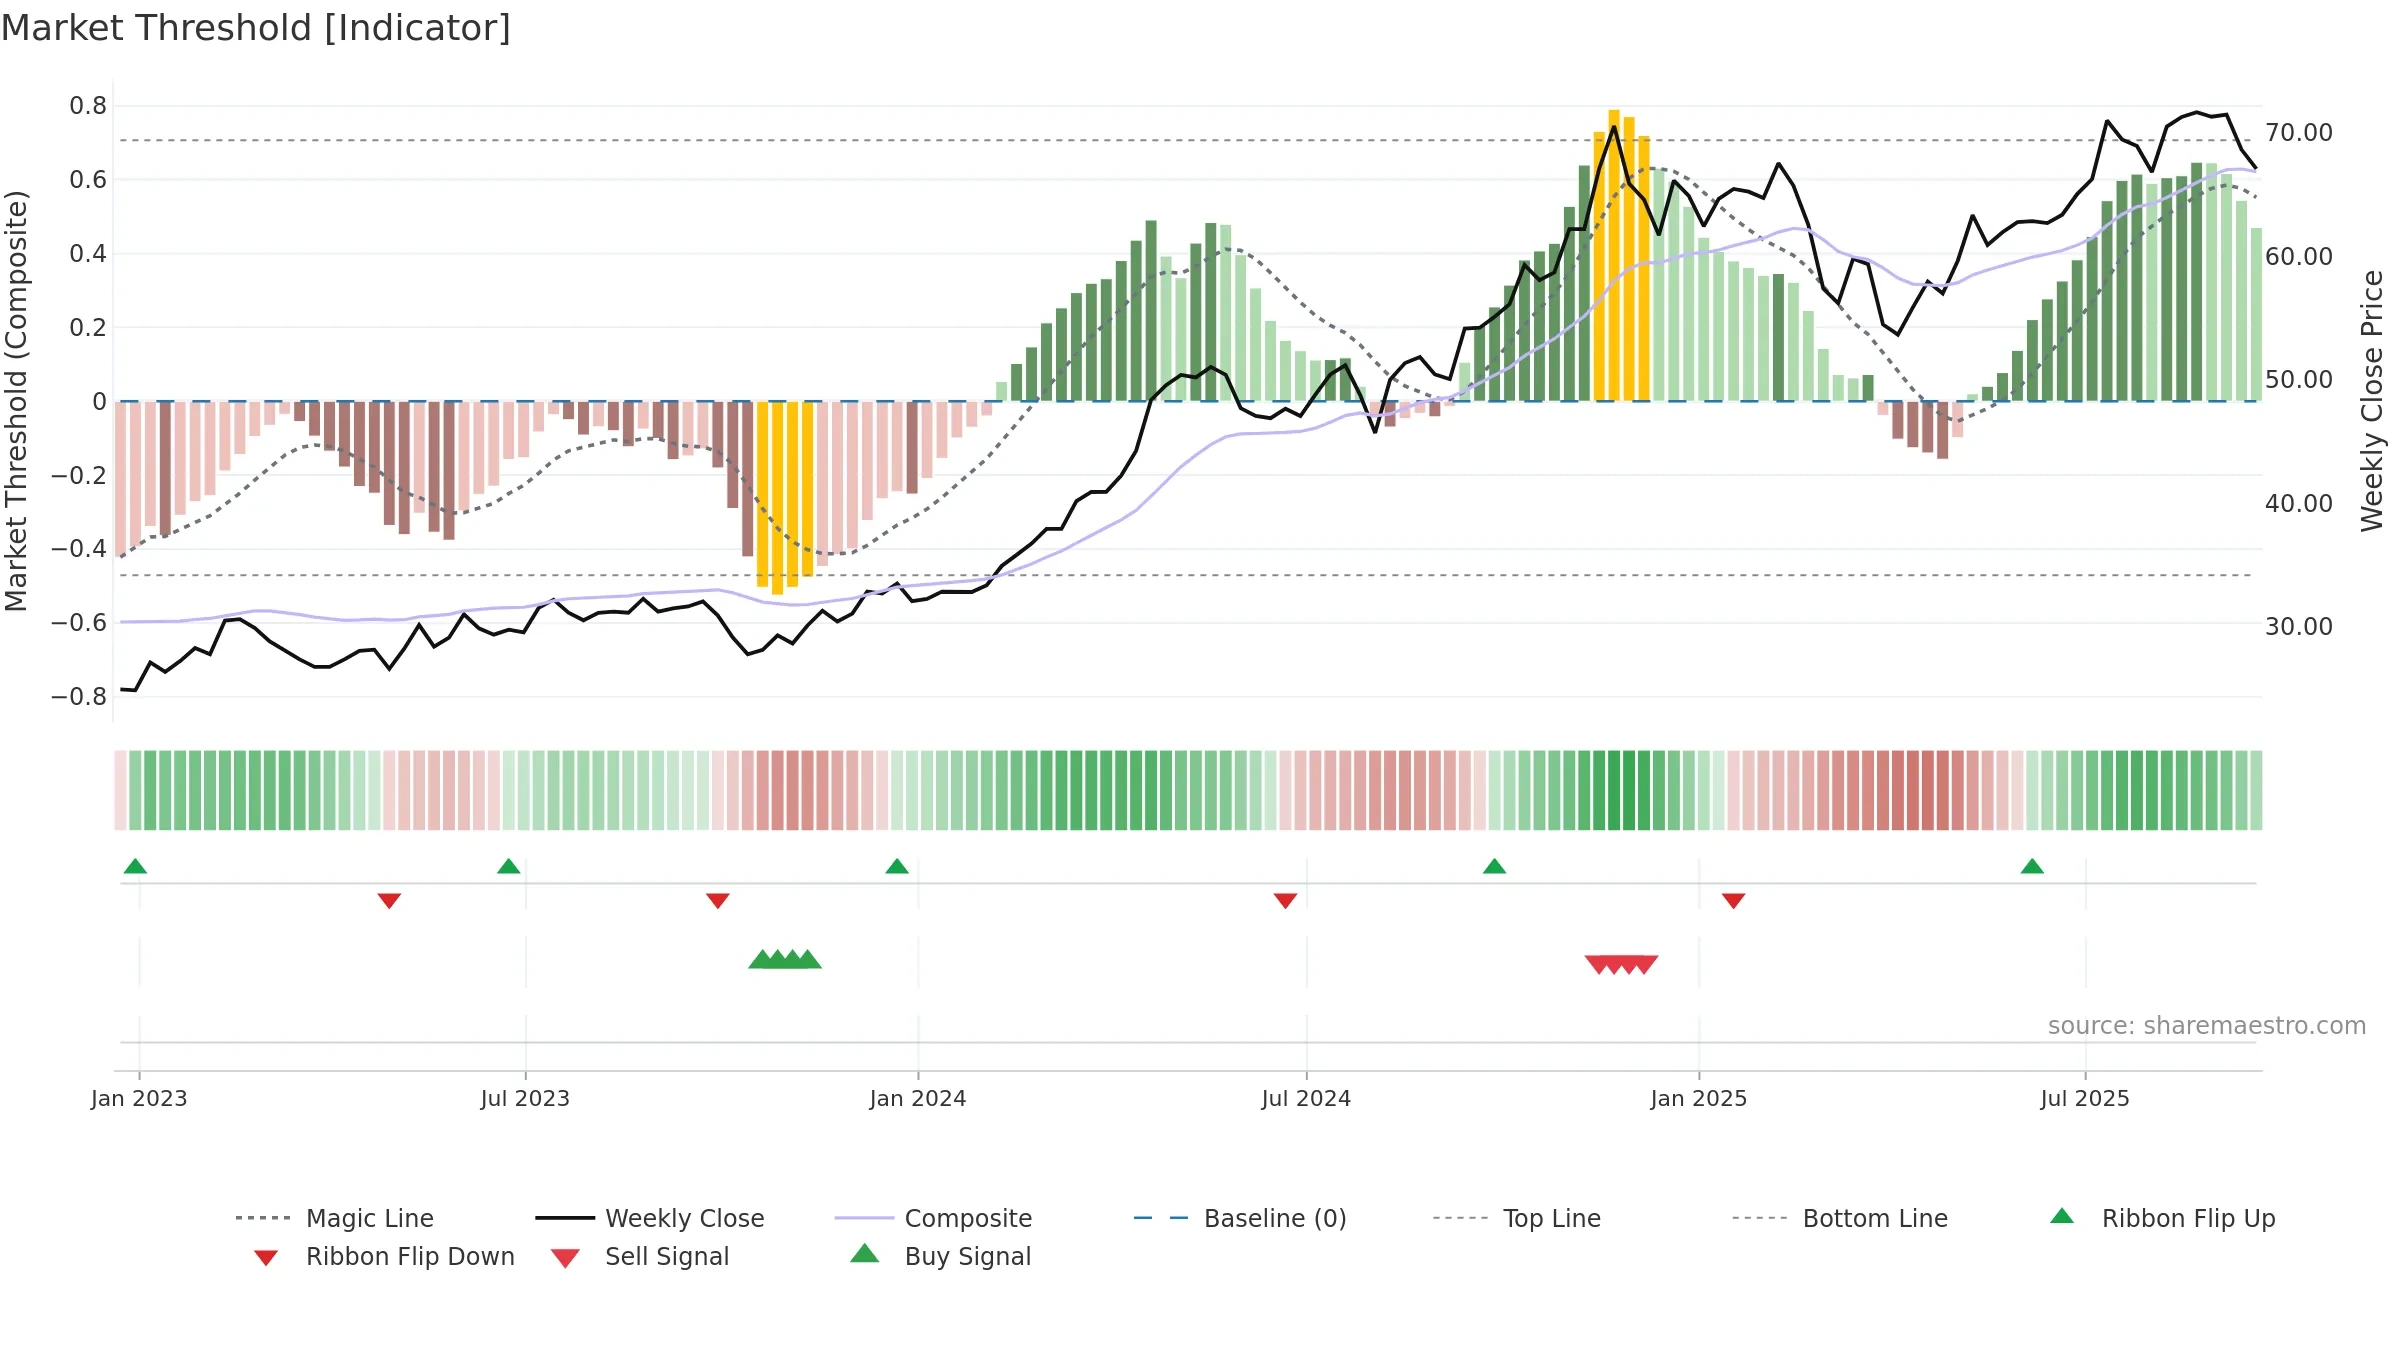
Conclusion
Negative setup. ★★☆☆☆ confidence. Price window: 0. Trend: Uptrend at Risk; gauge 79. In combination, liquidity diverges from price.
- Momentum is bullish and rising
- Low return volatility supports durability
- High-level but rolling over (topping risk)
- Price is not above key averages
- Liquidity diverges from price
- Sellers active at elevated levels (distribution)
Why: Price window 0.37% over 8w. Close is -6.42% below the prior-window high. Return volatility 1.84%. Volume trend rising. Liquidity divergence with price. Trend state uptrend at risk. High-regime (0.80–1.00) downticks 1/2 (50.0%) • Accumulating. 4–8w crossover bearish. Momentum bullish and rising. Valuation stance positive.
Tip: Most metrics include a hover tooltip where they appear in the report.