Seabridge Gold Inc.
SA NYSE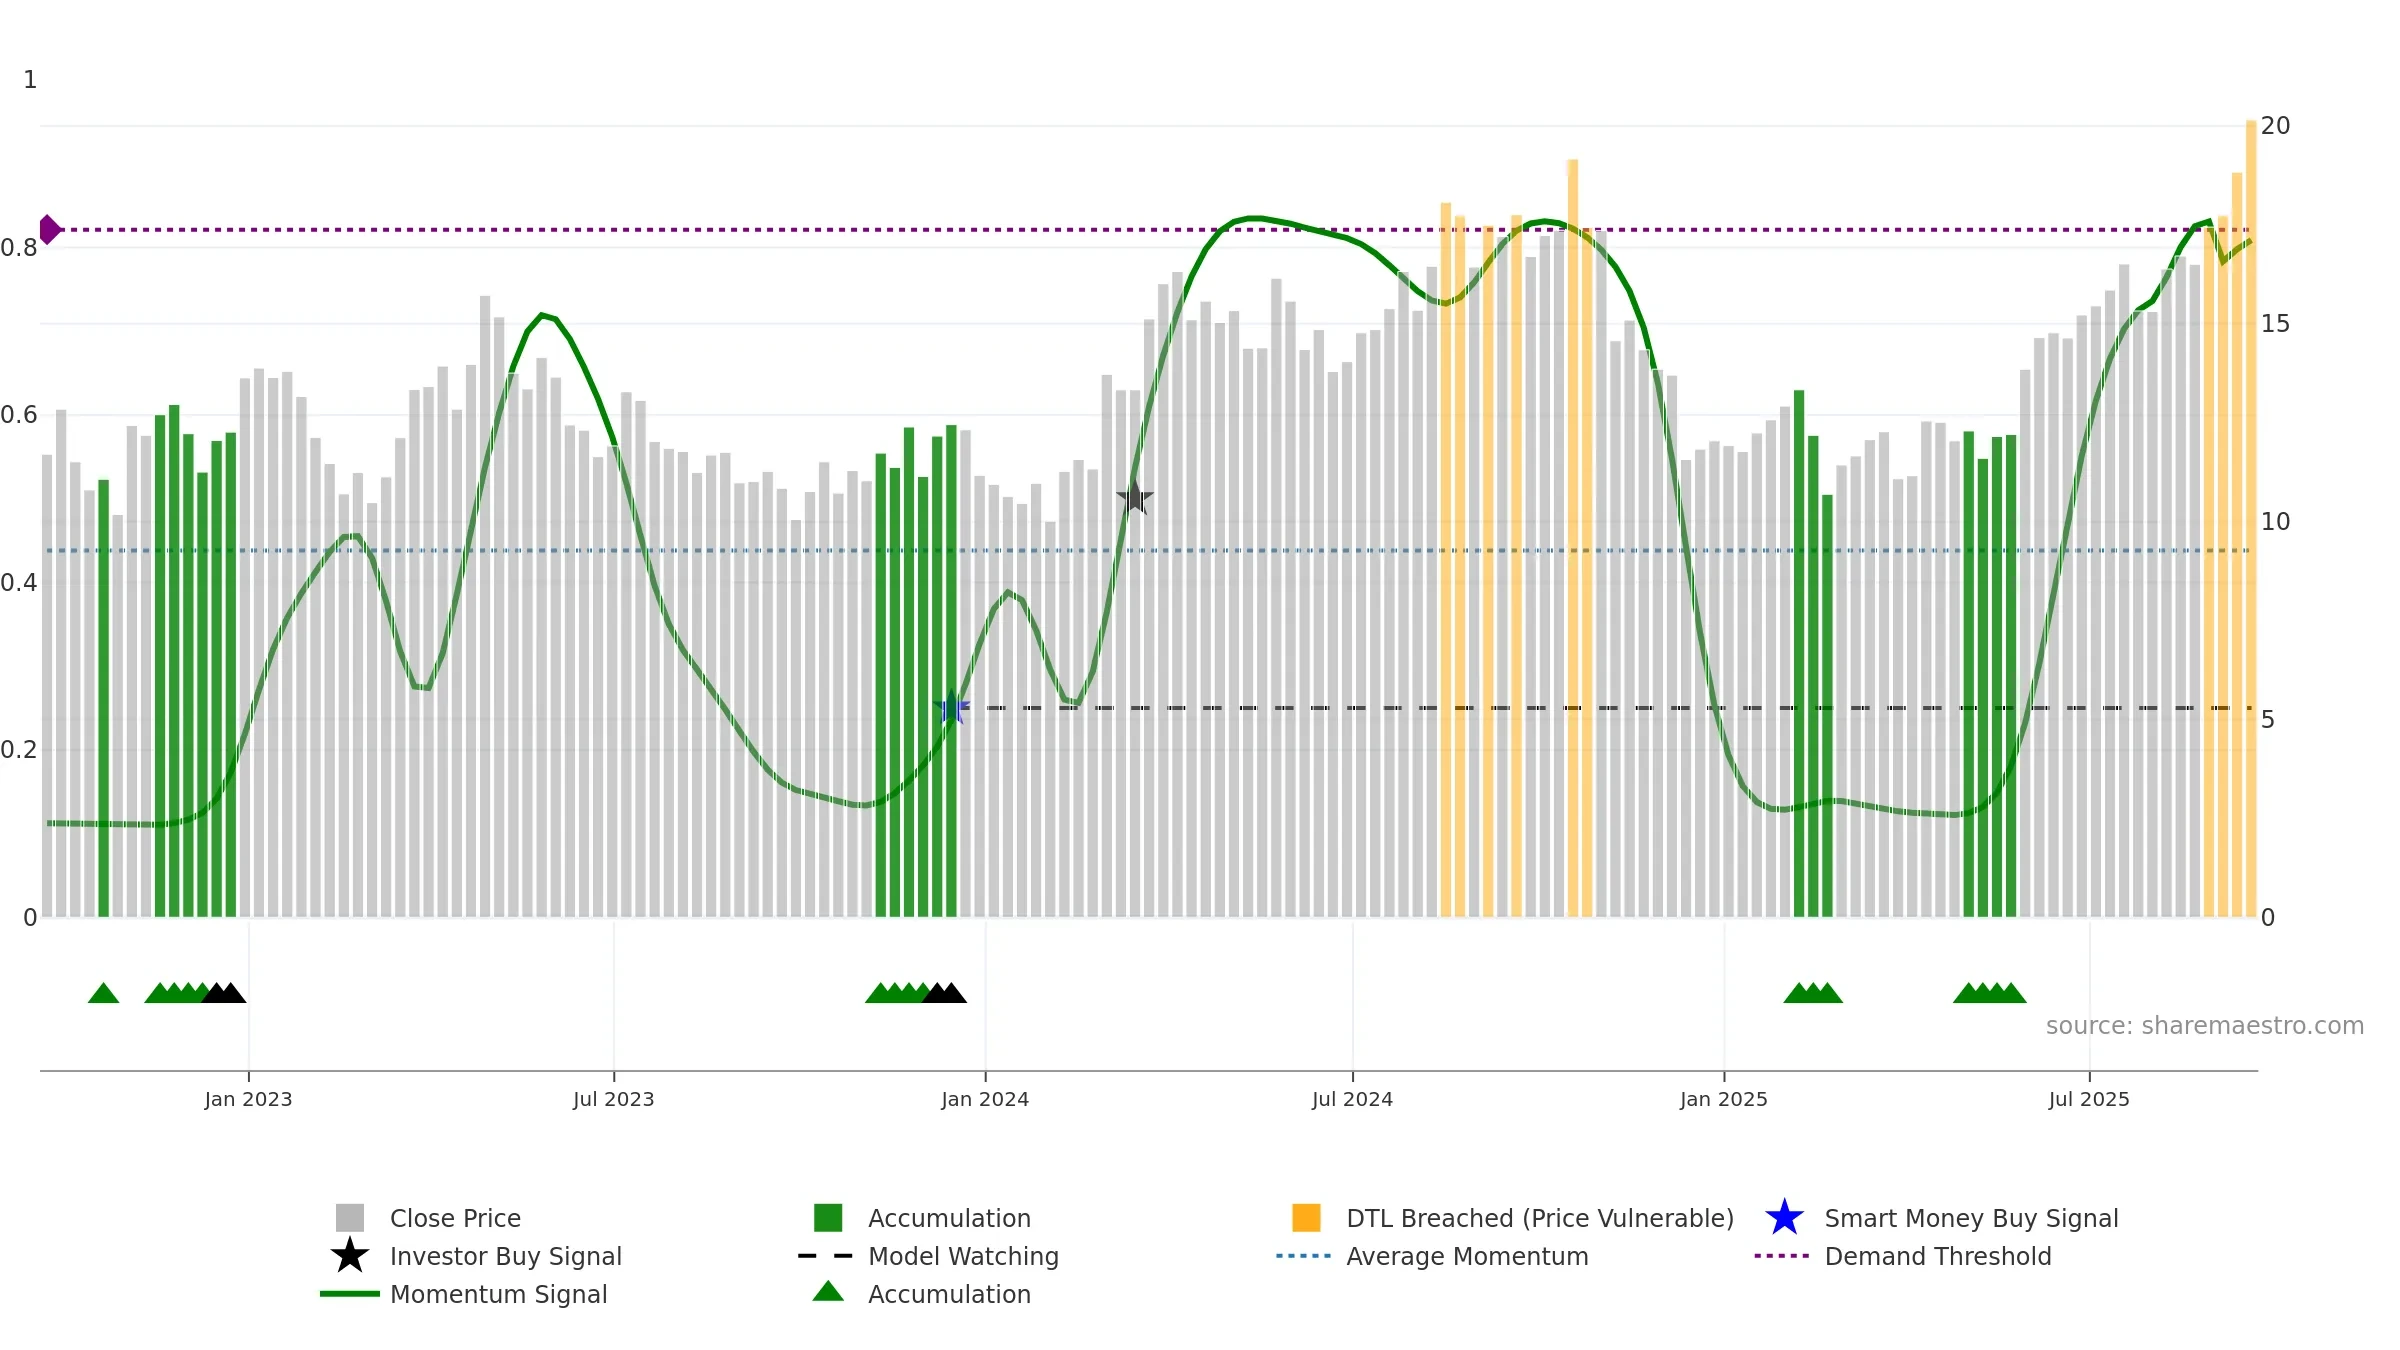
Weekly Report
Seabridge Gold Inc. closed at 20.1500 (4.78% WoW) . Data window ends Fri, 19 Sep 2025.
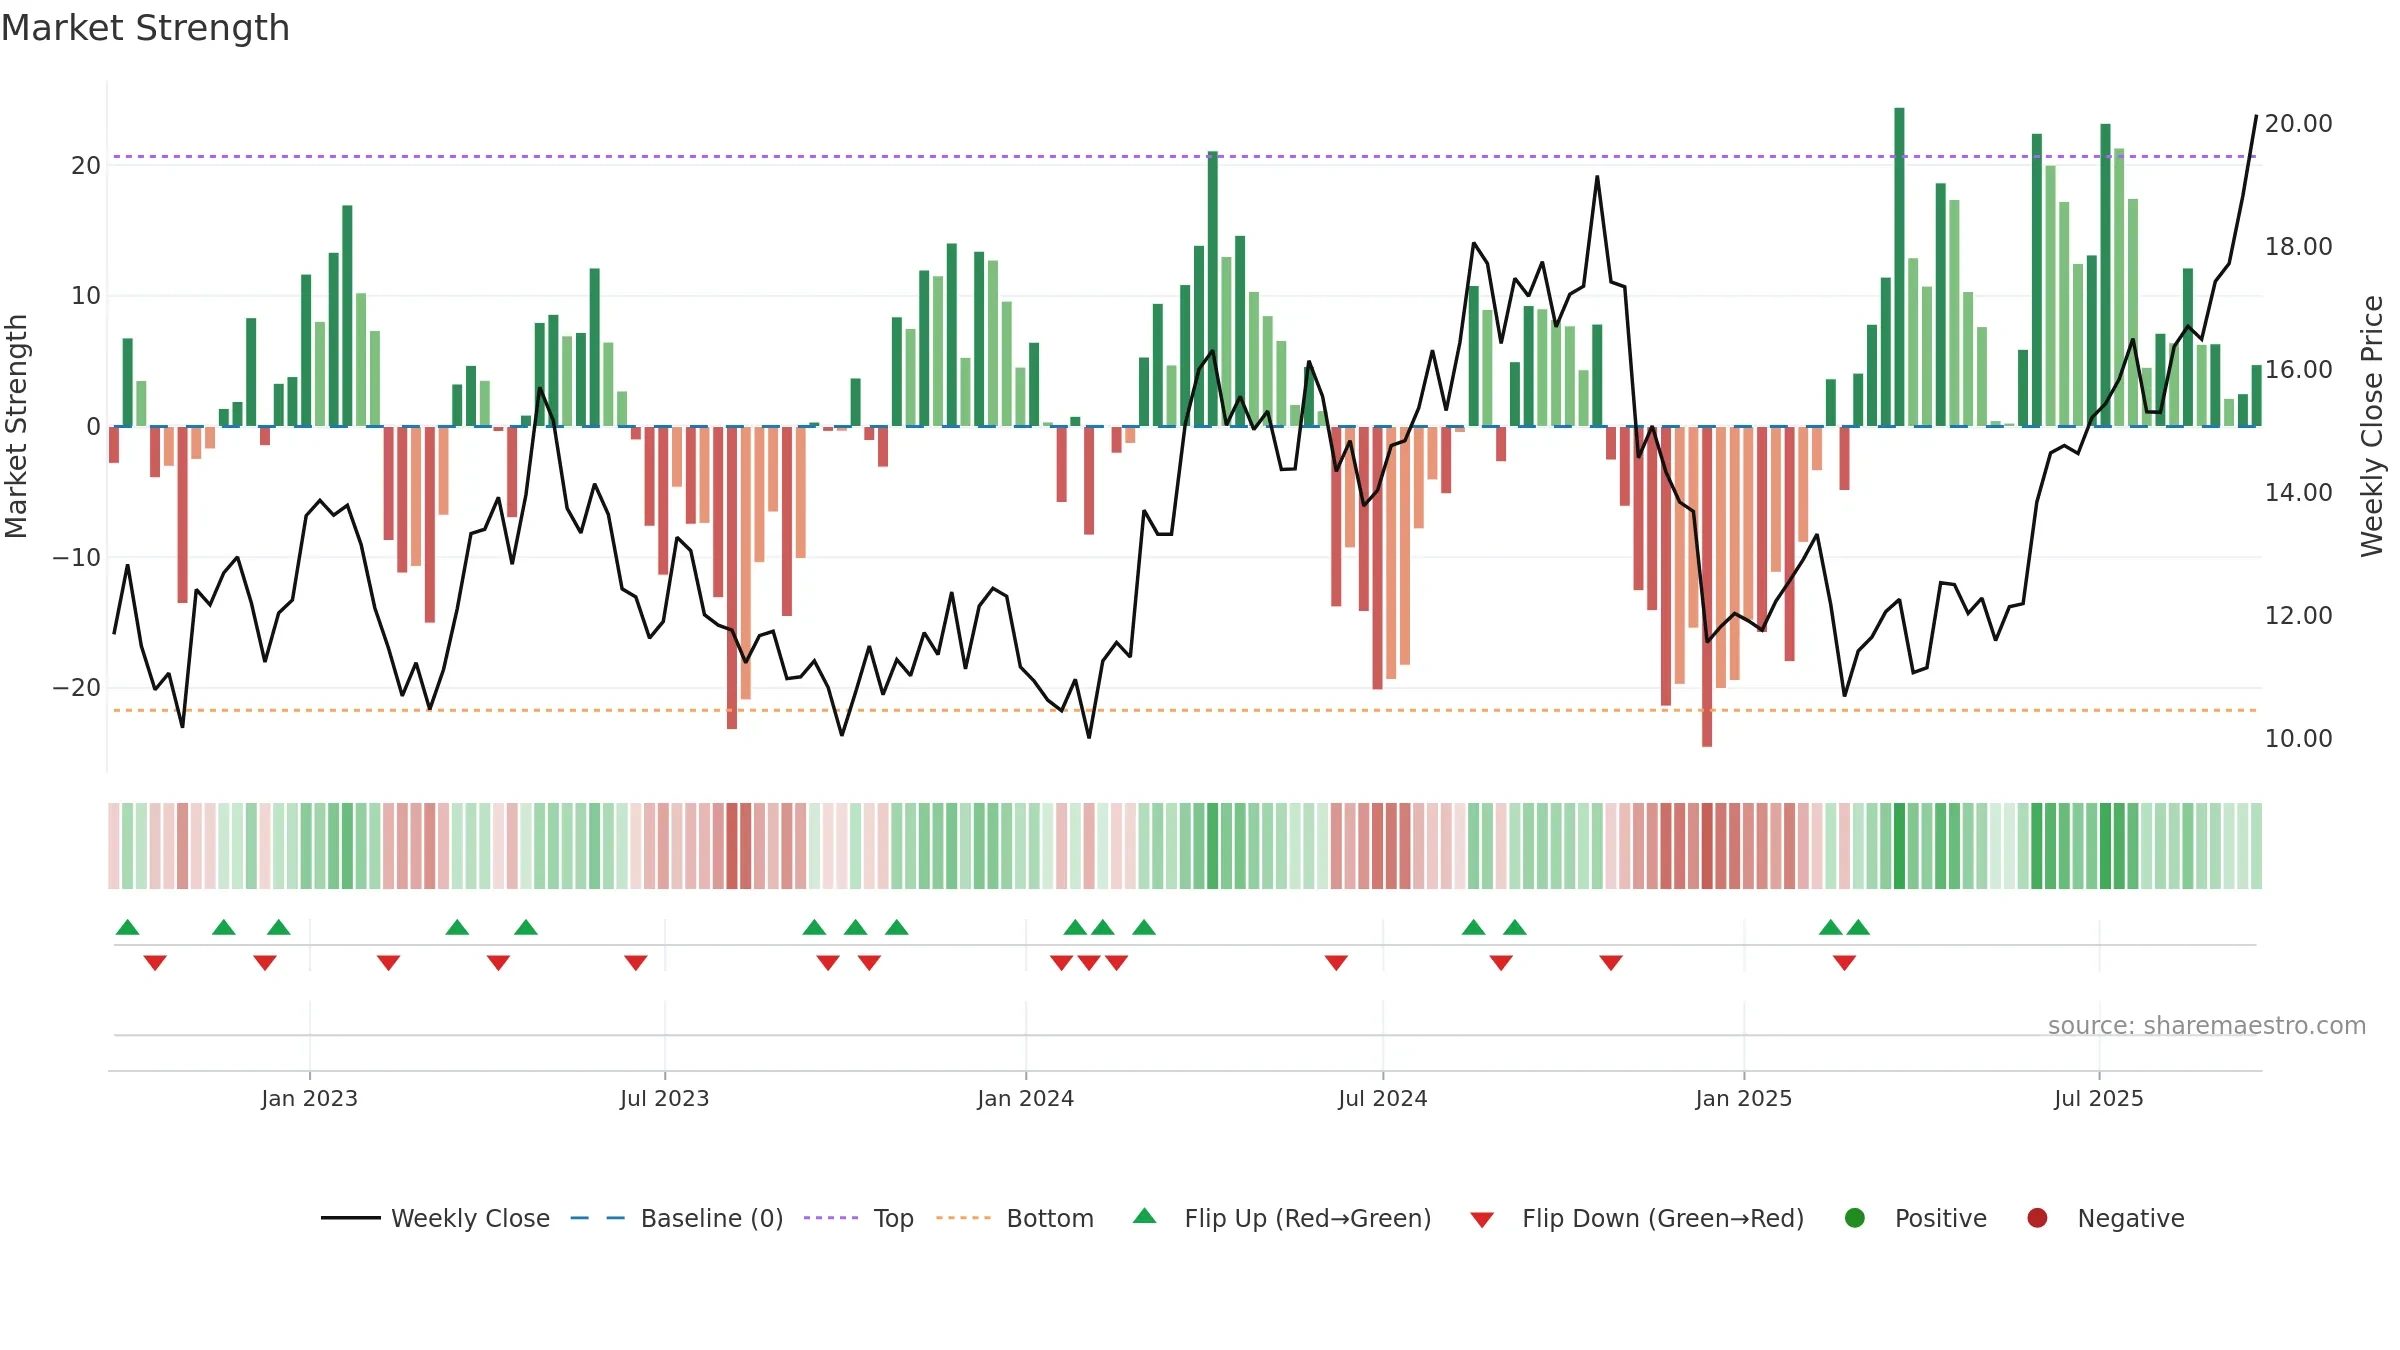
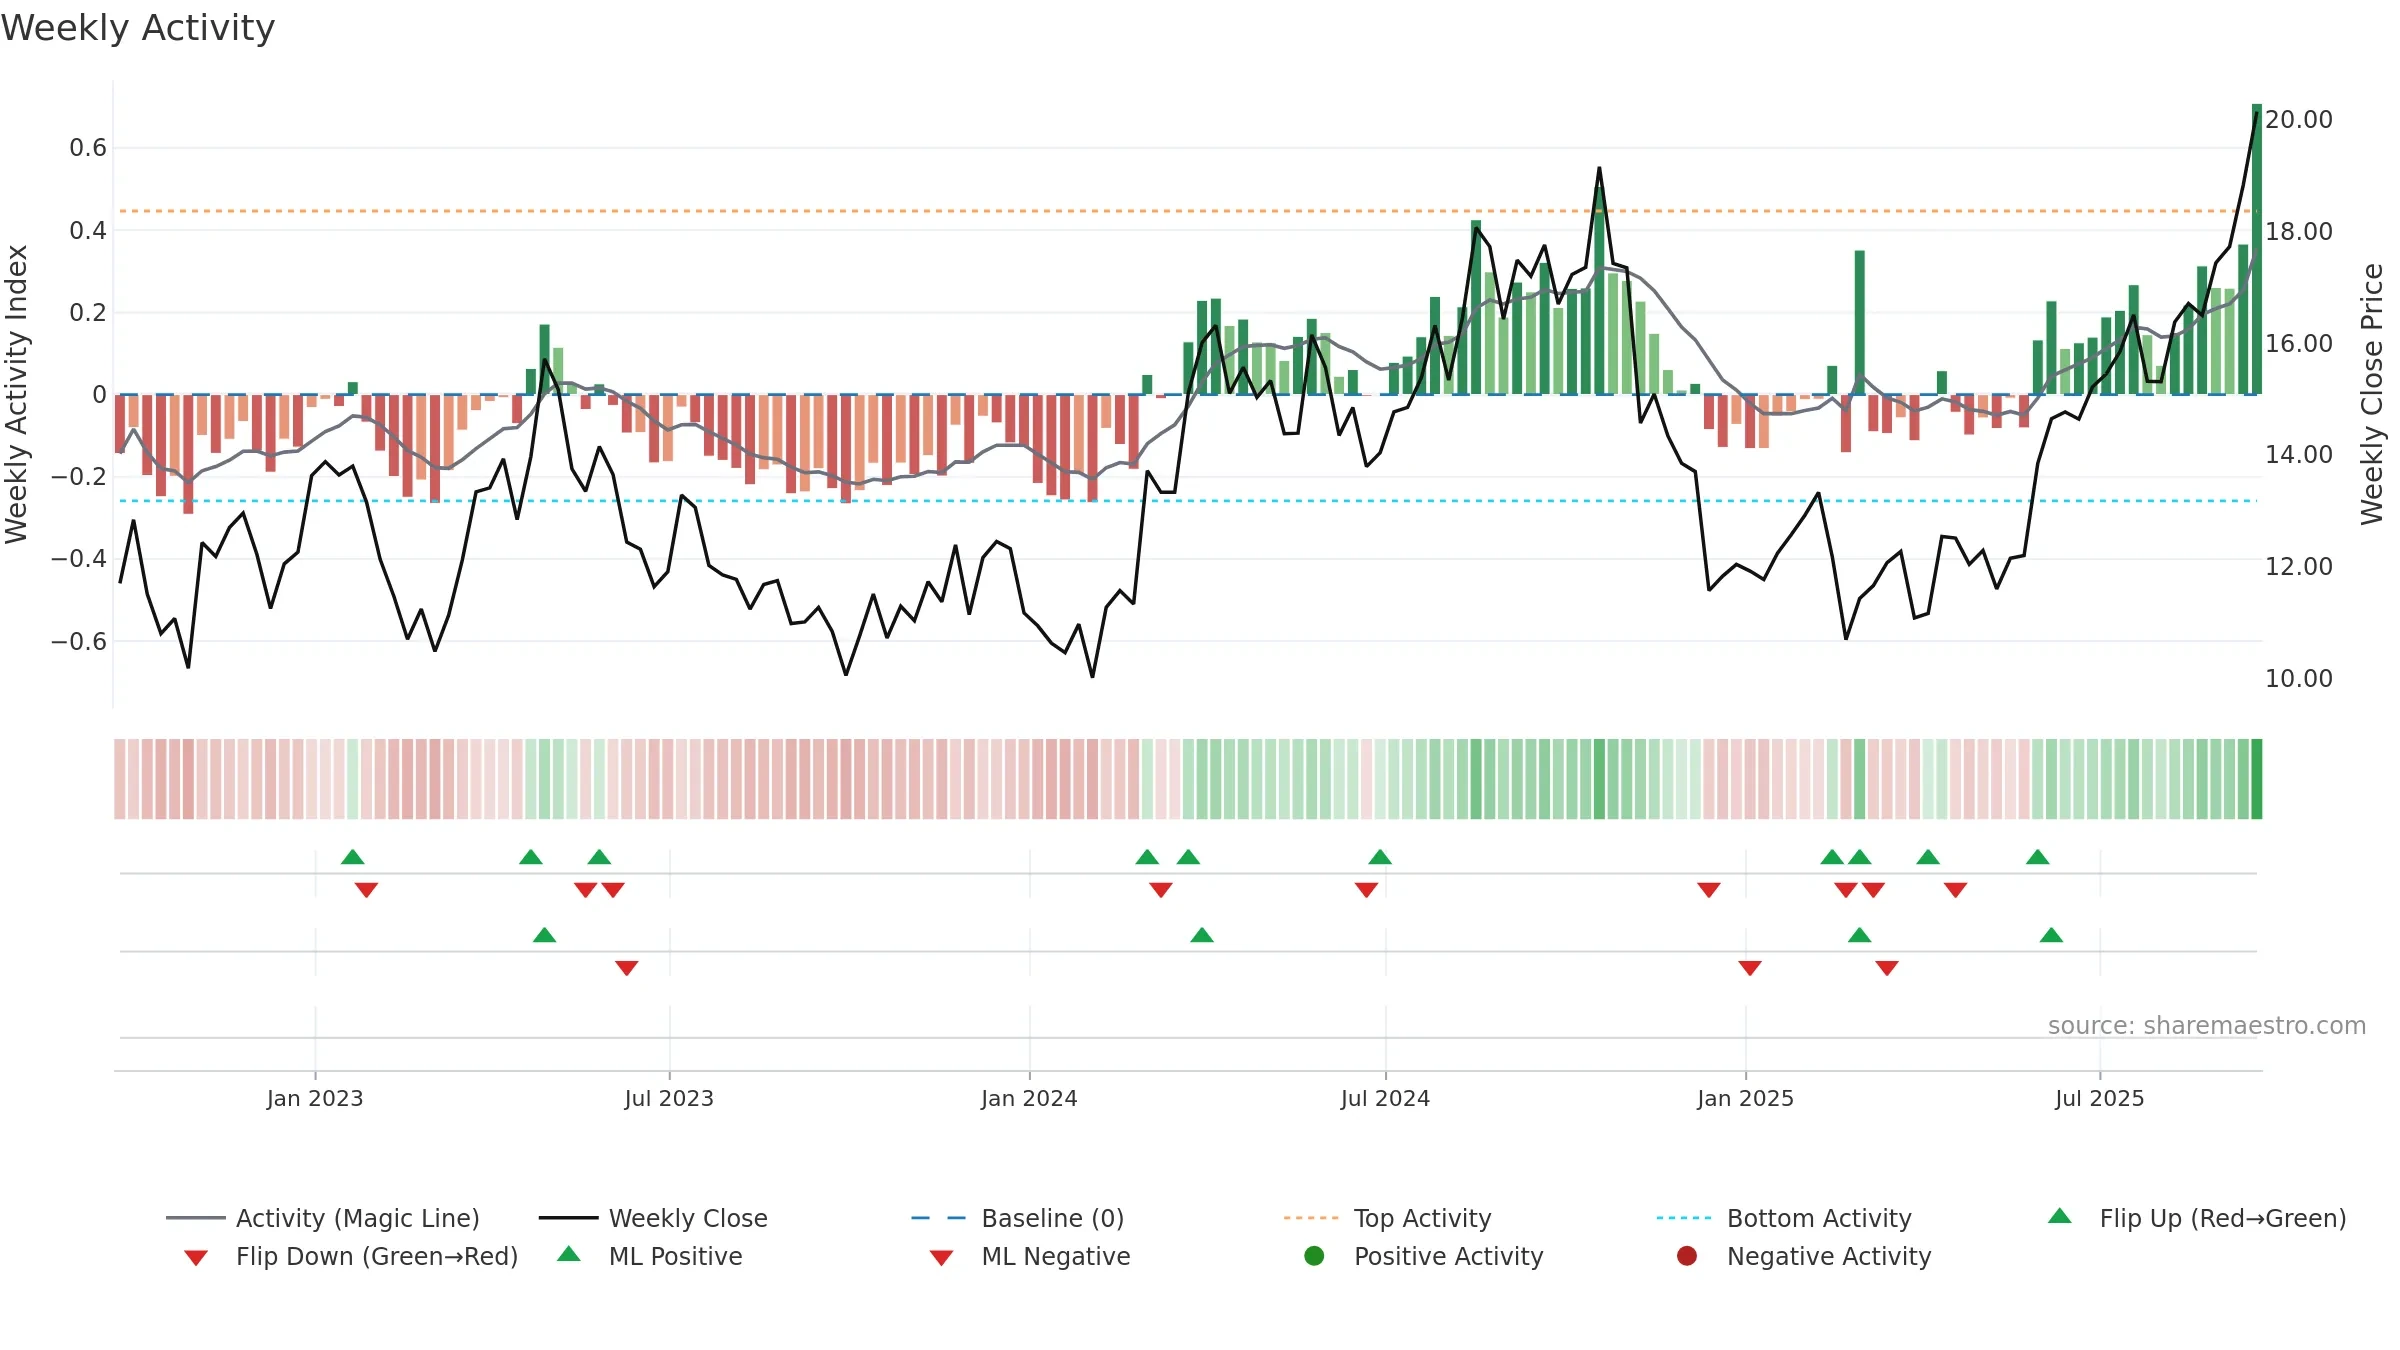
How to read this — Price slope is upward, indicating persistent buying over the window. Volume and price are moving in the same direction — a constructive confirmation. Returns are positively correlated with volume — strength tends to arrive on higher activity. Price is stretched above its baseline; consolidation risk rises if activity fades. Constructive MA stack supports the up-drift; pullbacks may find support at the 8–13 week region. Price holds above key averages, indicating constructive participation.
Up-slope supports buying interest; pullbacks may be contained if activity stays firm.
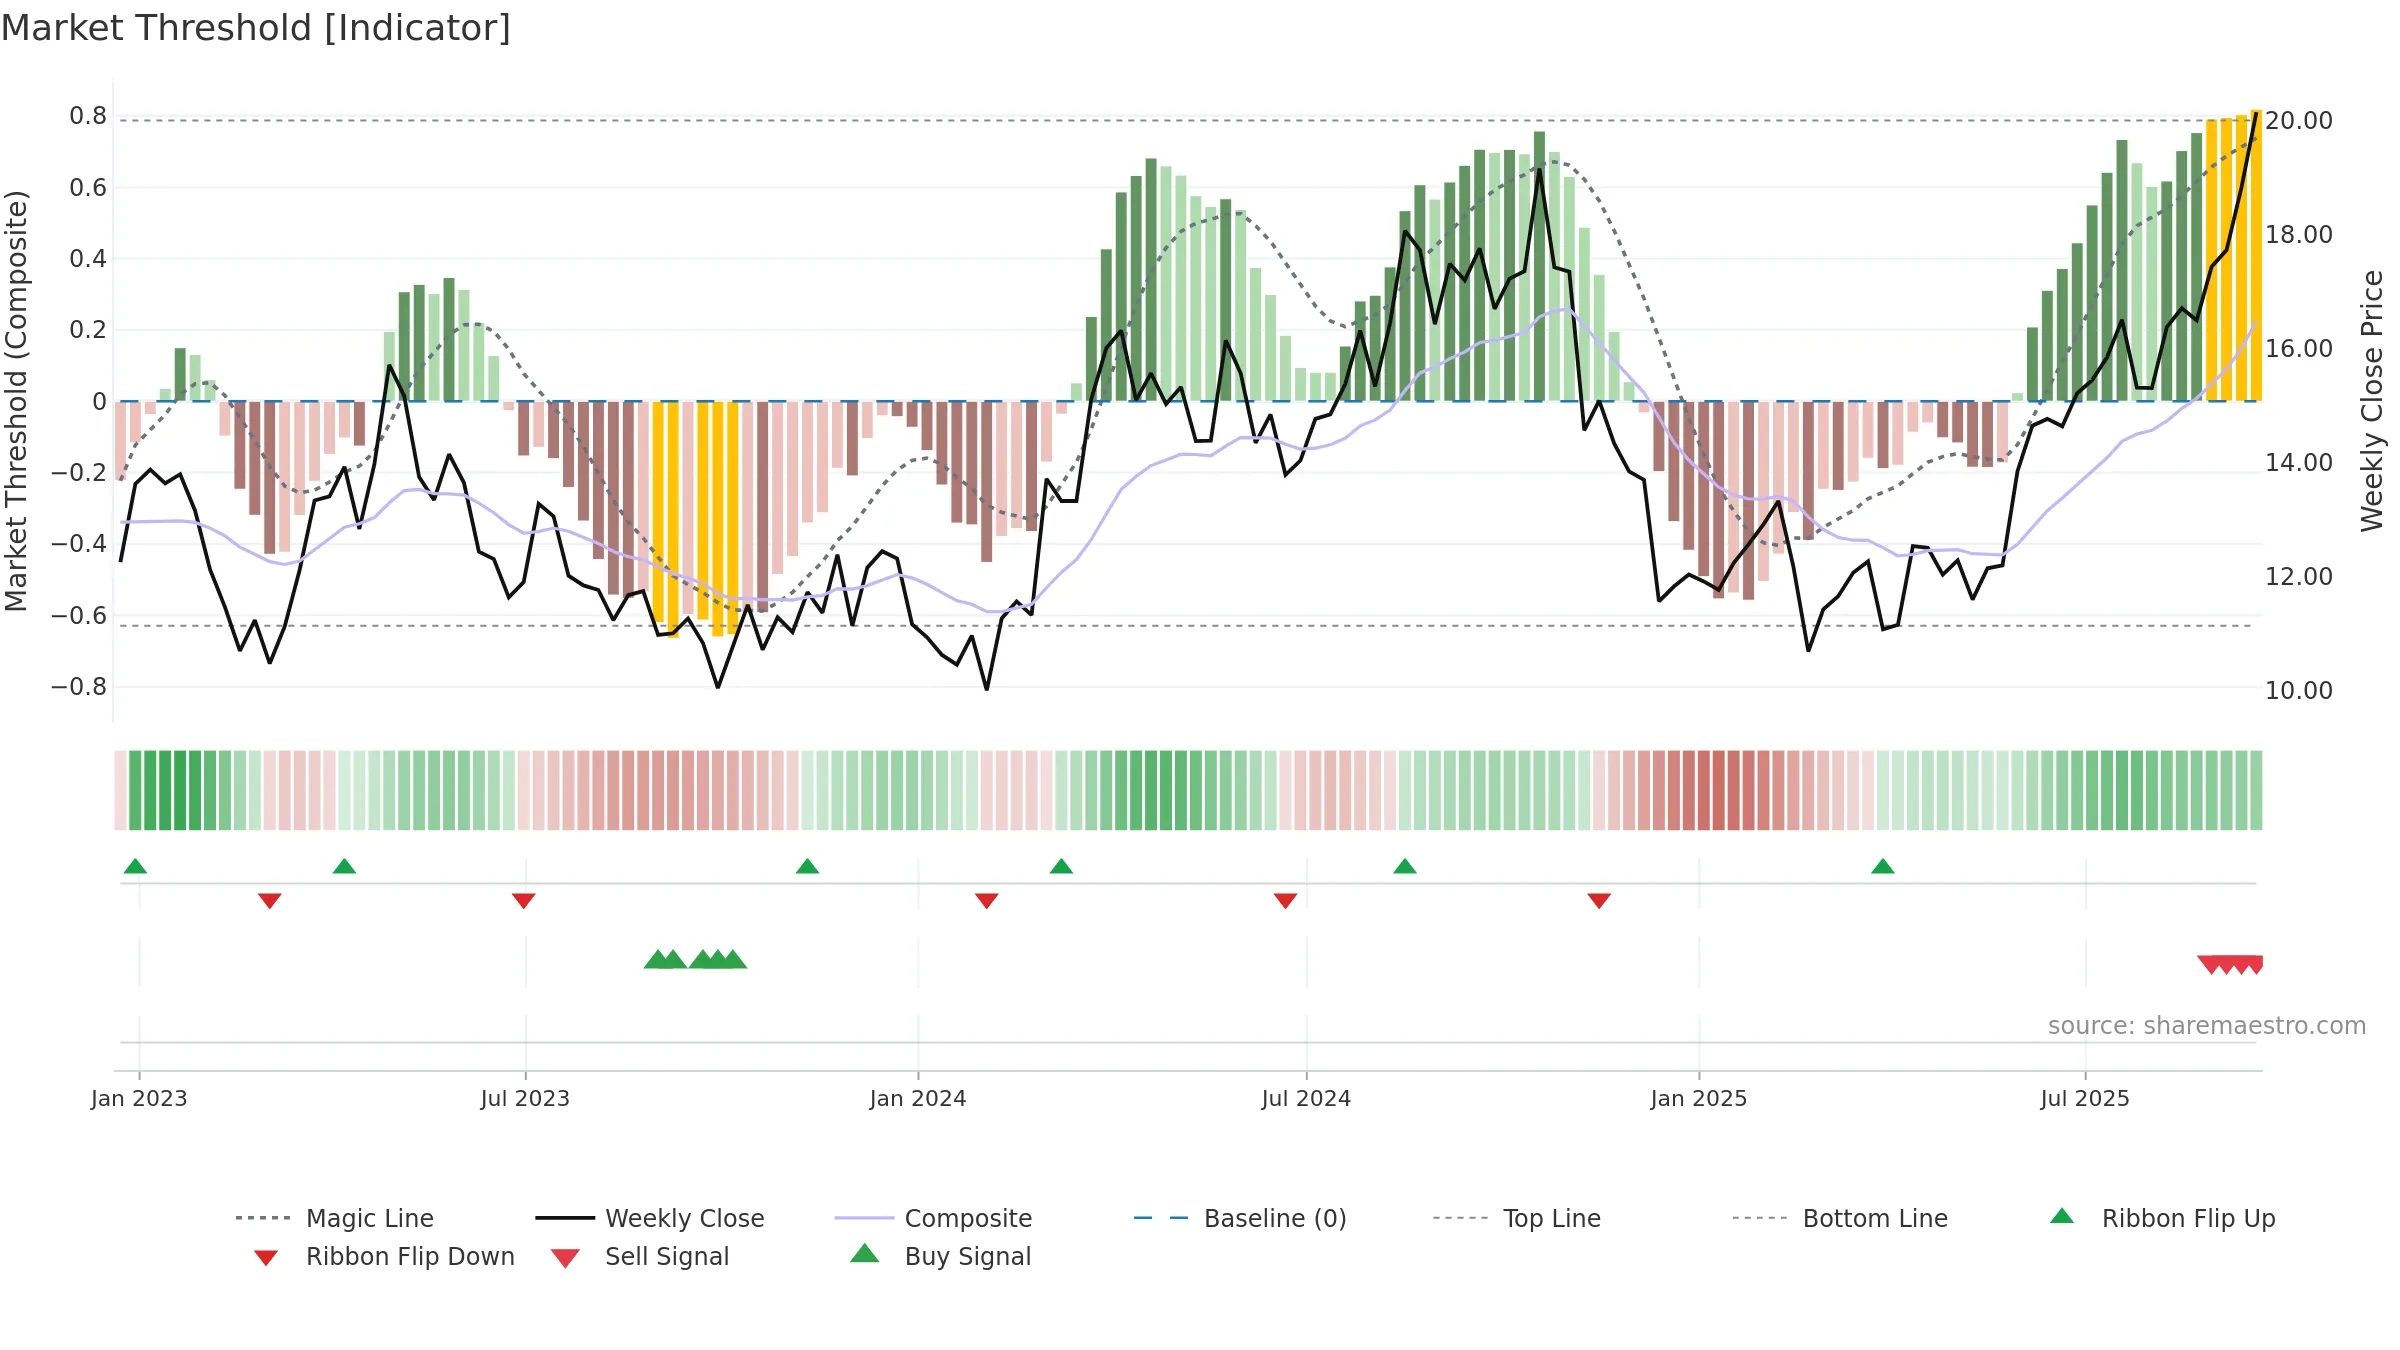
Gauge maps the trend signal to a 0–100 scale.
How to read this — Gauge is elevated but momentum is rolling over; topping risk is rising. Notable breakdown from ≥0.80 weakens trend quality.
Stay alert: protect gains or seek confirmation before adding risk.
Conclusion
Positive setup. ★★★★☆ confidence. Price window: 31. Trend: Uptrend at Risk; gauge 80. In combination, liquidity confirms the move.
- Momentum is bullish and rising
- Price holds above 8w & 26w averages
- Constructive moving-average stack
- Liquidity confirms the price trend
- High-level but rolling over (topping risk)
- Recent breakdown from ≥0.80 weakens trend quality
Why: Price window 31.61% over 8w. Close is 7.01% above the prior-window high. Volume trend rising. Liquidity convergence with price. Trend state uptrend at risk. High-regime (0.80–1.00) downticks 1/3 (33.0%) • Accumulating. MA stack constructive. Momentum bullish and rising.
Tip: Most metrics include a hover tooltip where they appear in the report.