Muthoot Capital Services Limited
MUTHOOTCAP NSE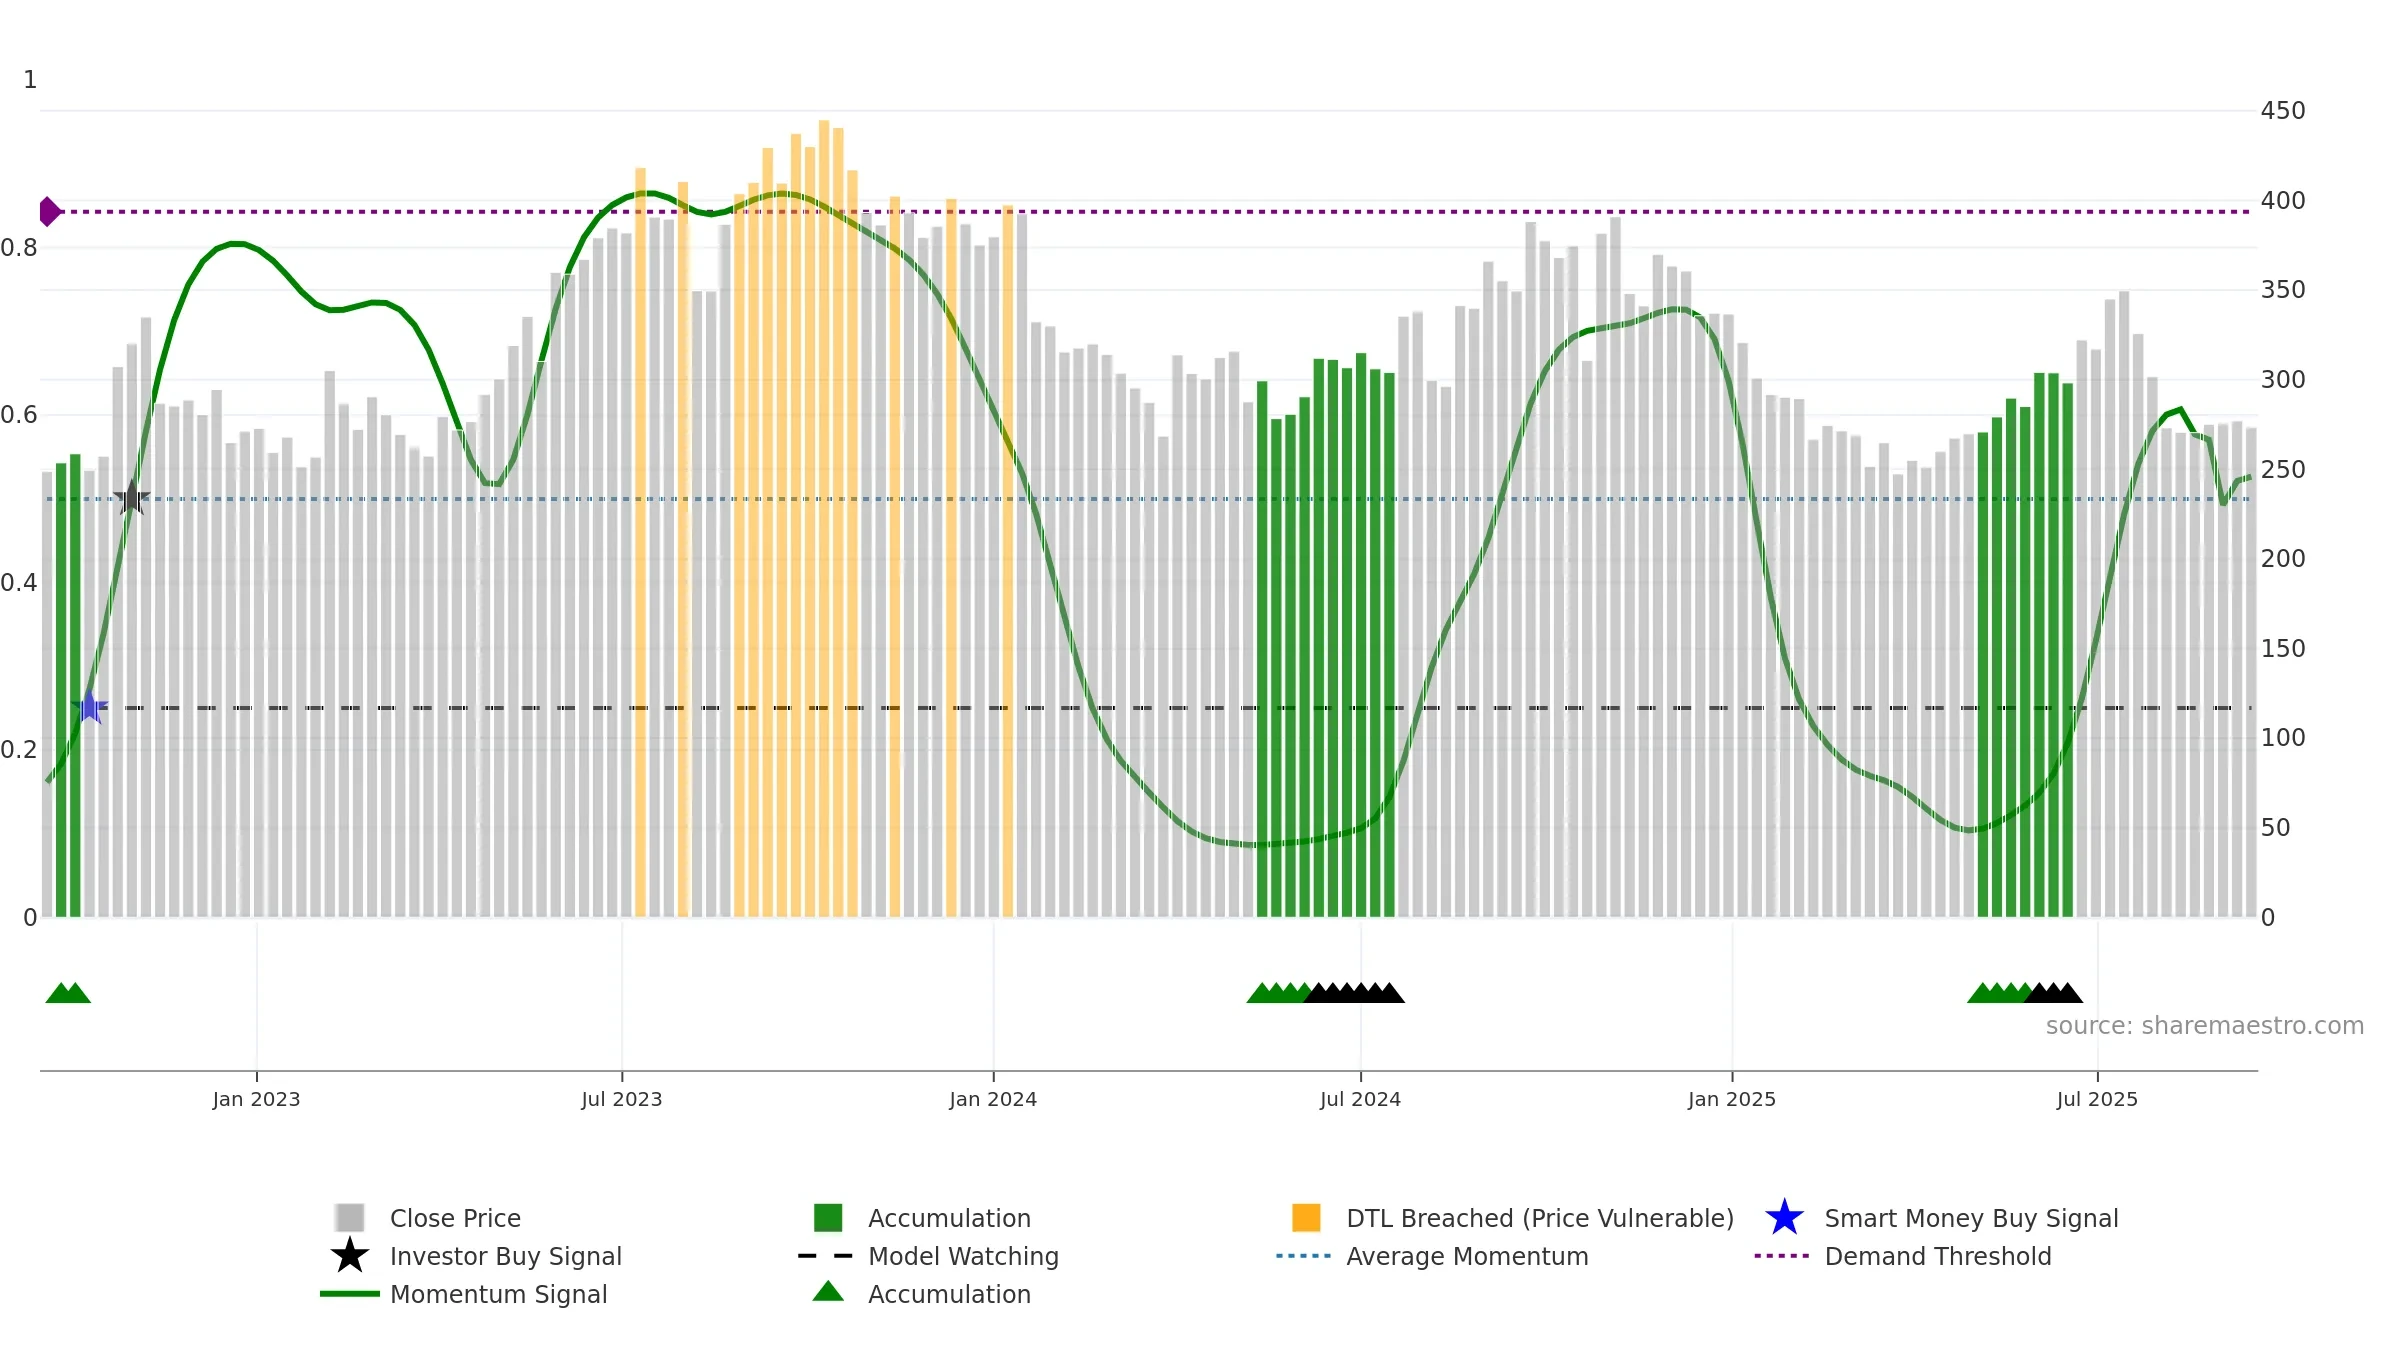
Weekly Report
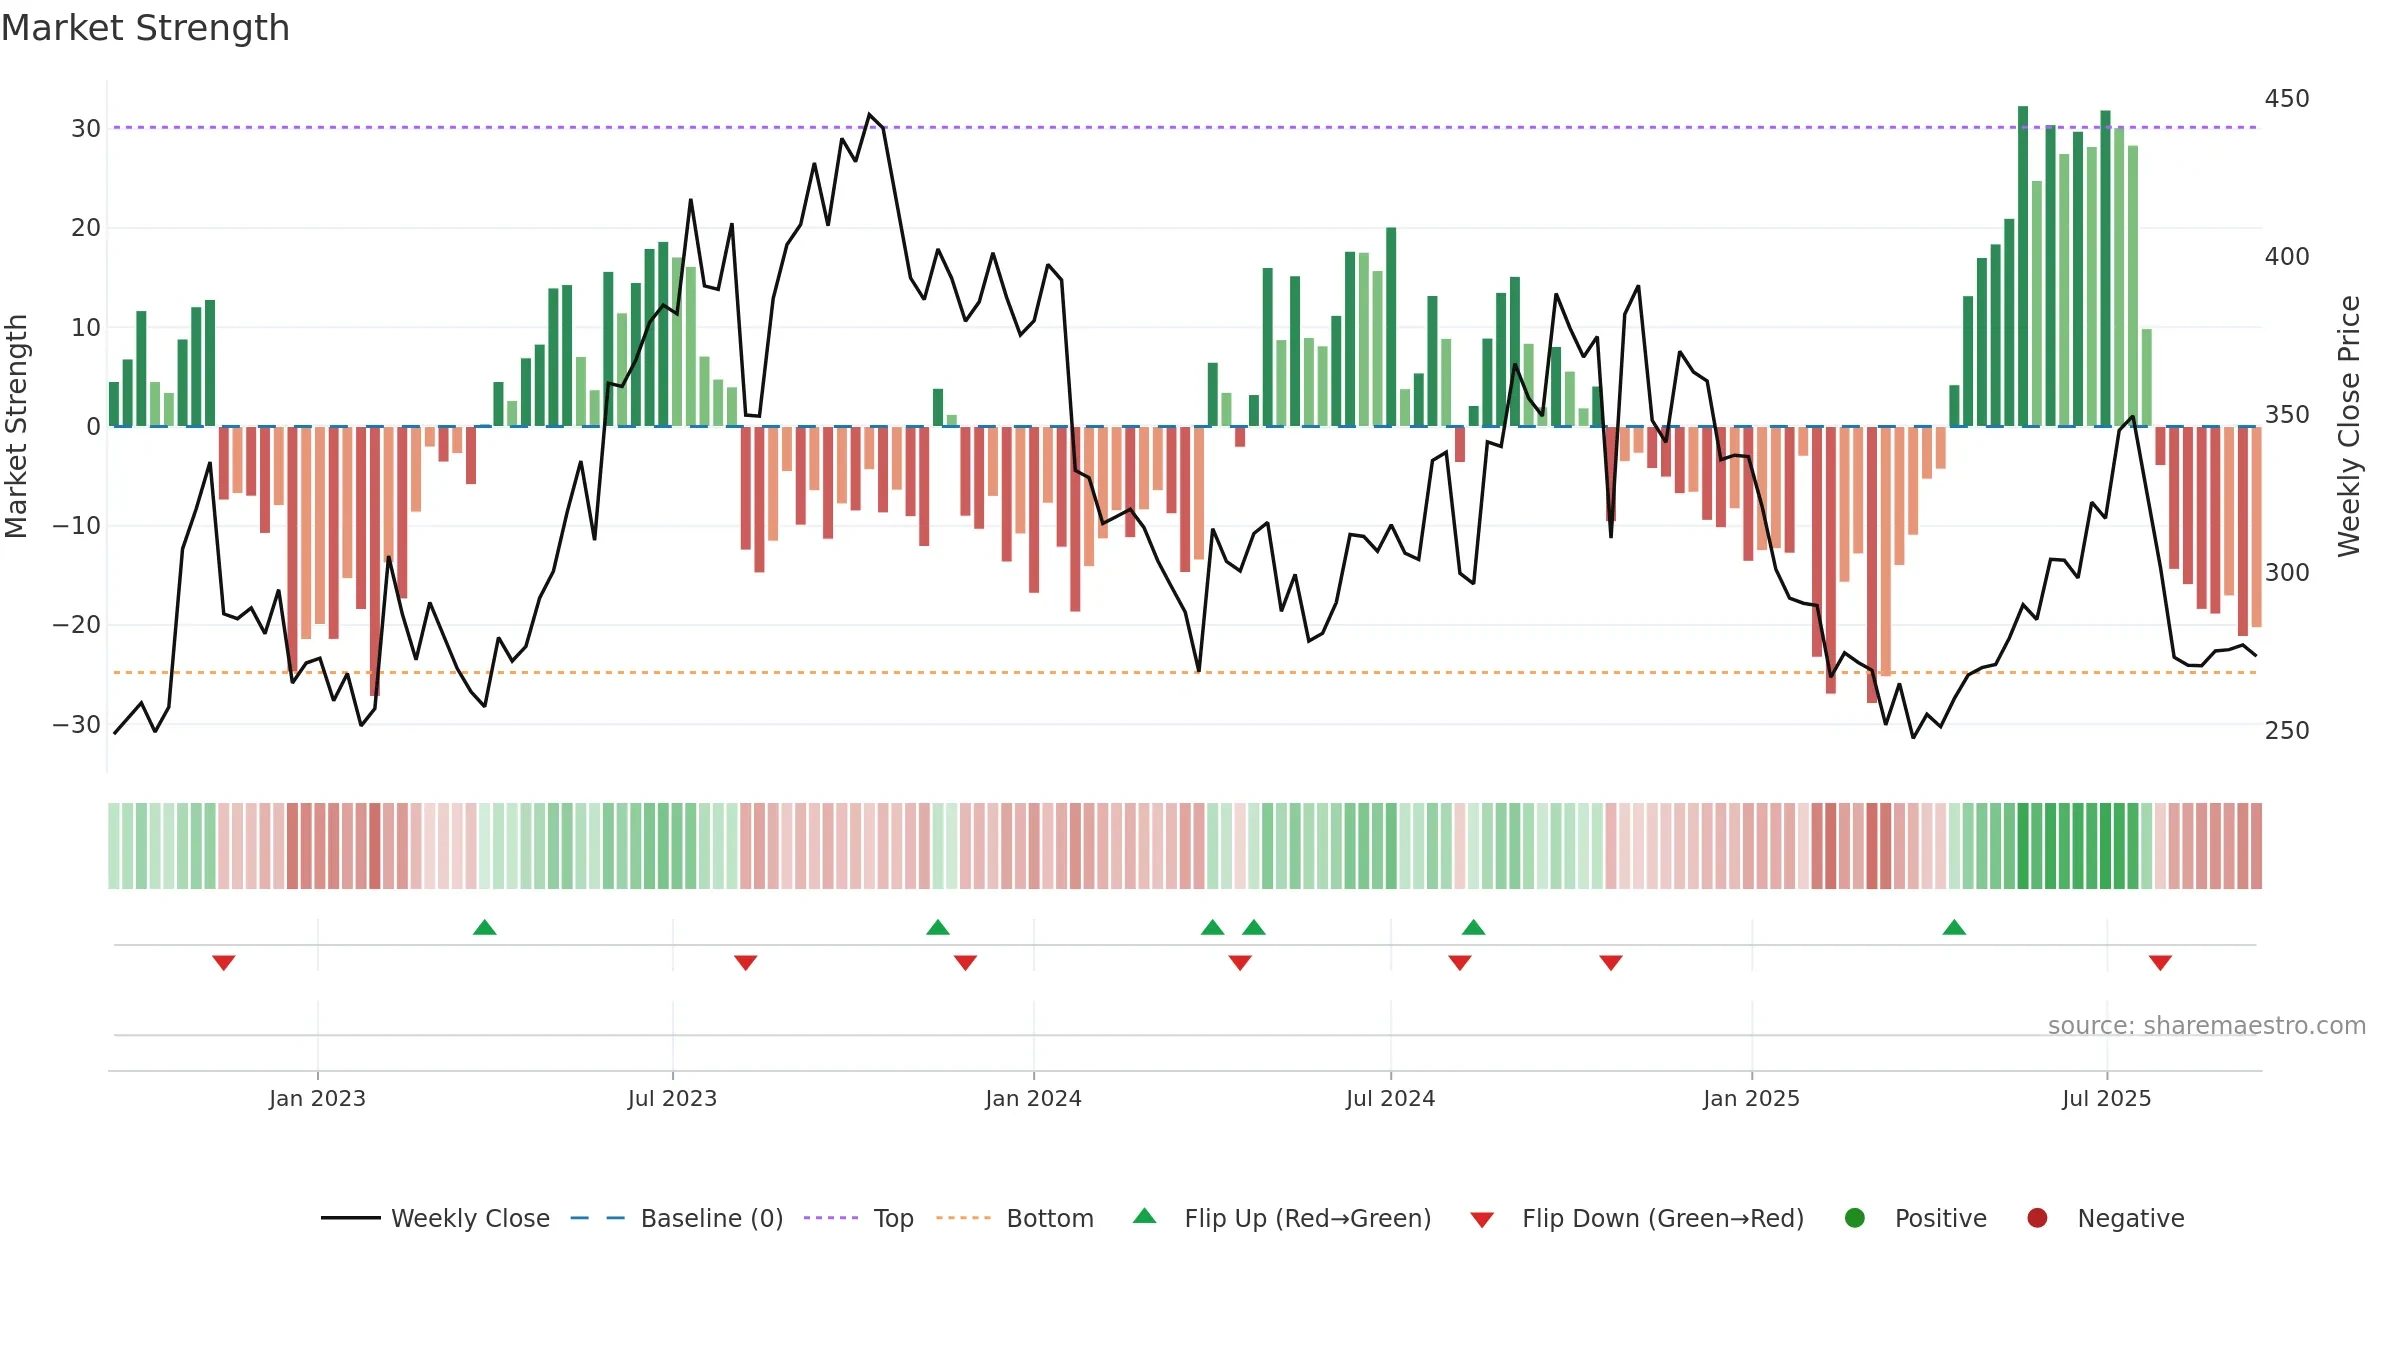
Muthoot Capital Services Limited closed at 273.4000 (-1.97% WoW) . Data window ends Mon, 15 Sep 2025.
How to read this — Price slope is downward, indicating persistent supply pressure. Volume and price are moving in the same direction — a constructive confirmation. Returns are negatively correlated with volume — strength may come on lighter activity. Distance to baseline is narrowing — reverting closer to its fair-value track. Price sits below key averages, keeping pressure on the tape.
Down-slope argues for patience; rallies can fade sooner unless participation improves.
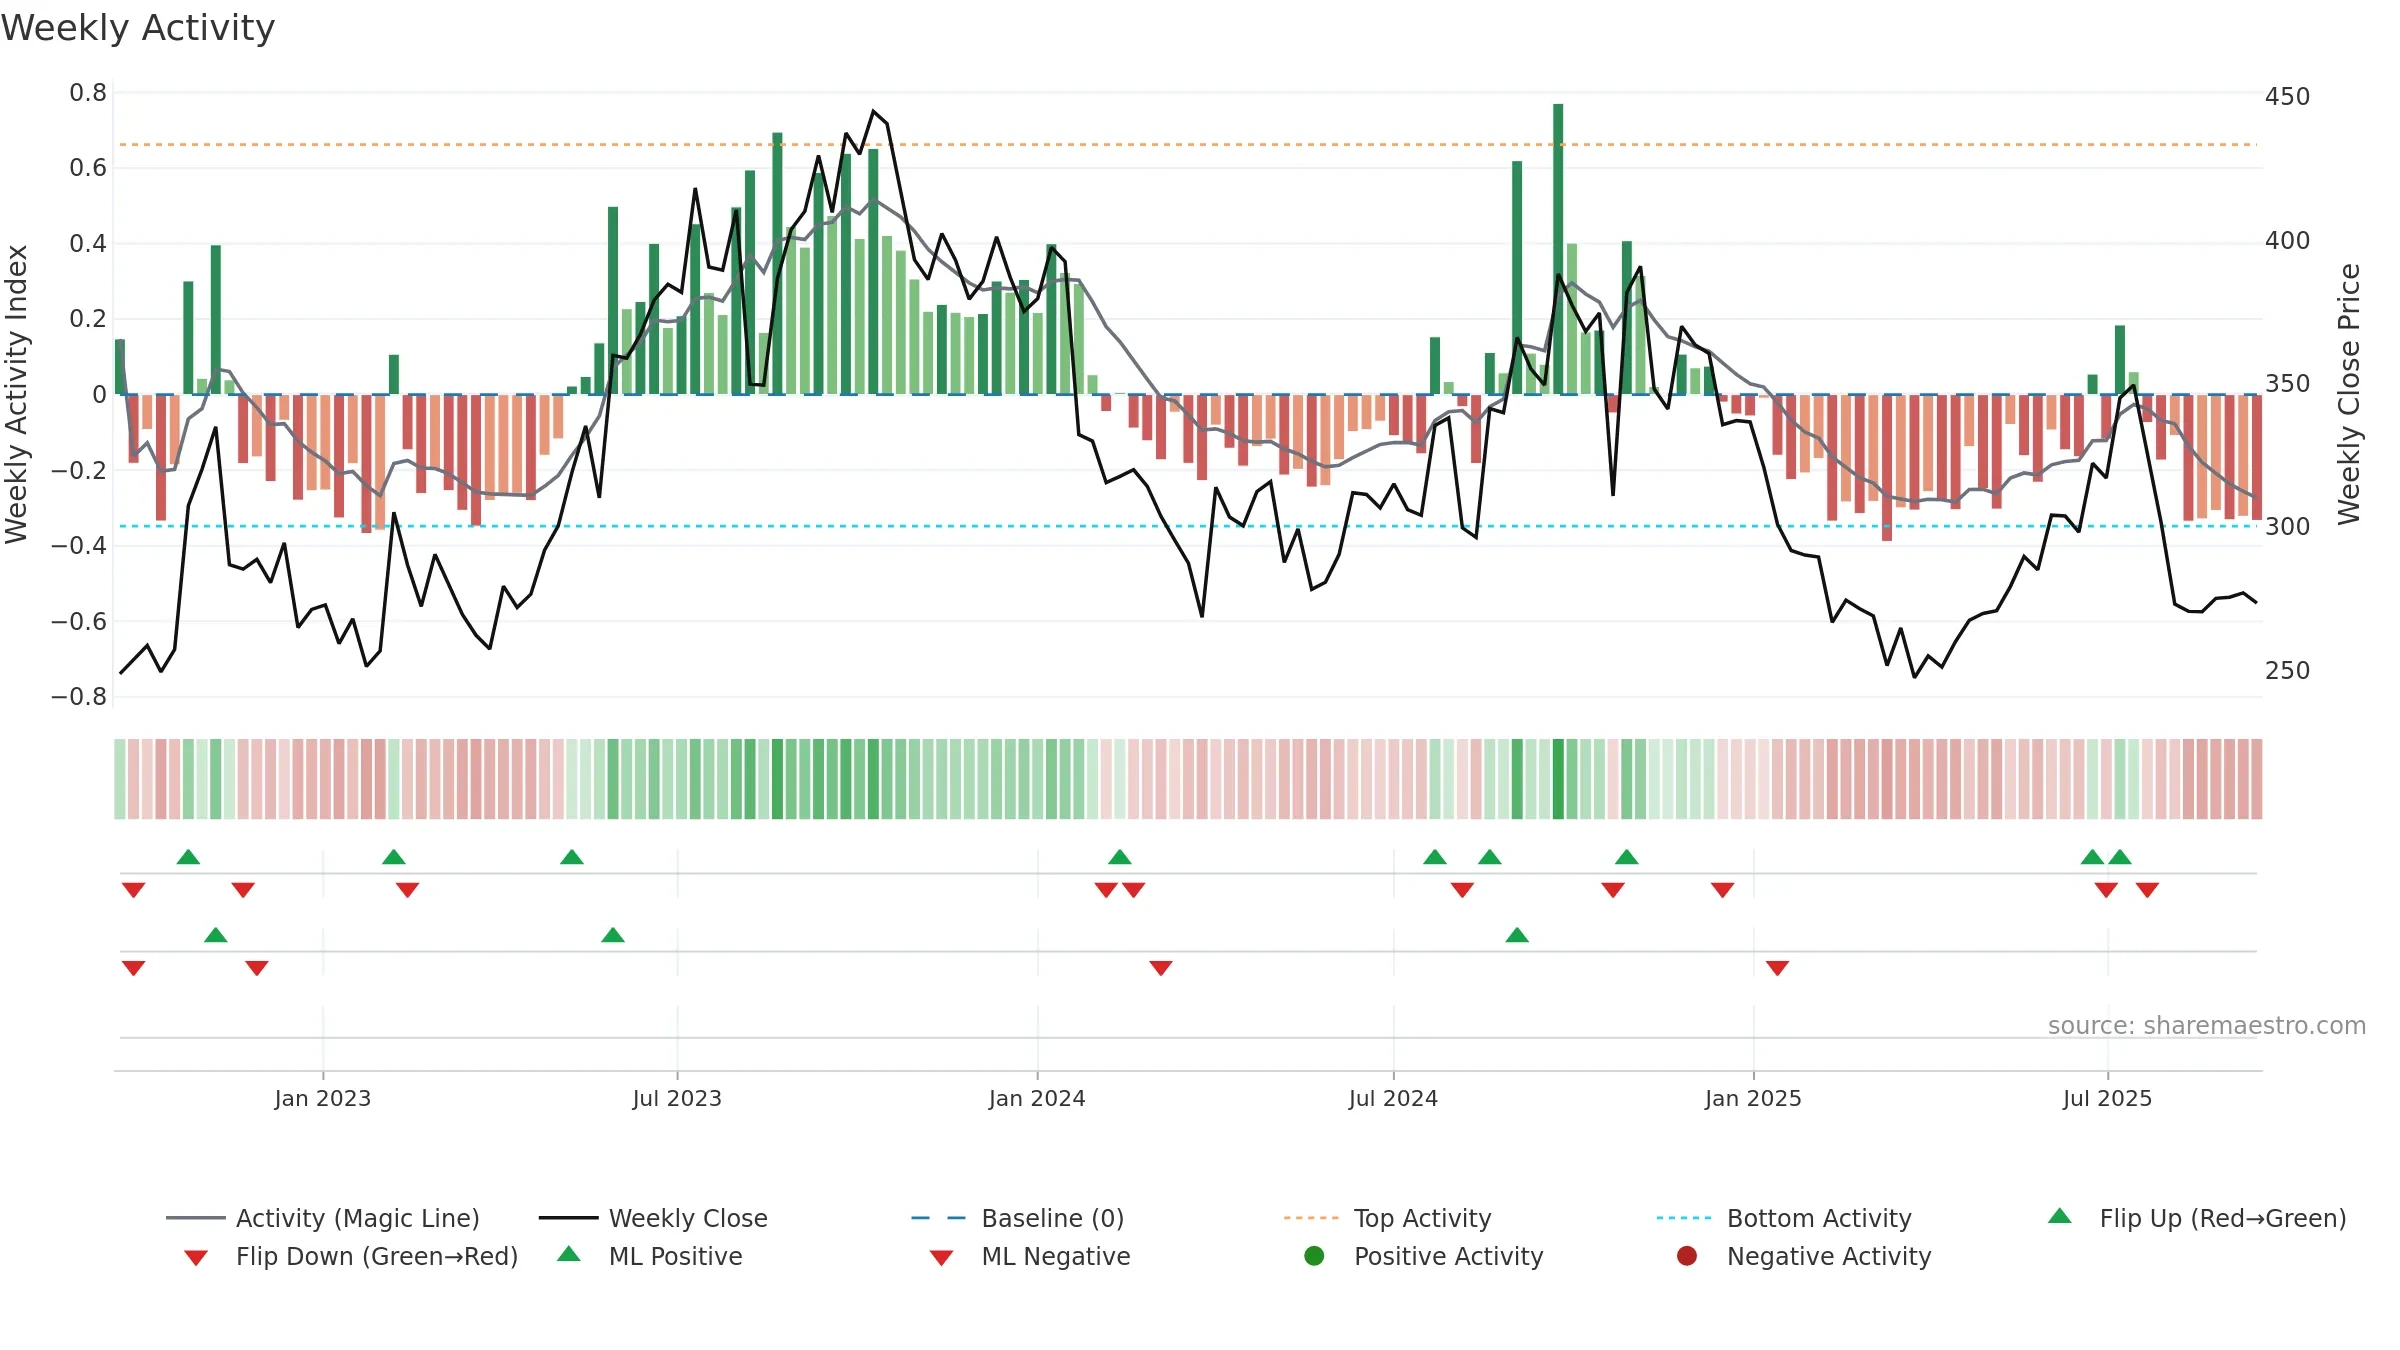
Gauge maps the trend signal to a 0–100 scale.
How to read this — Range-bound conditions; conviction is limited until a break or acceleration emerges. Loss of the ~0.50 midline after strength suggests regime shift.
Wait for a directional break or improving acceleration.
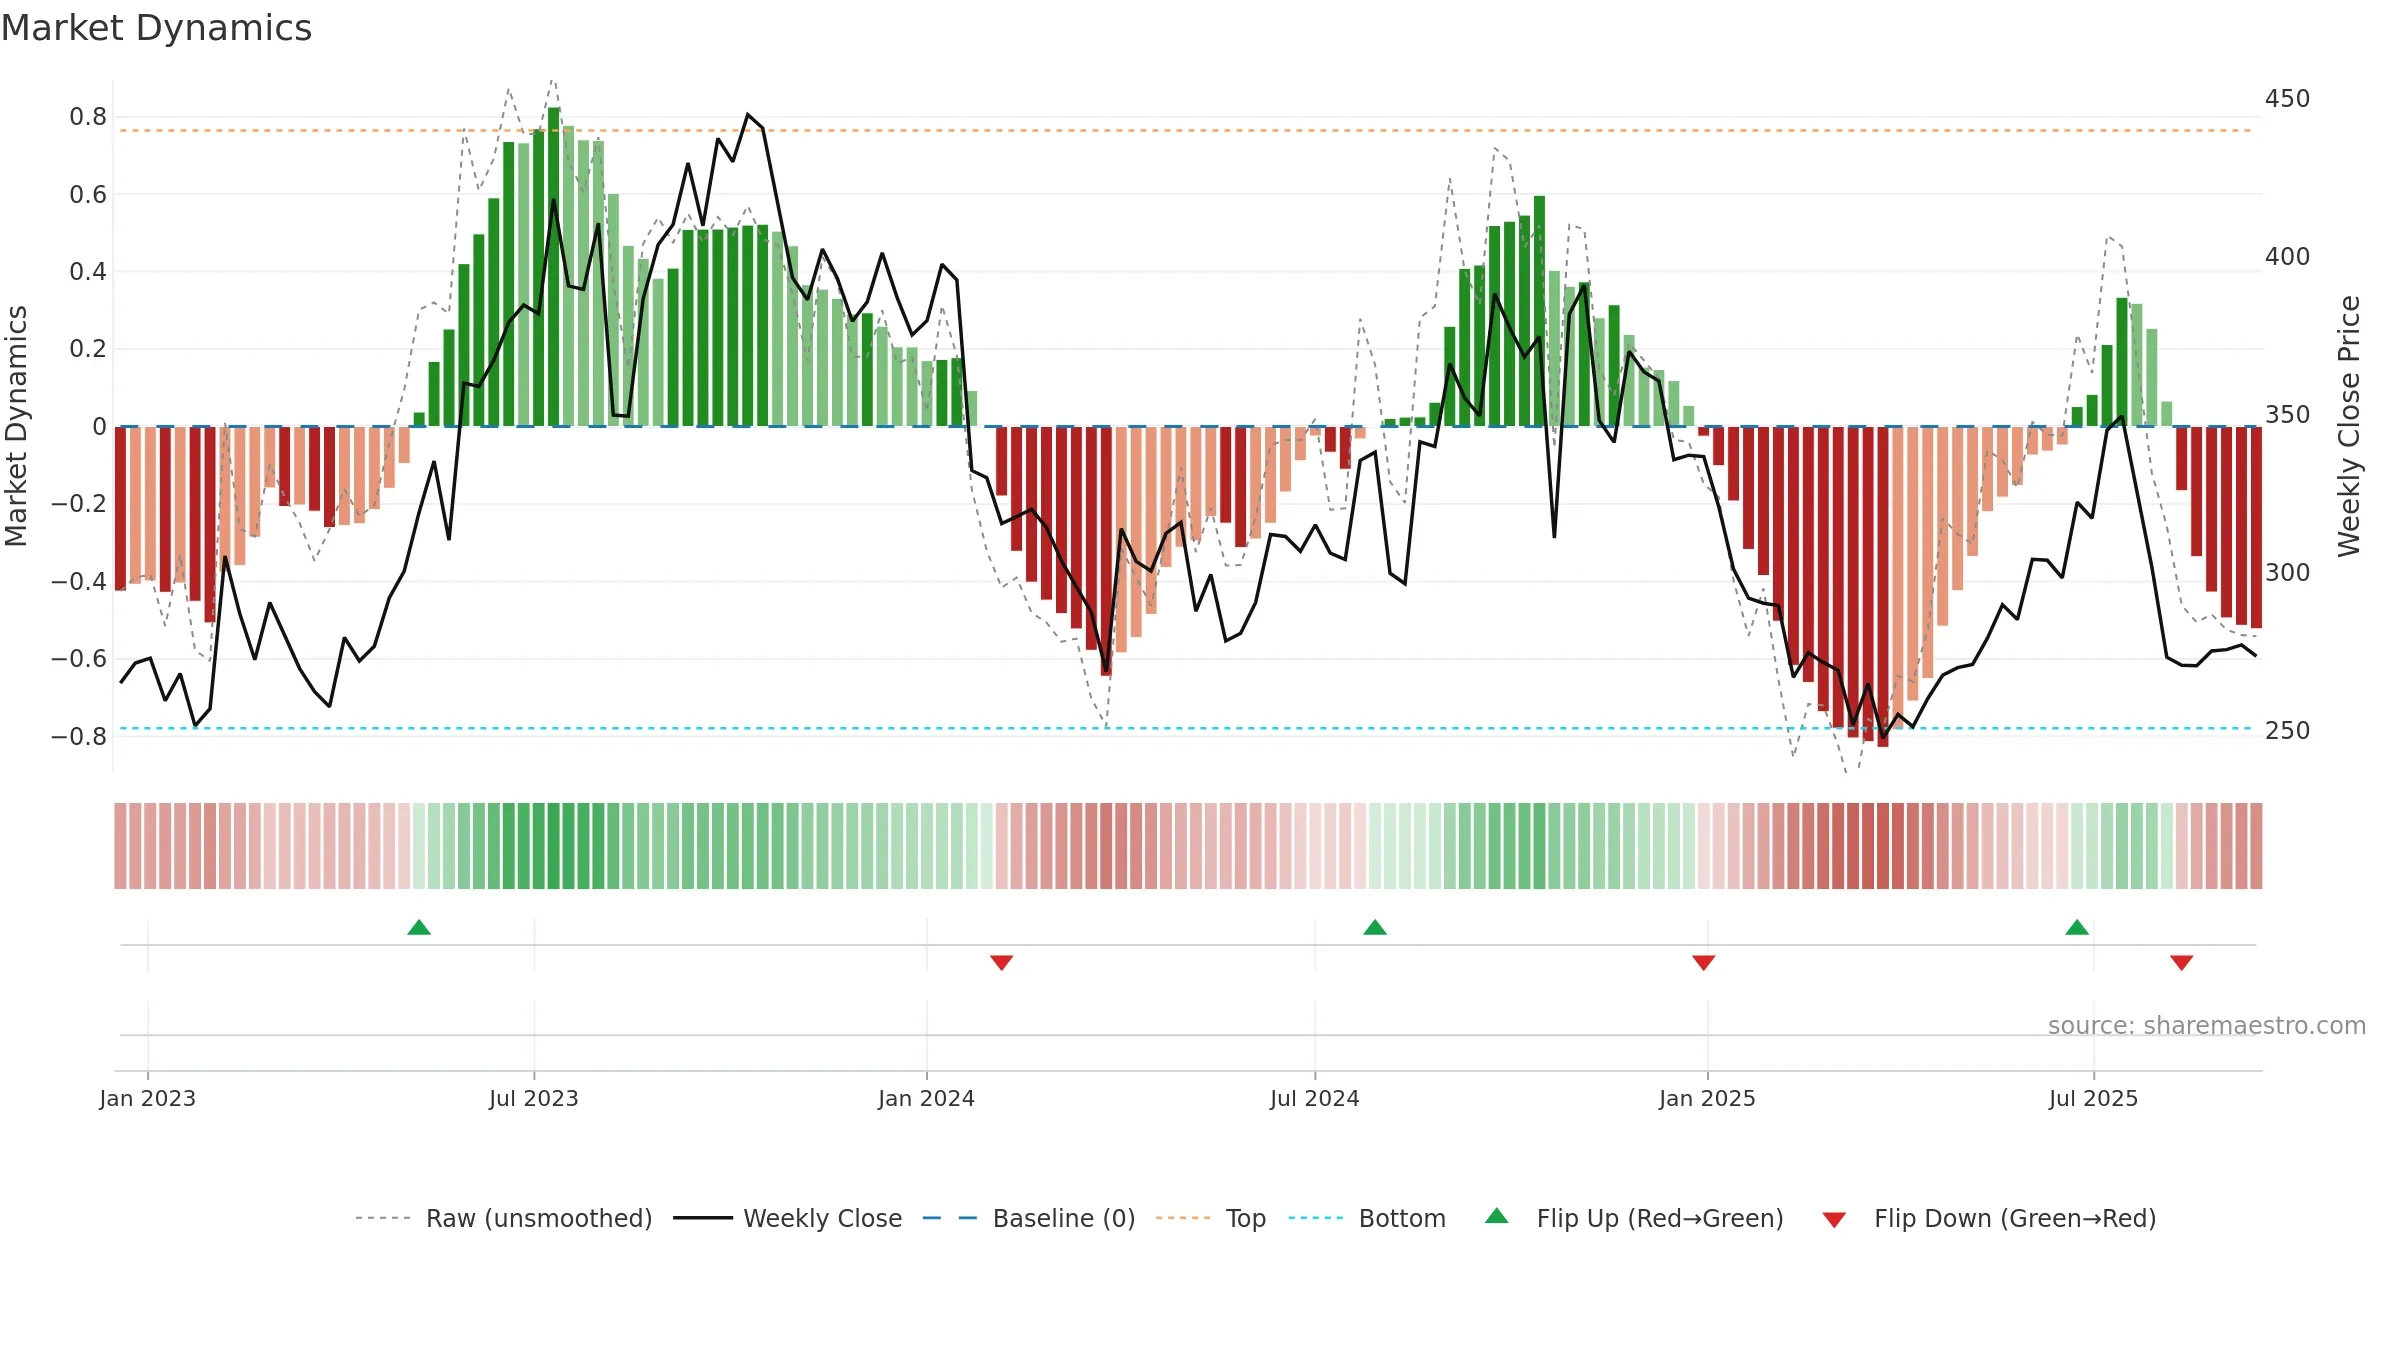
Price is below fair value; potential upside if momentum constructive.
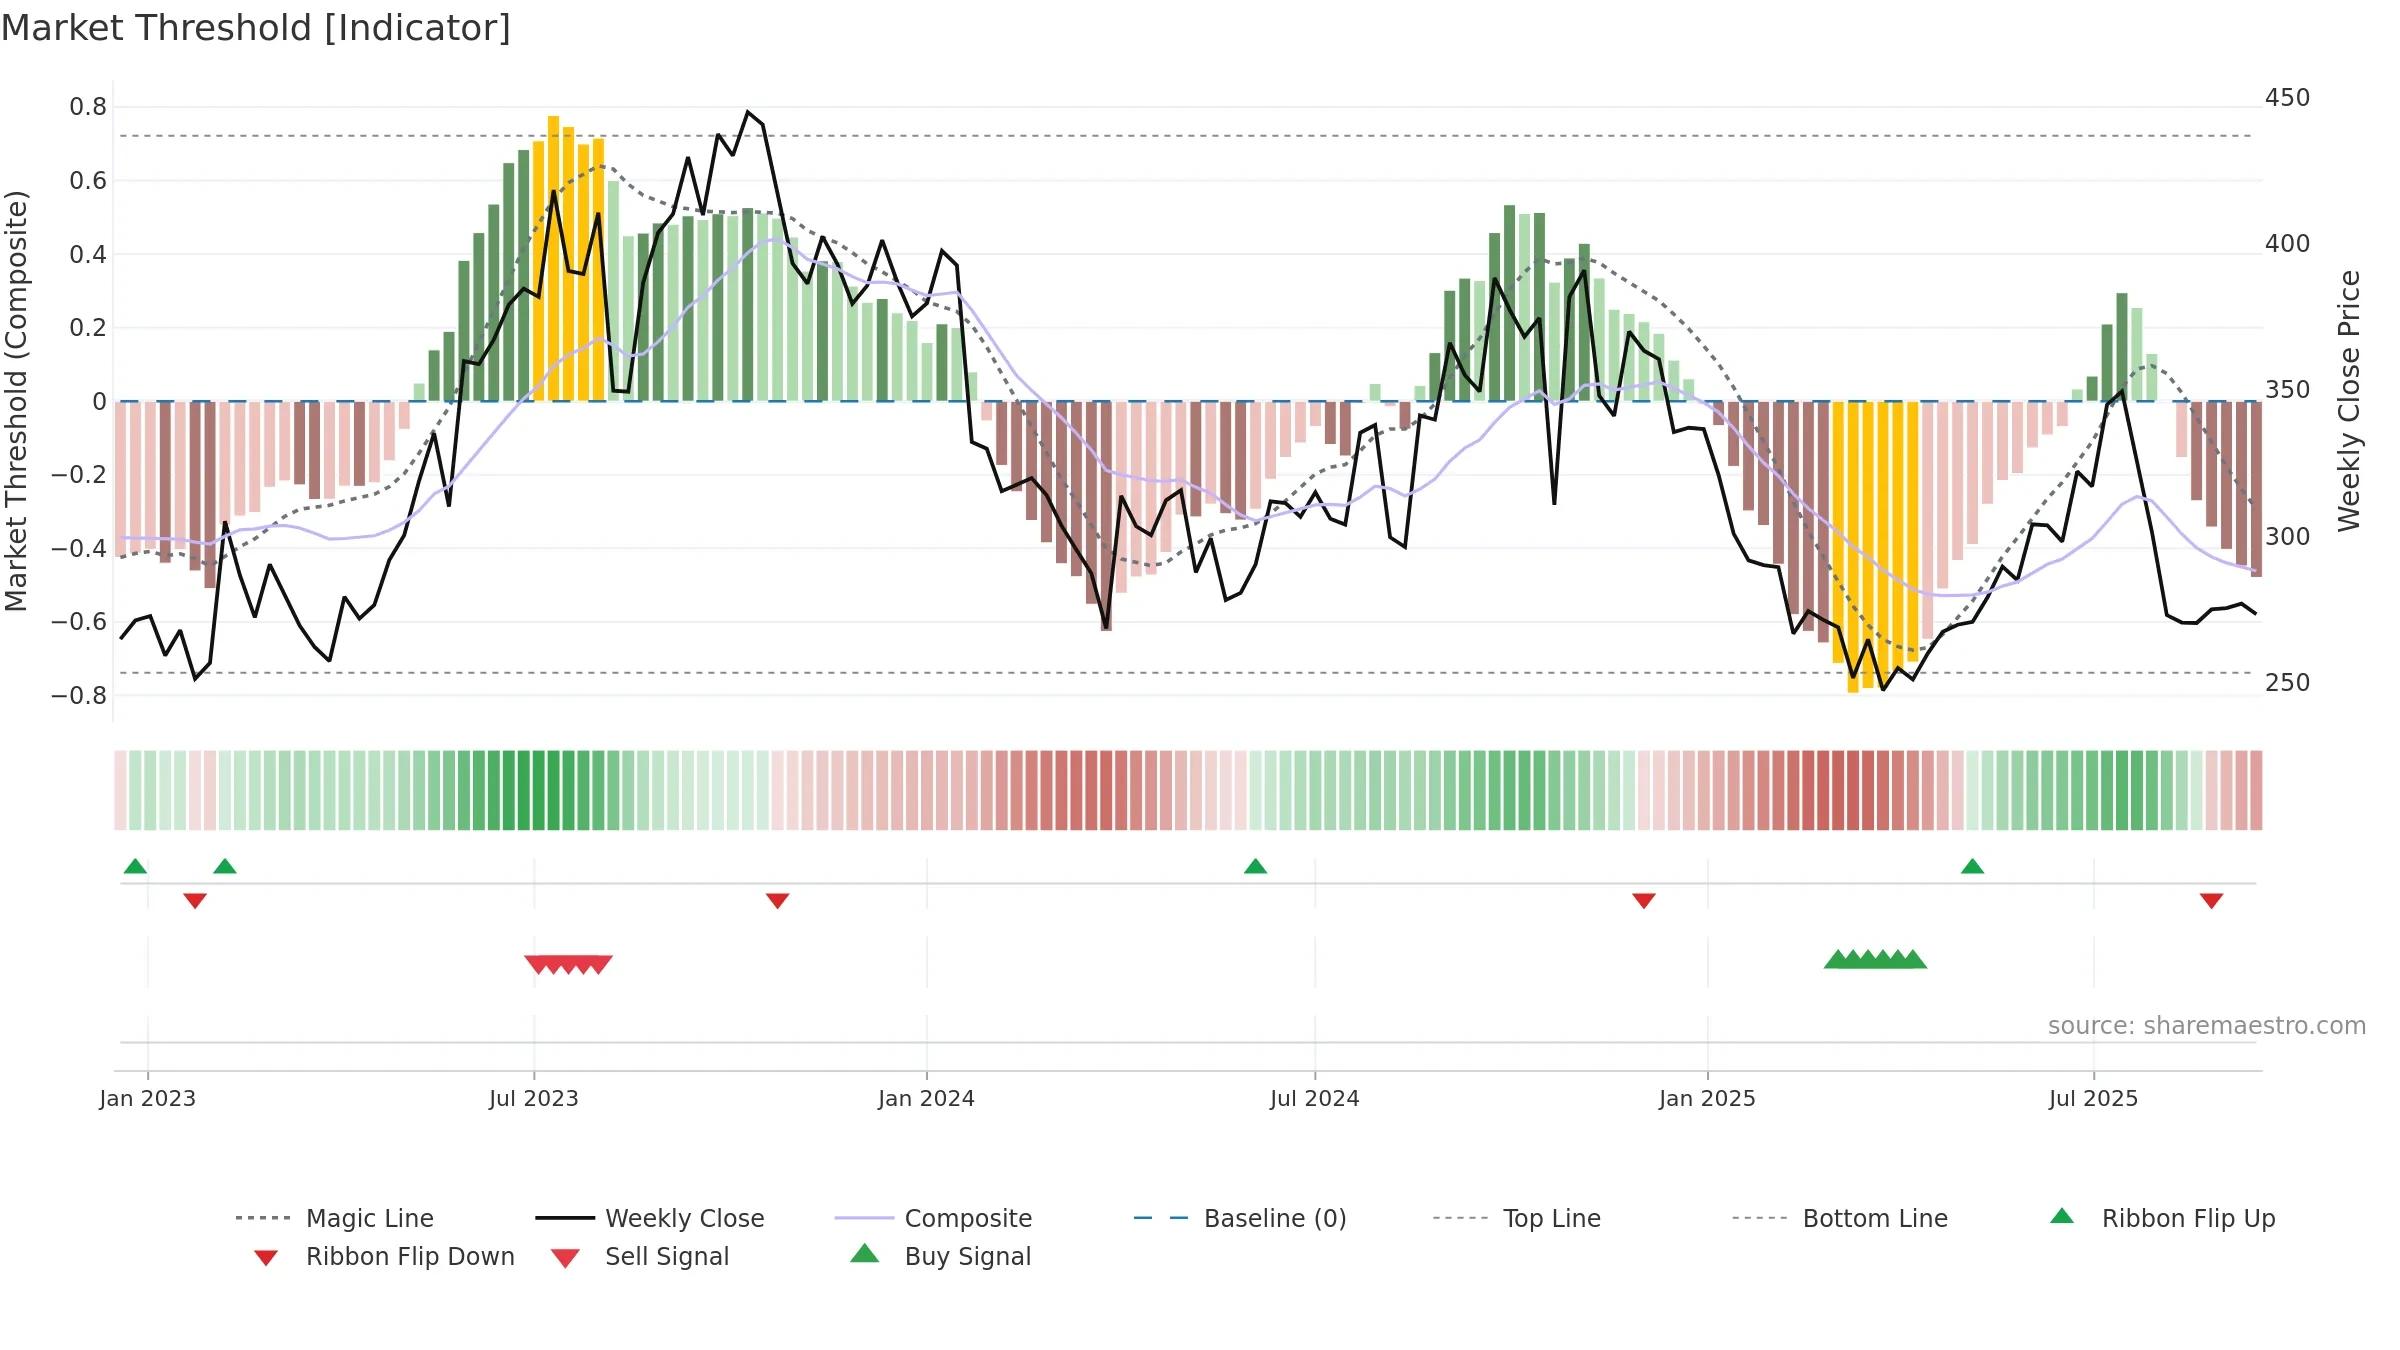
Conclusion
Neutral setup. ★★★☆☆ confidence. Price window: -9. Trend: Range / Neutral; gauge 52. In combination, liquidity confirms the move.
- Liquidity confirms the price trend
- Momentum is weak/falling
- Price is not above key averages
- Negative multi-week performance
- Midline (~0.50) failure after strength
Why: Price window -9.37% over 8w. Close is -9.37% below the prior-window high. Volume trend falling. Liquidity convergence with price. Trend state range / neutral. Momentum neutral and falling. Valuation supportive skew.
Tip: Most metrics include a hover tooltip where they appear in the report.