IRM Energy Limited
IRMENERGY NSE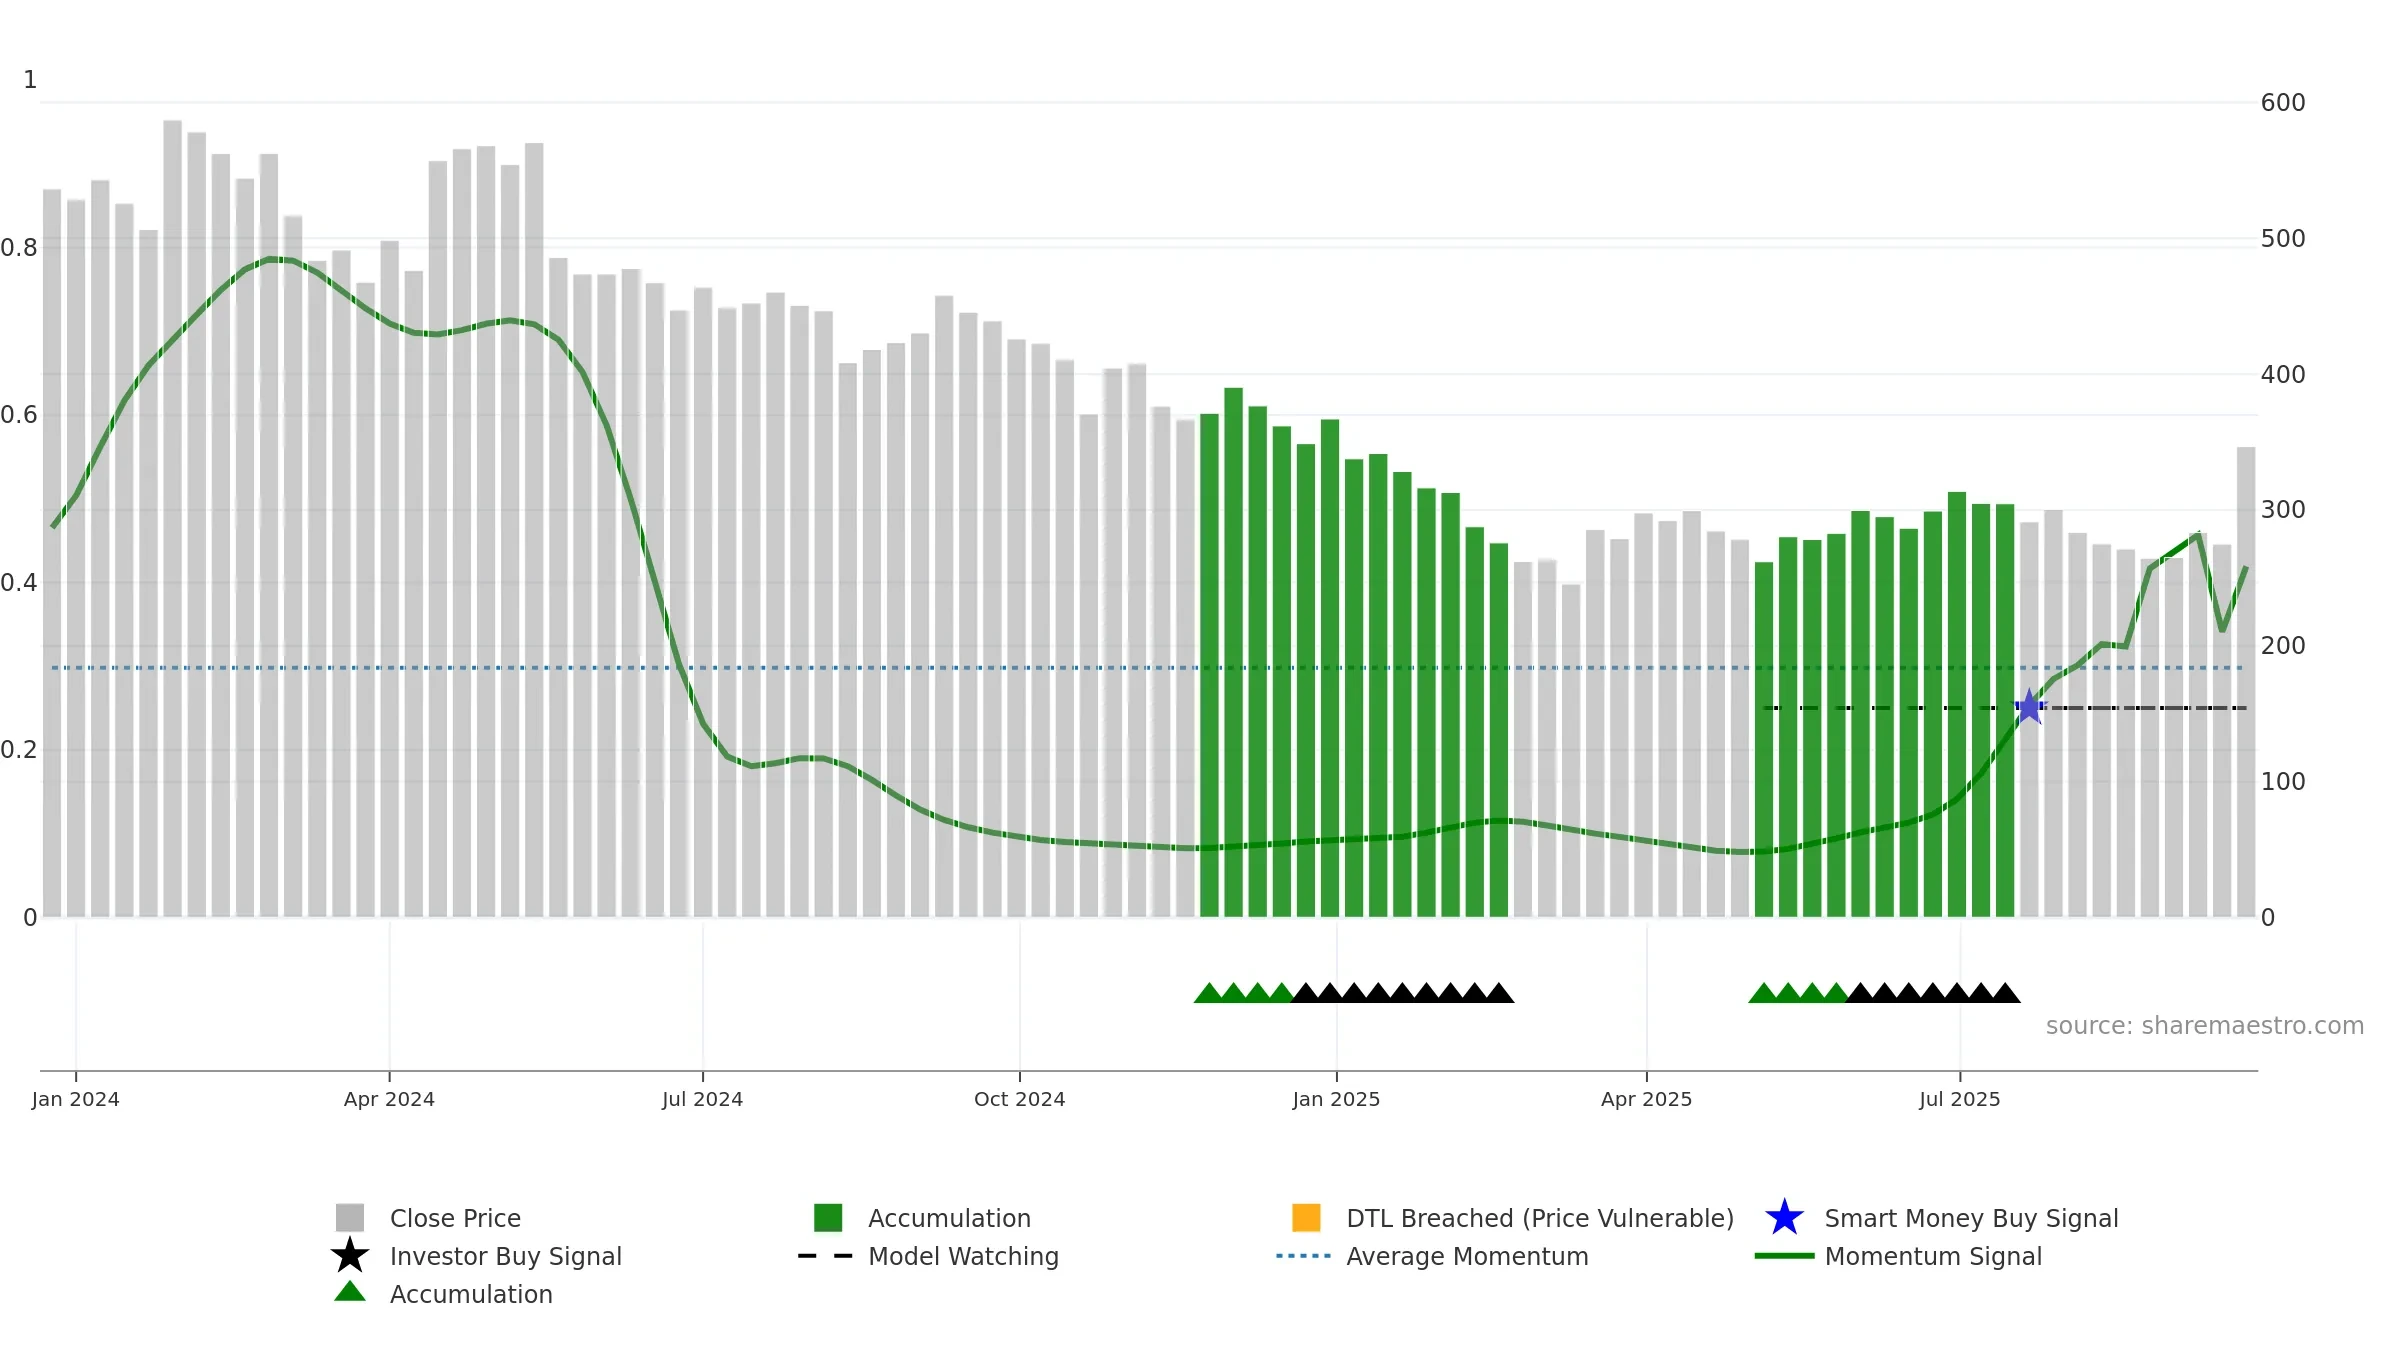

Weekly Report
IRM Energy Limited closed at 346.6500 (-2.35% WoW) . Data window ends Mon, 22 Sep 2025.
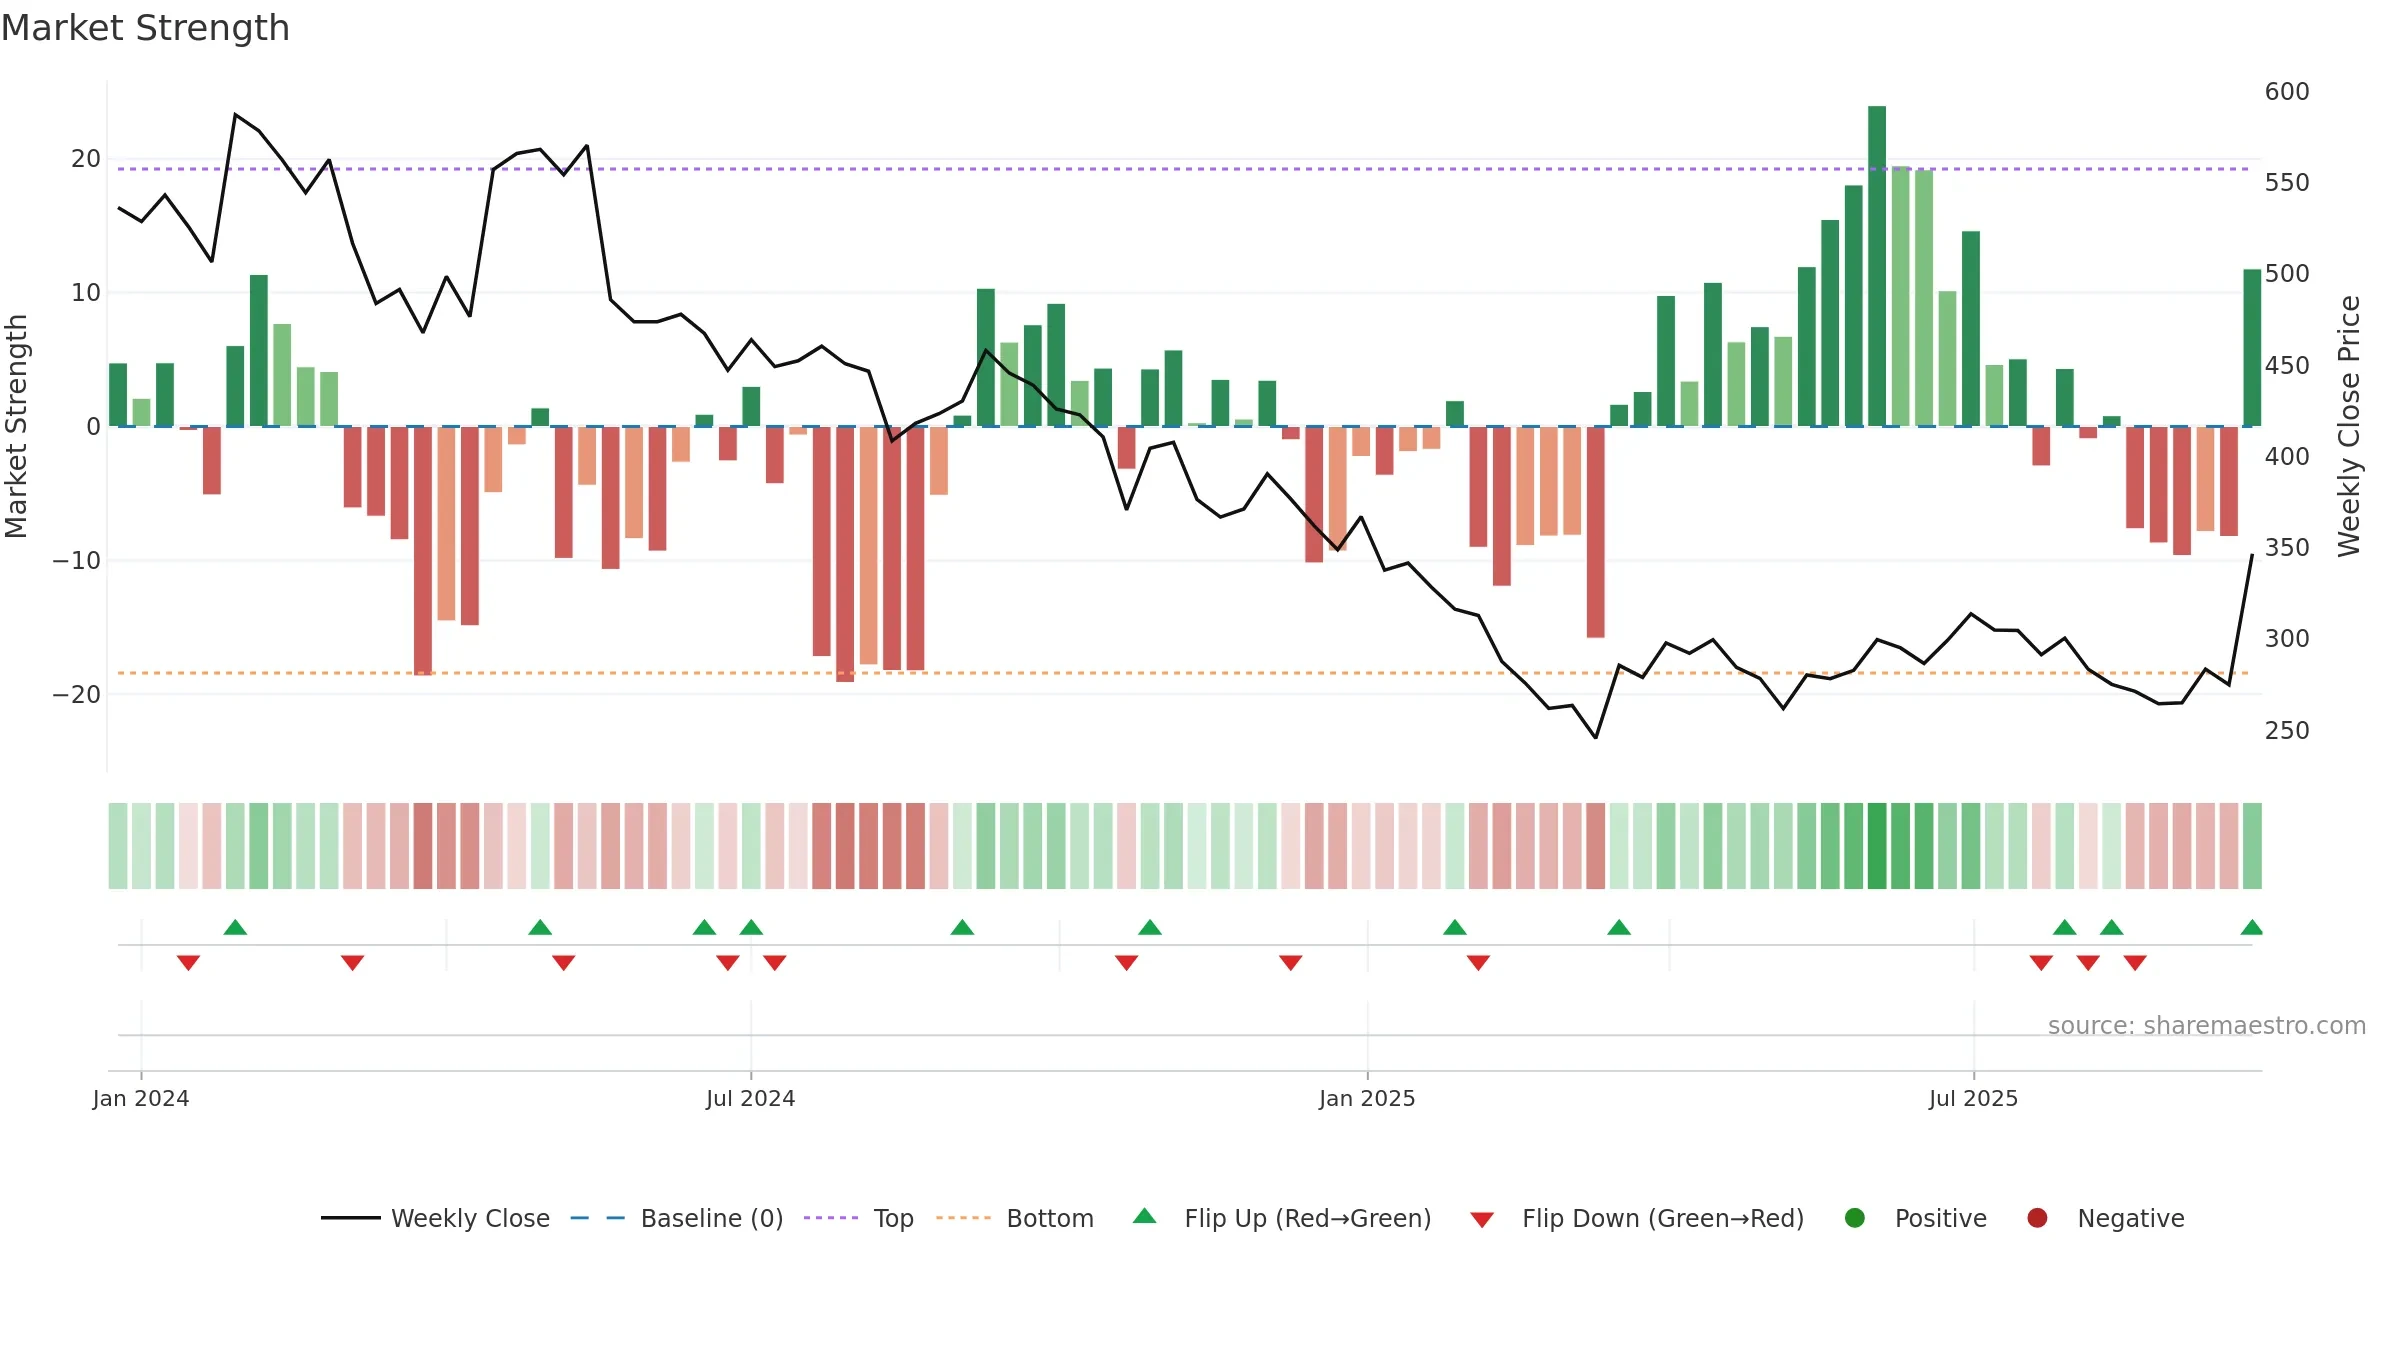
How to read this — Price slope is upward, indicating persistent buying over the window. Volume and price are moving in the same direction — a constructive confirmation. Returns are negatively correlated with volume — strength may come on lighter activity. Fresh short-term crossover improves near-term tone. Price holds above key averages, indicating constructive participation.
Up-slope supports buying interest; pullbacks may be contained if activity stays firm.
Gauge maps the trend signal to a 0–100 scale.
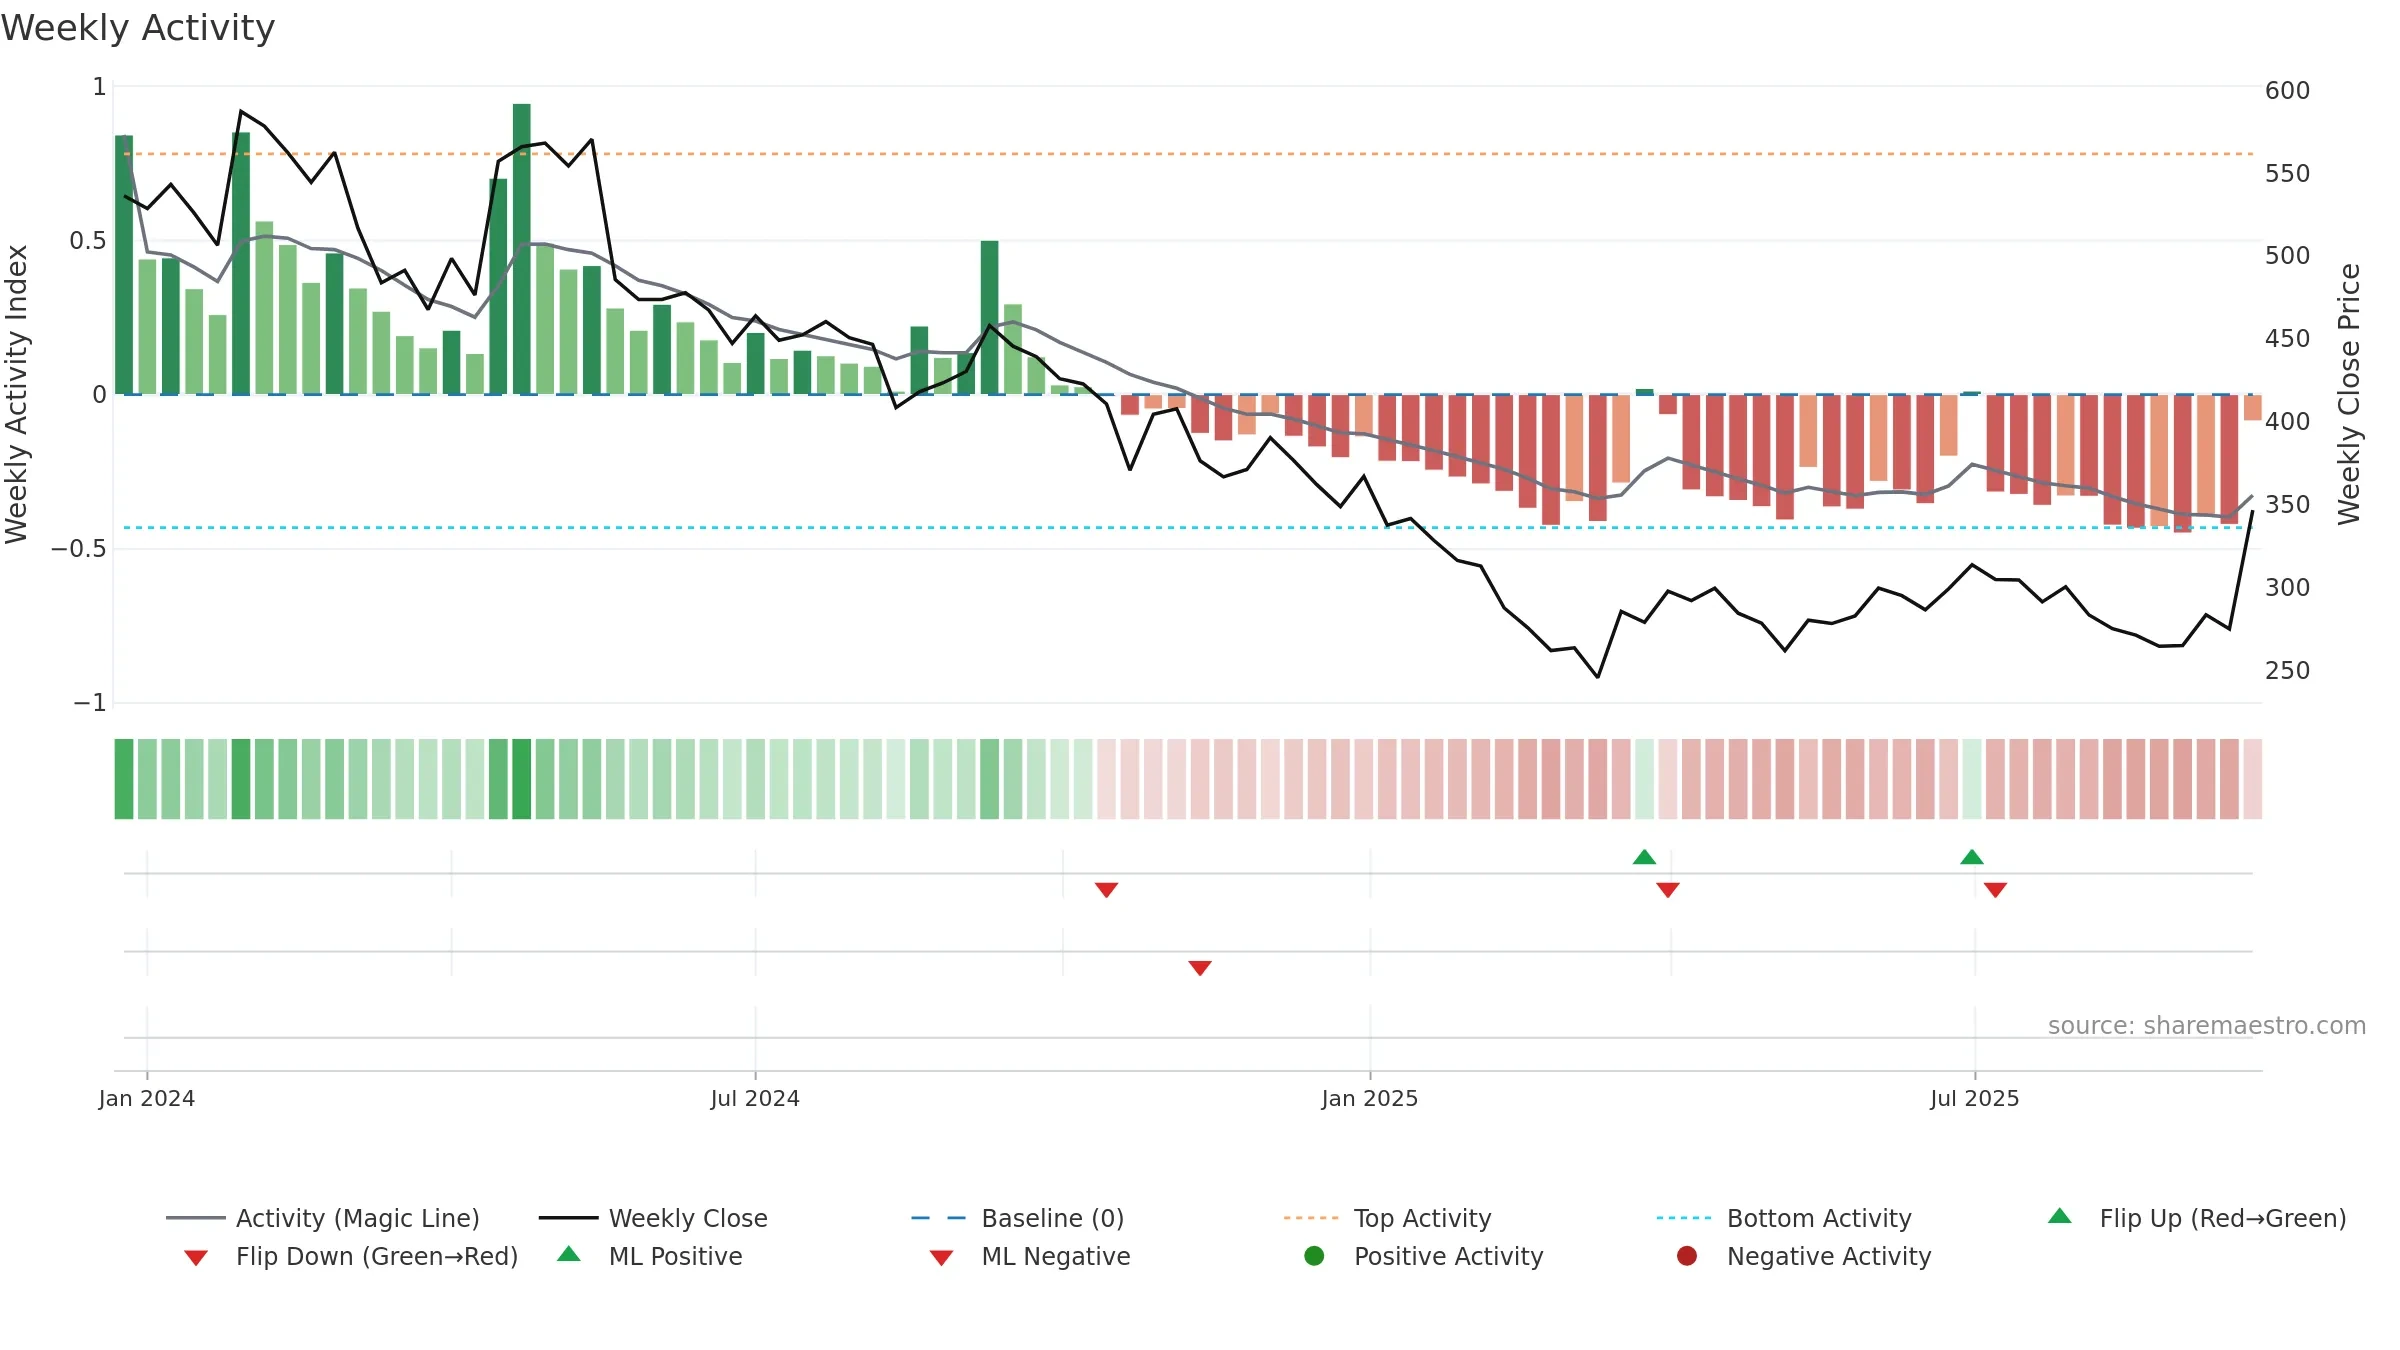
How to read this — Range-bound conditions; conviction is limited until a break or acceleration emerges. Sub-0.40 print confirms downside control.
Wait for a directional break or improving acceleration.
Price is above fair value; upside may be capped without catalysts.
Conclusion
Positive setup. ★★★★☆ confidence. Price window: 22. Trend: Range / Neutral; gauge 41. In combination, liquidity confirms the move.
- Price holds above 8w & 26w averages
- Liquidity confirms the price trend
- Solid multi-week performance
- Sub-0.40 print confirms bear control
Why: Price window 22.34% over 8w. Close is 22.30% above the prior-window high. Volume trend rising. Liquidity convergence with price. Trend state range / neutral. 4–8w crossover bullish. Momentum neutral and rising. Valuation limited upside without catalysts.
Tip: Most metrics include a hover tooltip where they appear in the report.