The Cigna Group
CI NYSE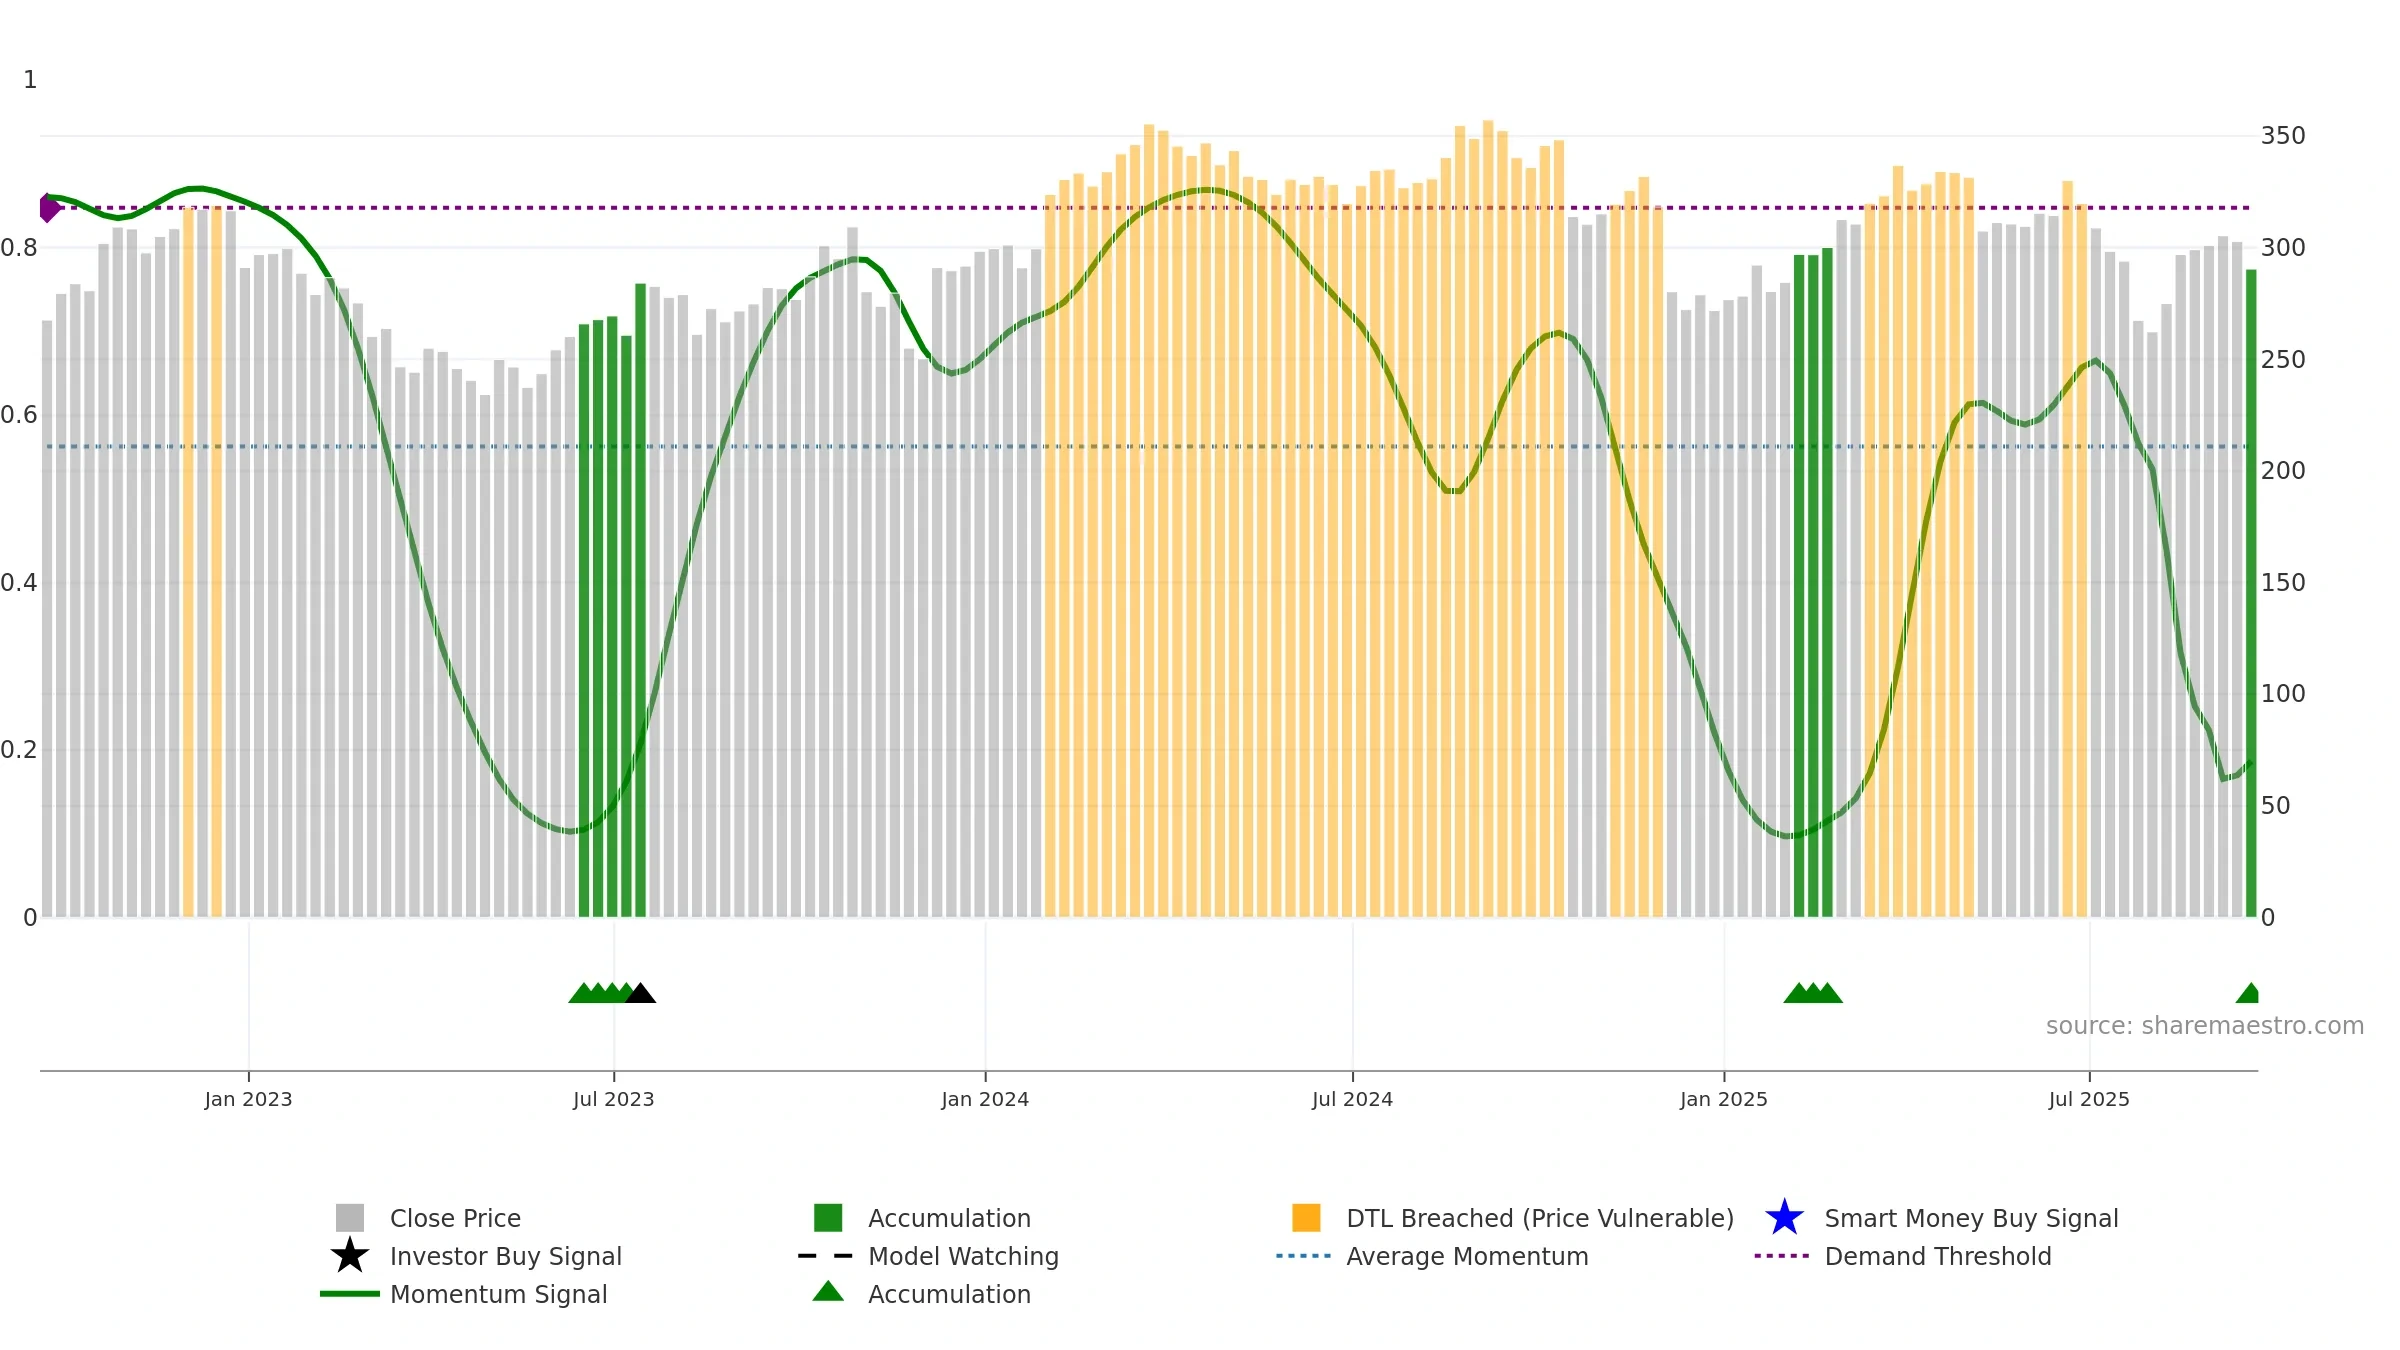
Weekly Report
The Cigna Group closed at 290.3600 (-1.18% WoW) . Data window ends Fri, 19 Sep 2025.
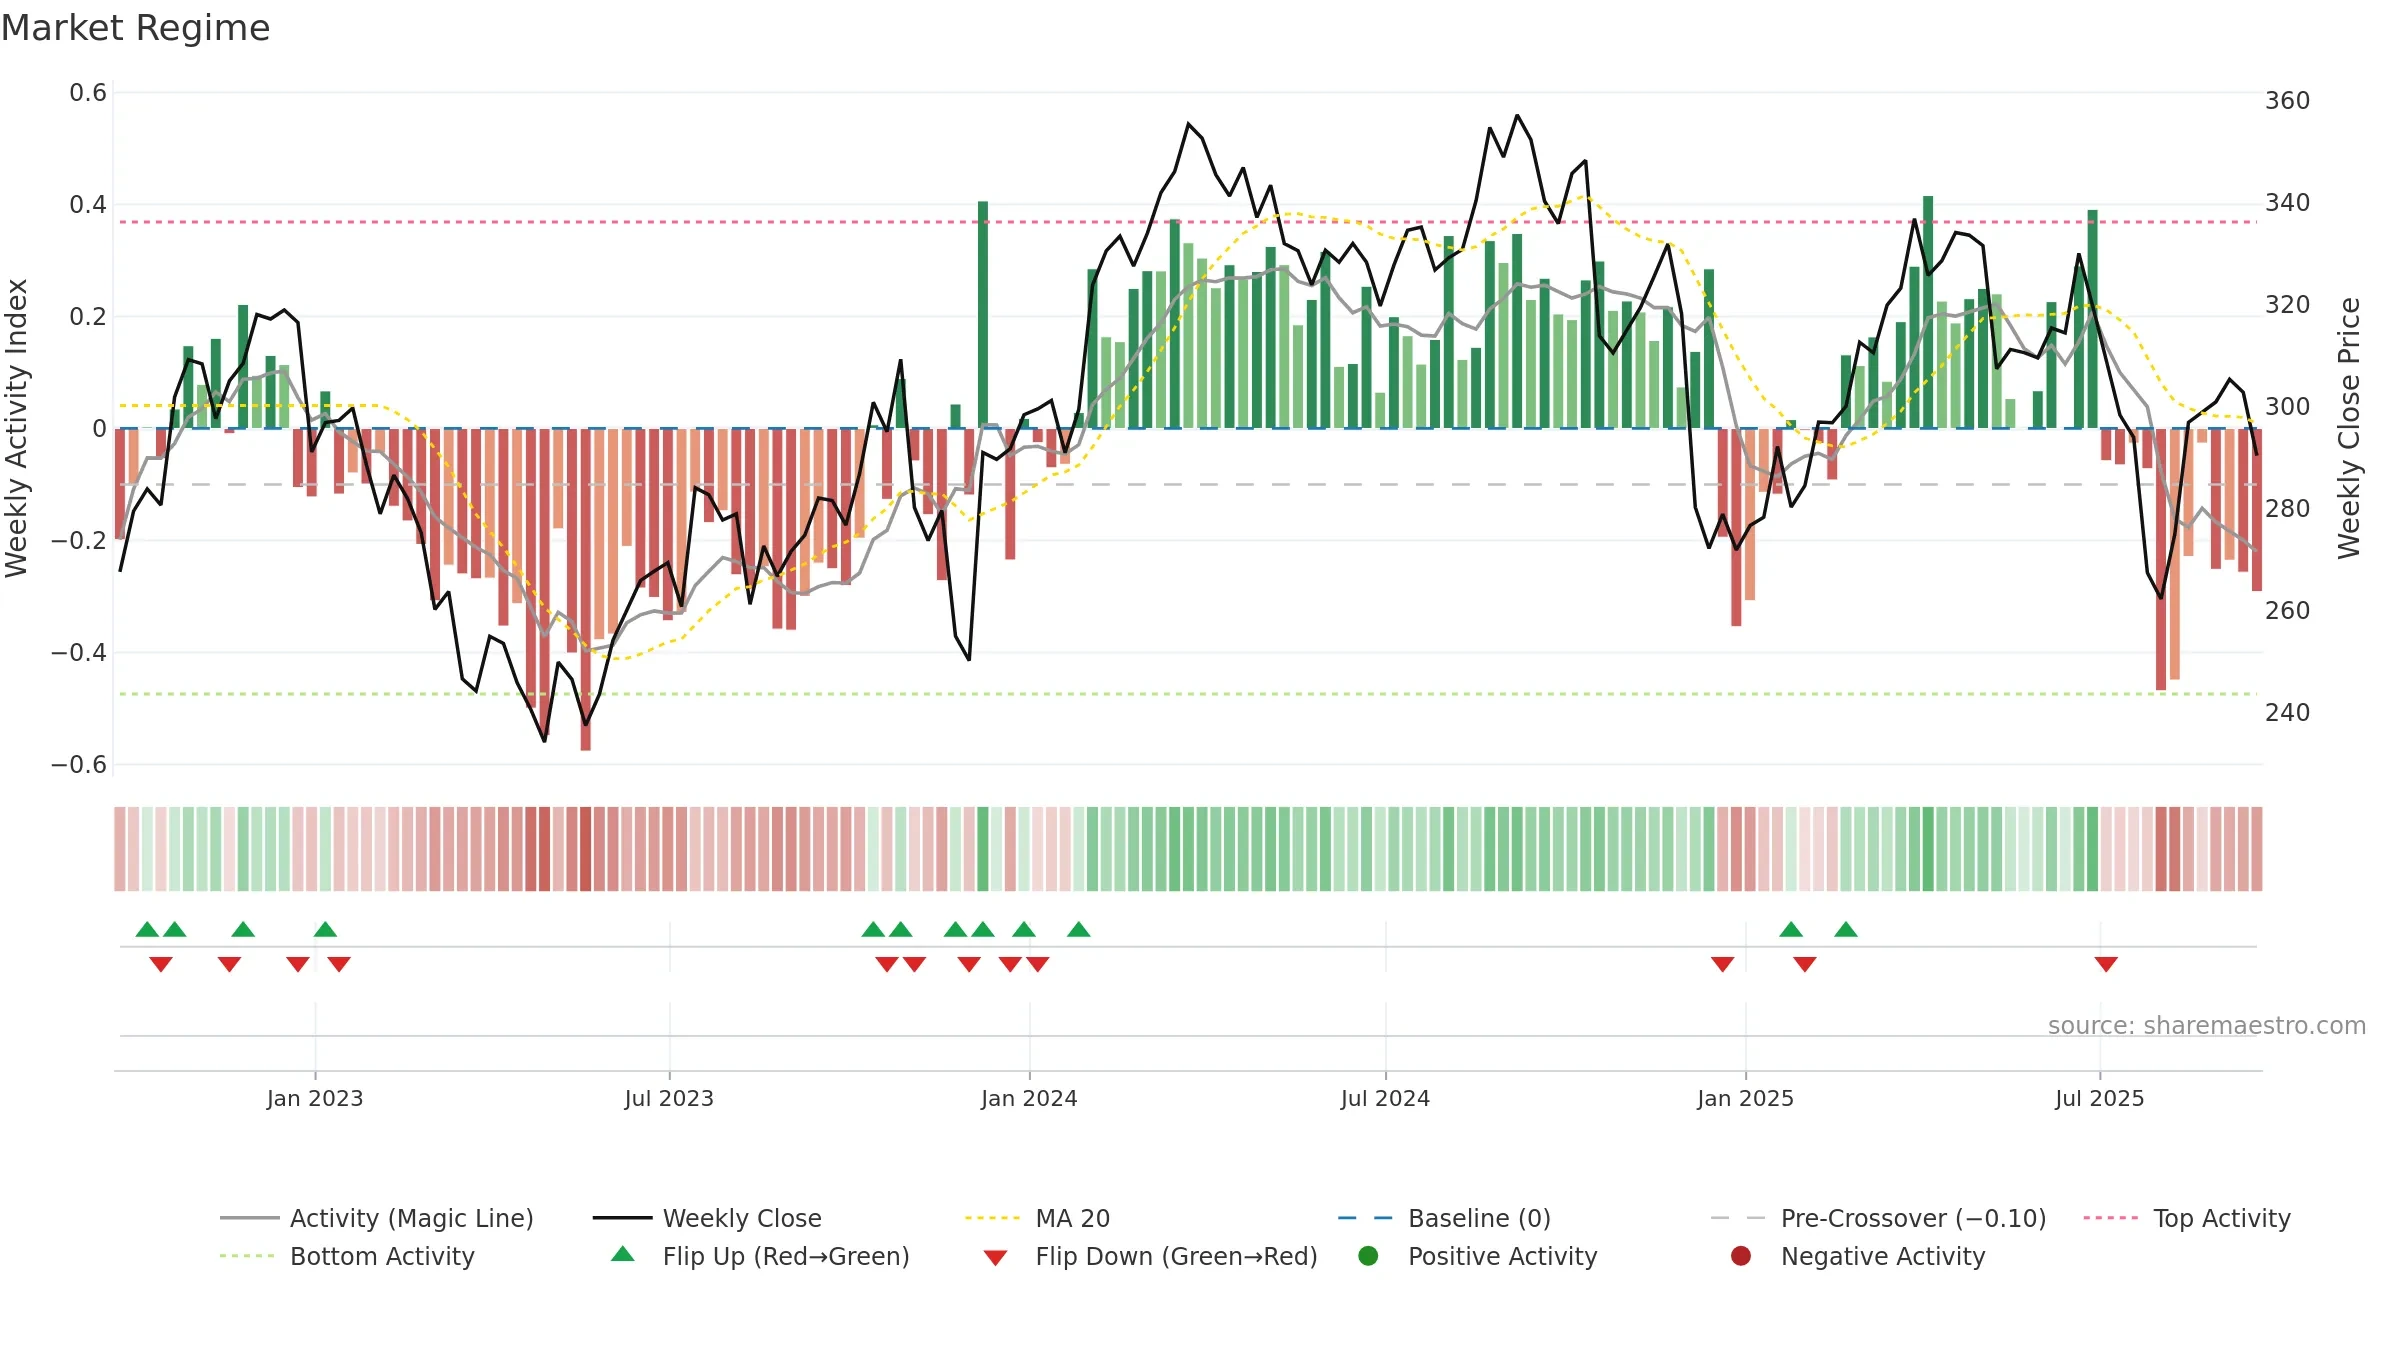
How to read this — Price slope is upward, indicating persistent buying over the window. Low weekly volatility favours steadier follow-through. Volume trend diverges from price — watch for fatigue or rotation. Returns are negatively correlated with volume — strength may come on lighter activity. Distance to baseline is narrowing — reverting closer to its fair-value track. Price sits below key averages, keeping pressure on the tape.
Up-slope supports buying interest; pullbacks may be contained if activity stays firm. Because liquidity isn’t confirming, prefer evidence of fresh demand before chasing moves.
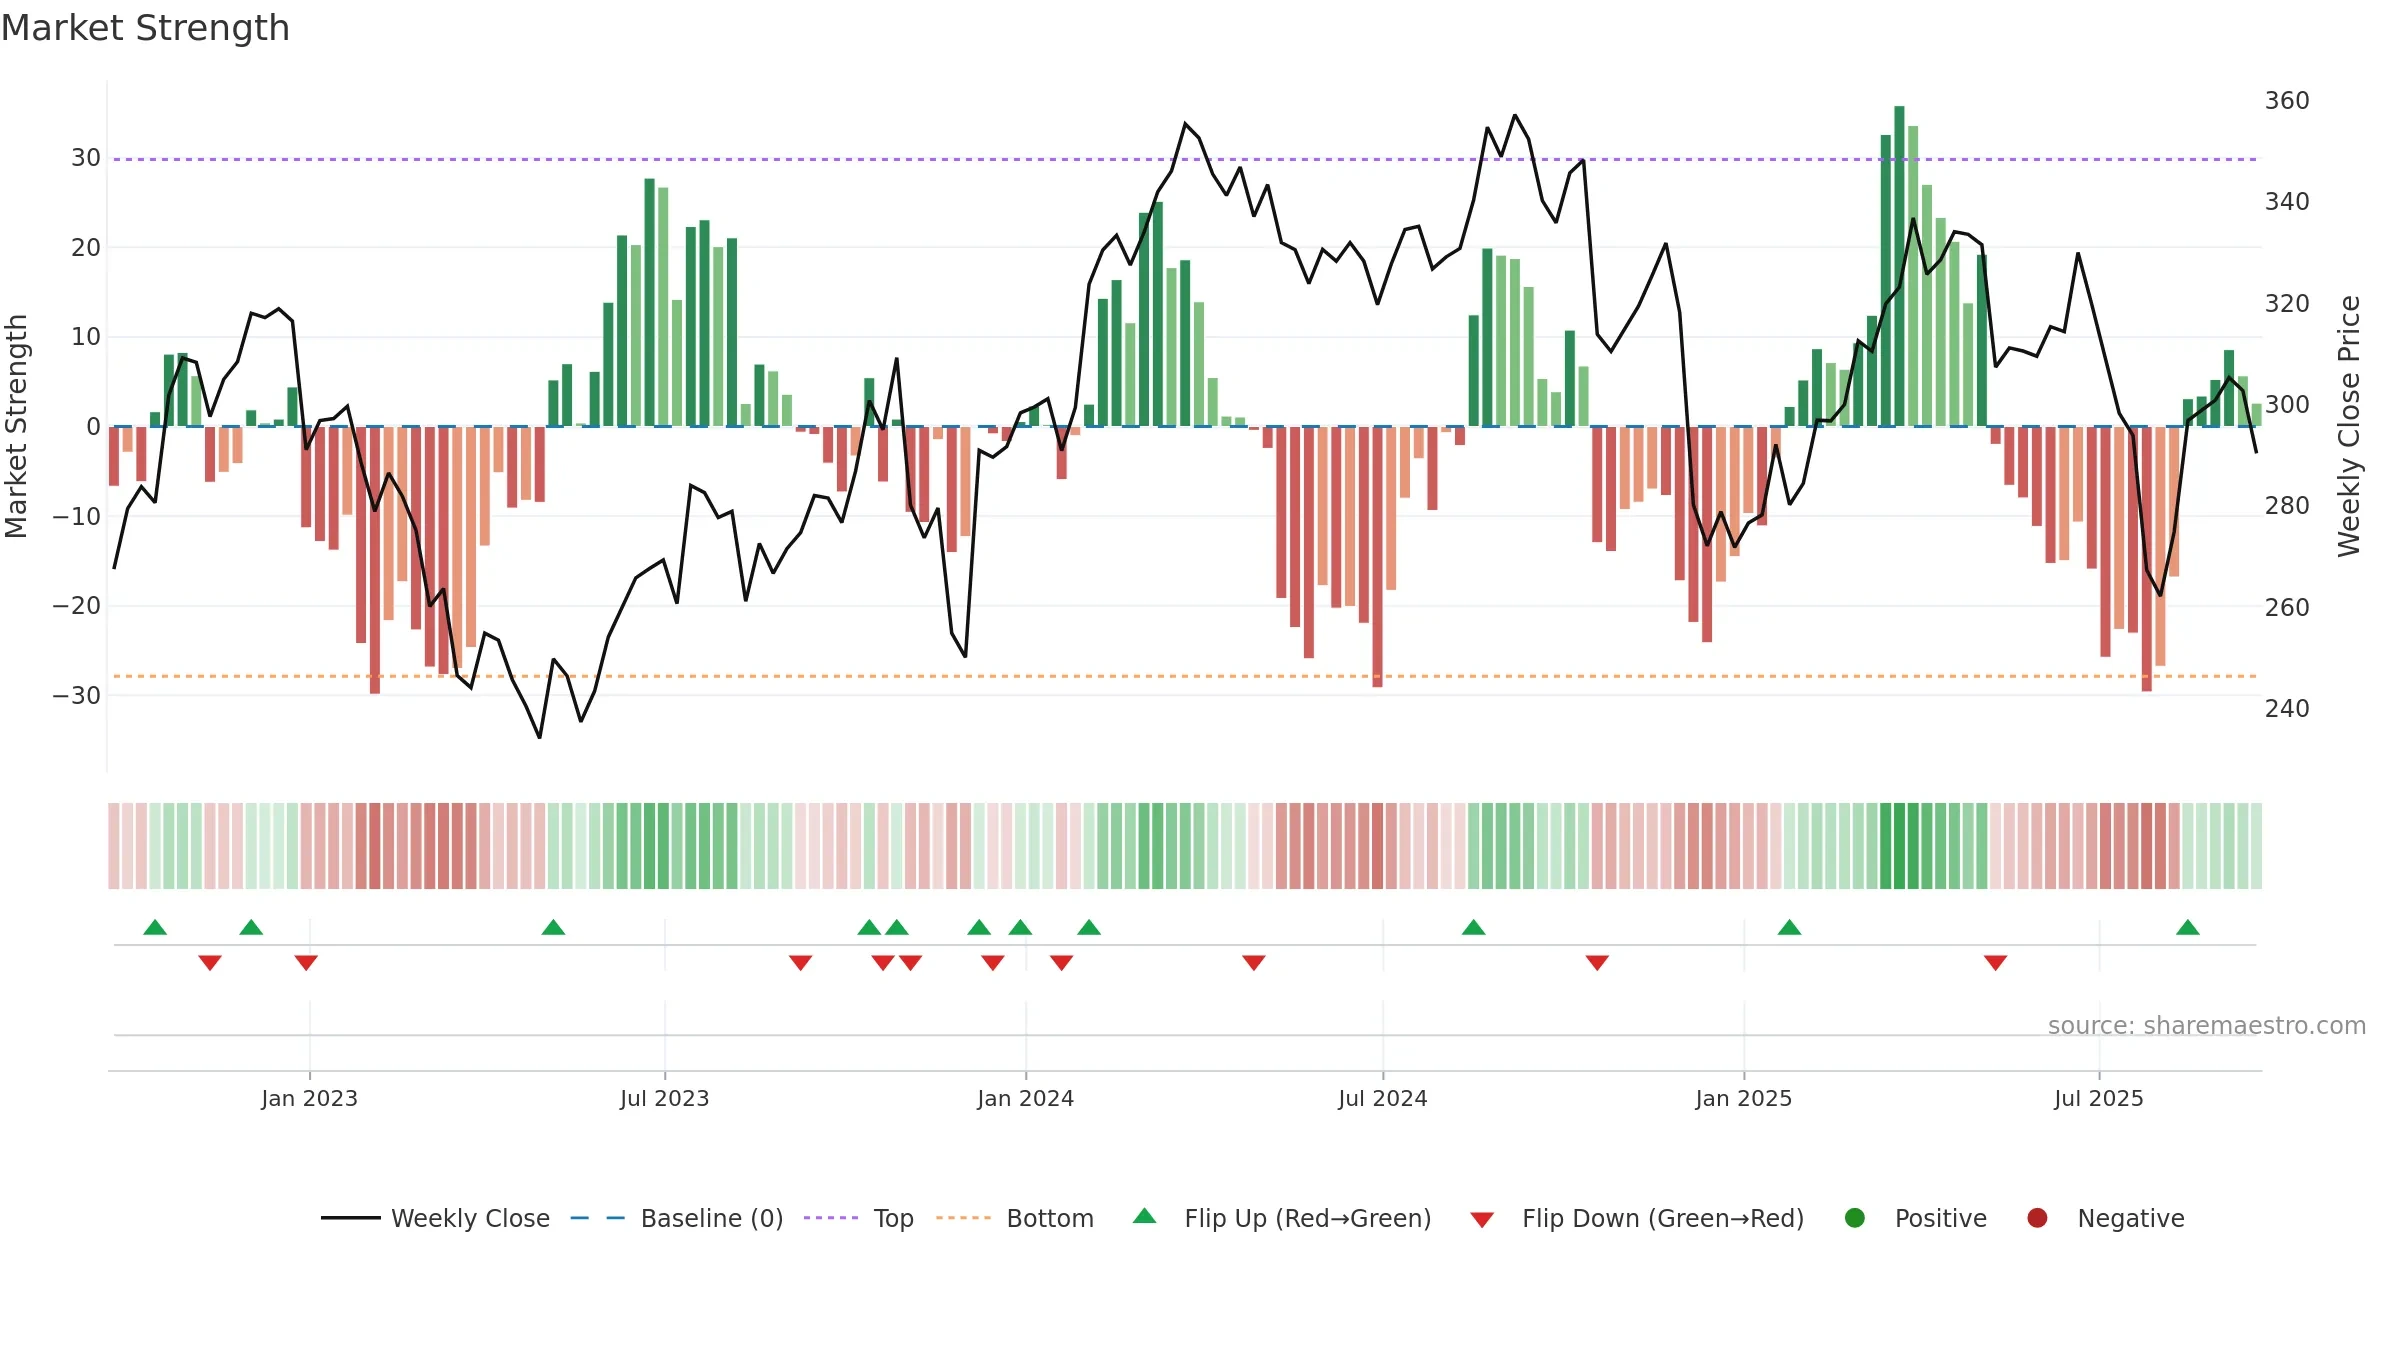
Gauge maps the trend signal to a 0–100 scale.
How to read this — Bearish zone with falling momentum — sellers in control.
Bias remains lower; rallies are suspect unless gauge reclaims 0.50/0.60.
Conclusion
Negative setup. ★★☆☆☆ confidence. Price window: 10. Trend: Downtrend Confirmed; gauge 18. In combination, liquidity diverges from price.
- Low return volatility supports durability
- Solid multi-week performance
- Buyers step in at depressed levels (accumulation)
- Bearish control with falling momentum
- Momentum is weak/falling
- Price is not above key averages
- Liquidity diverges from price
Why: Price window 10.73% over 8w. Close is -4.90% below the prior-window high. Return volatility 1.31%. Volume trend falling. Liquidity divergence with price. Trend state downtrend confirmed. Low-regime (≤0.25) upticks 2/3 (67.0%) • Accumulating. Momentum bearish and falling.
Tip: Most metrics include a hover tooltip where they appear in the report.