Sprott Inc.
SII NYSE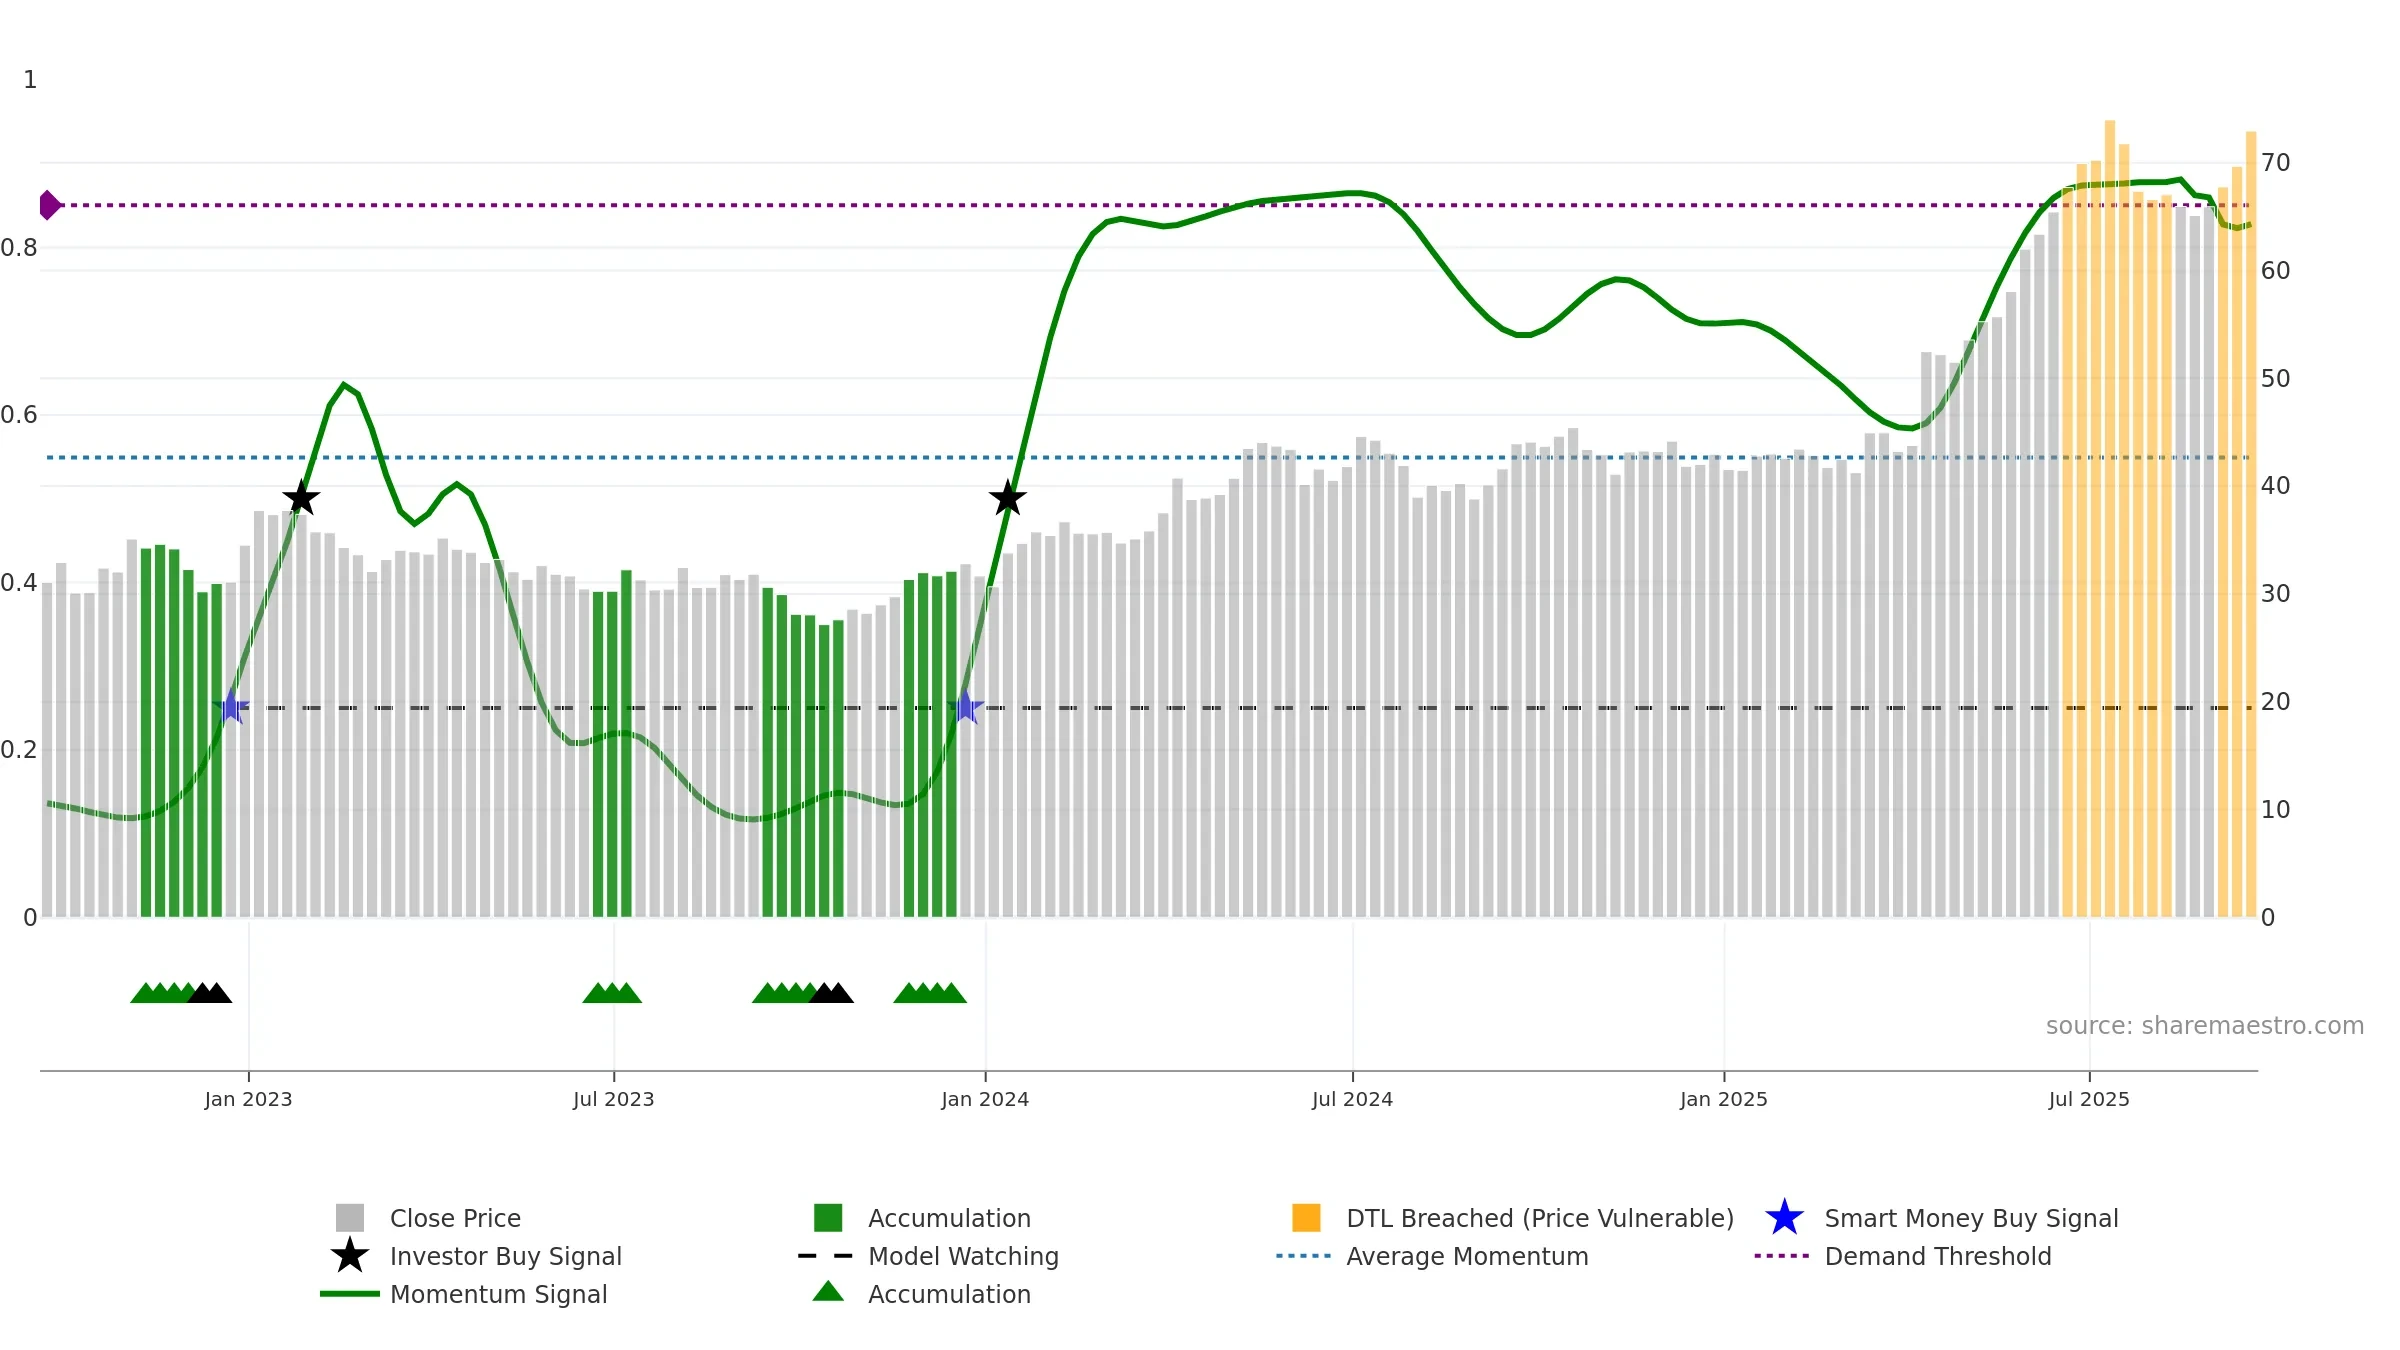
Weekly Summary
Sprott Inc. closed at 72.9400 (0.72% WoW) . Data window ends Fri, 19 Sep 2025.
How to read this — Price slope is upward, indicating persistent buying over the window. Low weekly volatility favours steadier follow-through. Volume trend diverges from price — watch for fatigue or rotation. Returns are positively correlated with volume — strength tends to arrive on higher activity. Distance to baseline is narrowing — reverting closer to its fair-value track. Price holds above key averages, indicating constructive participation.
Up-slope supports buying interest; pullbacks may be contained if activity stays firm. Because liquidity isn’t confirming, prefer evidence of fresh demand before chasing moves.
Gauge maps the trend signal to a 0–100 scale.
How to read this — Gauge is elevated but momentum is rolling over; topping risk is rising.
Stay alert: protect gains or seek confirmation before adding risk.

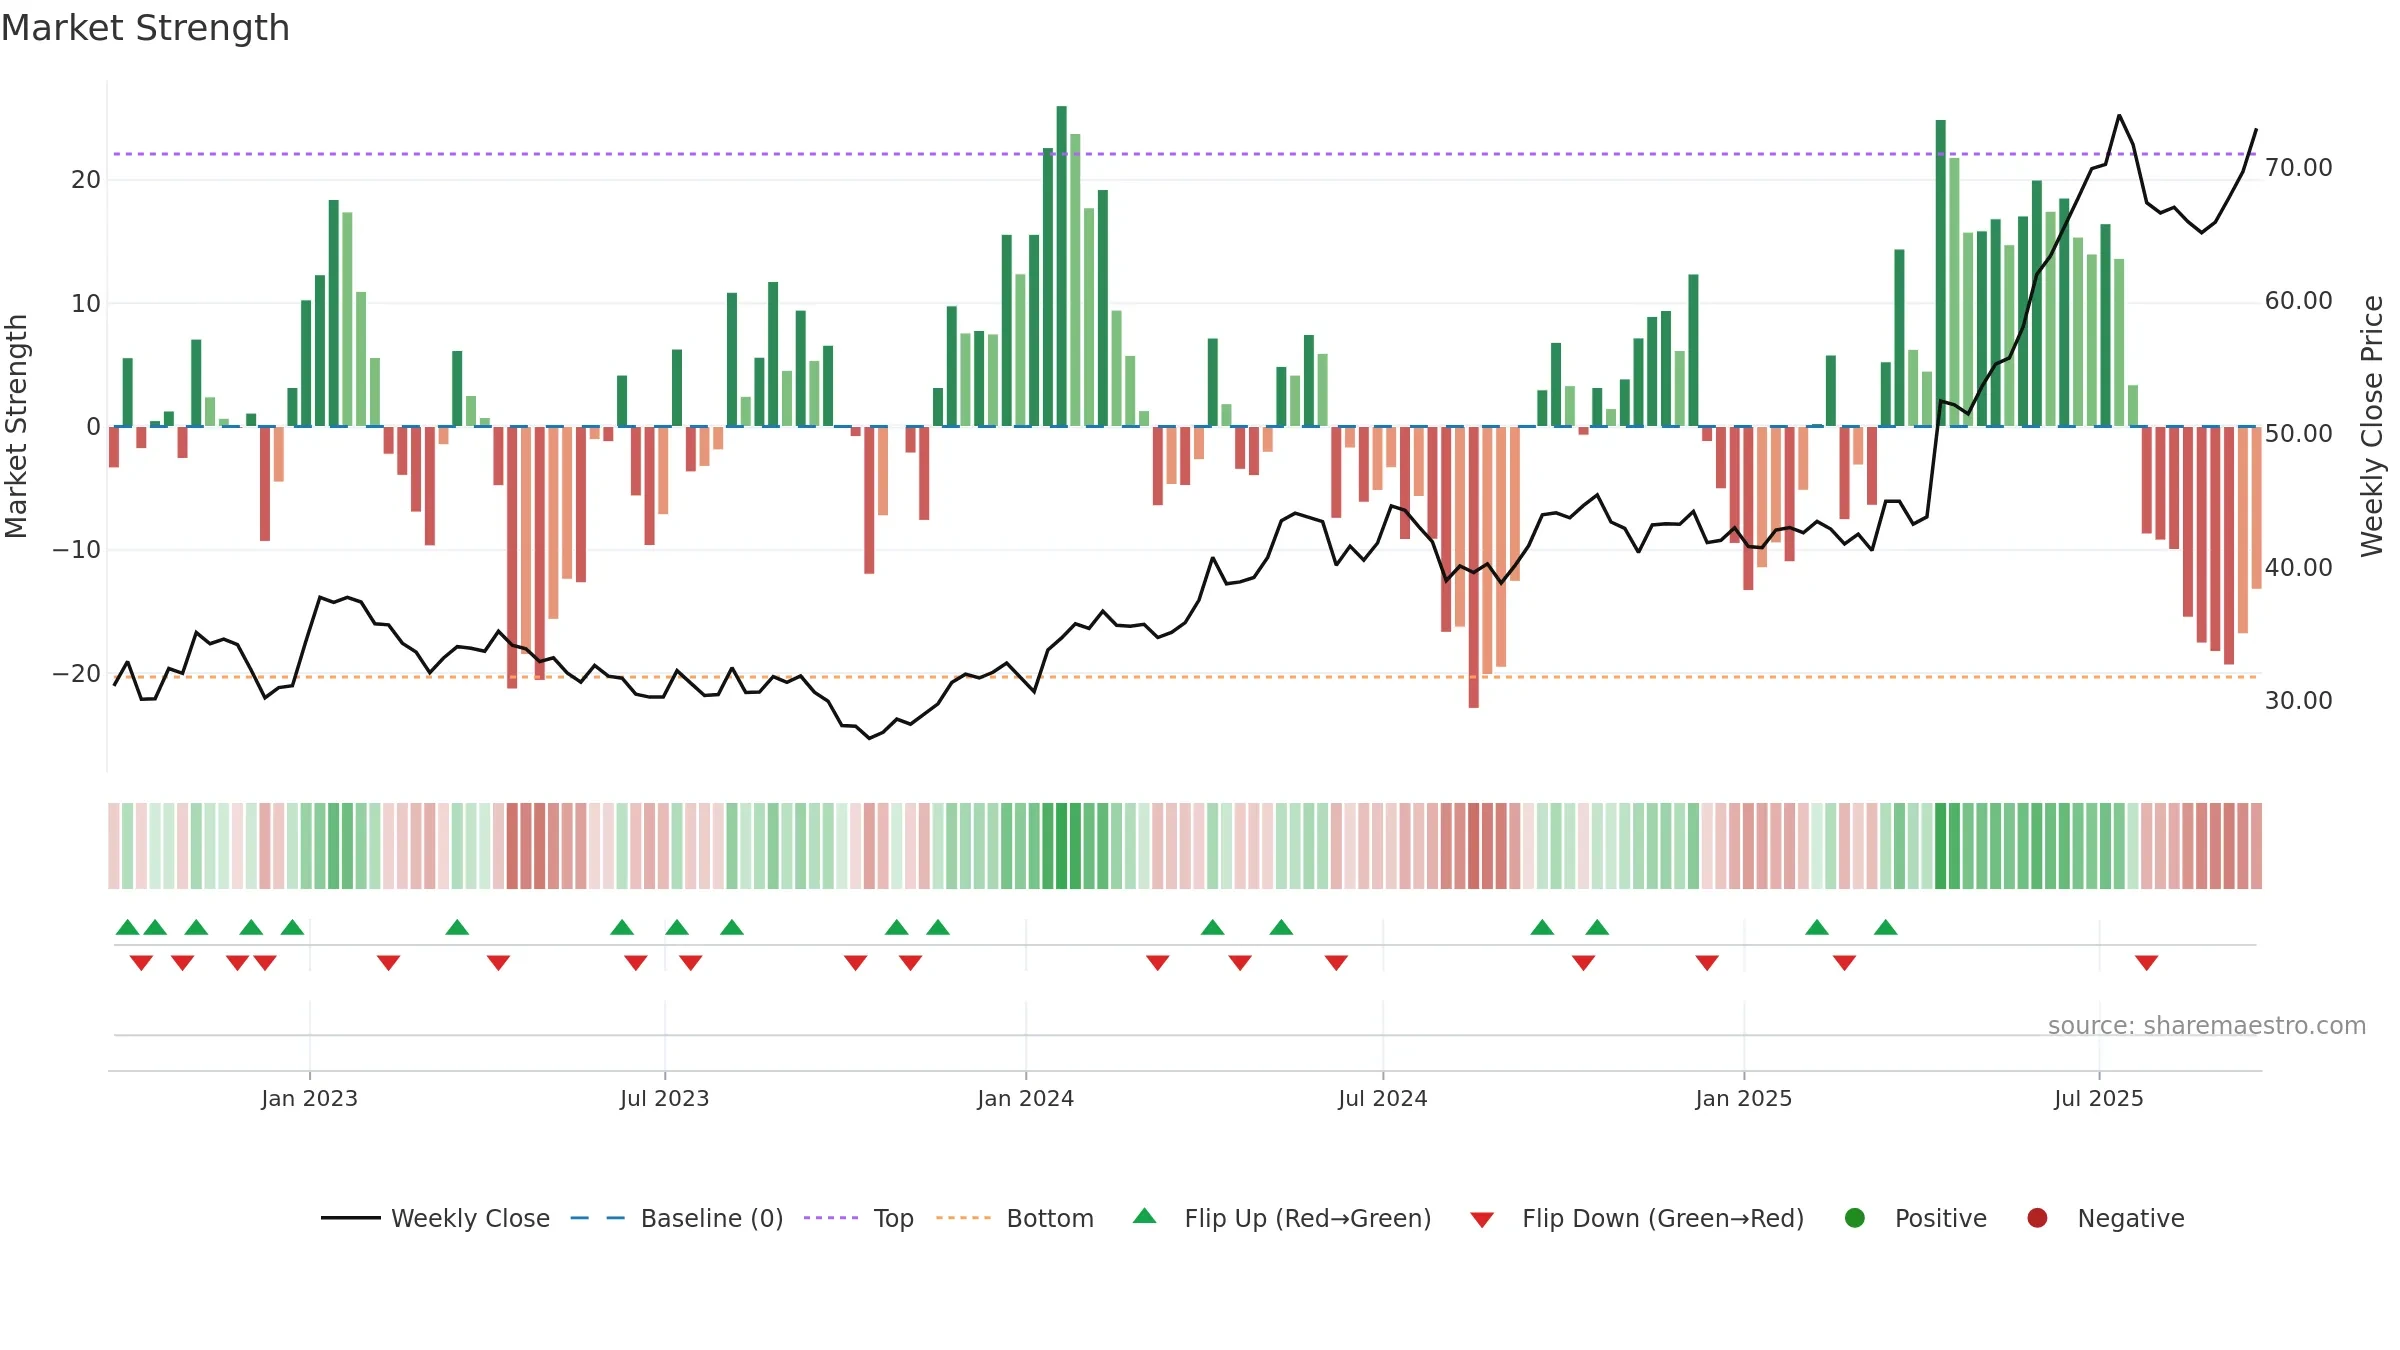
Relative strength is Positive
(> 0%, outperforming).
Latest MRS: 17.69% (week ending Fri, 19 Sep 2025).
Slope: Falling over 8w.
Notes:
- Holding above the zero line indicates relative bid.
- MRS slope falling over ~8 weeks.
Price is above fair value; upside may be capped without catalysts.
Conclusion
Negative setup. ★★☆☆☆ confidence. Price window: 9. Trend: Uptrend at Risk; gauge 82. In combination, liquidity diverges from price.
- Price holds above 8w & 26w averages
- Low return volatility supports durability
- High-level but rolling over (topping risk)
- Momentum is weak/falling
- Liquidity diverges from price
- Sellers active at elevated levels (distribution)
Why: Price window 9.54% over 8w. Close is 4.69% above the prior-window high. Return volatility 0.99%. Volume trend falling. Liquidity divergence with price. Trend state uptrend at risk. High-regime (0.80–1.00) downticks 5/7 (71.0%) • Distributing. Momentum neutral and falling. Valuation limited upside without catalysts.
Tip: Most metrics include a hover tooltip where they appear in the report.