Chengdu Leejun Industrial Co., Ltd.
002651 SHE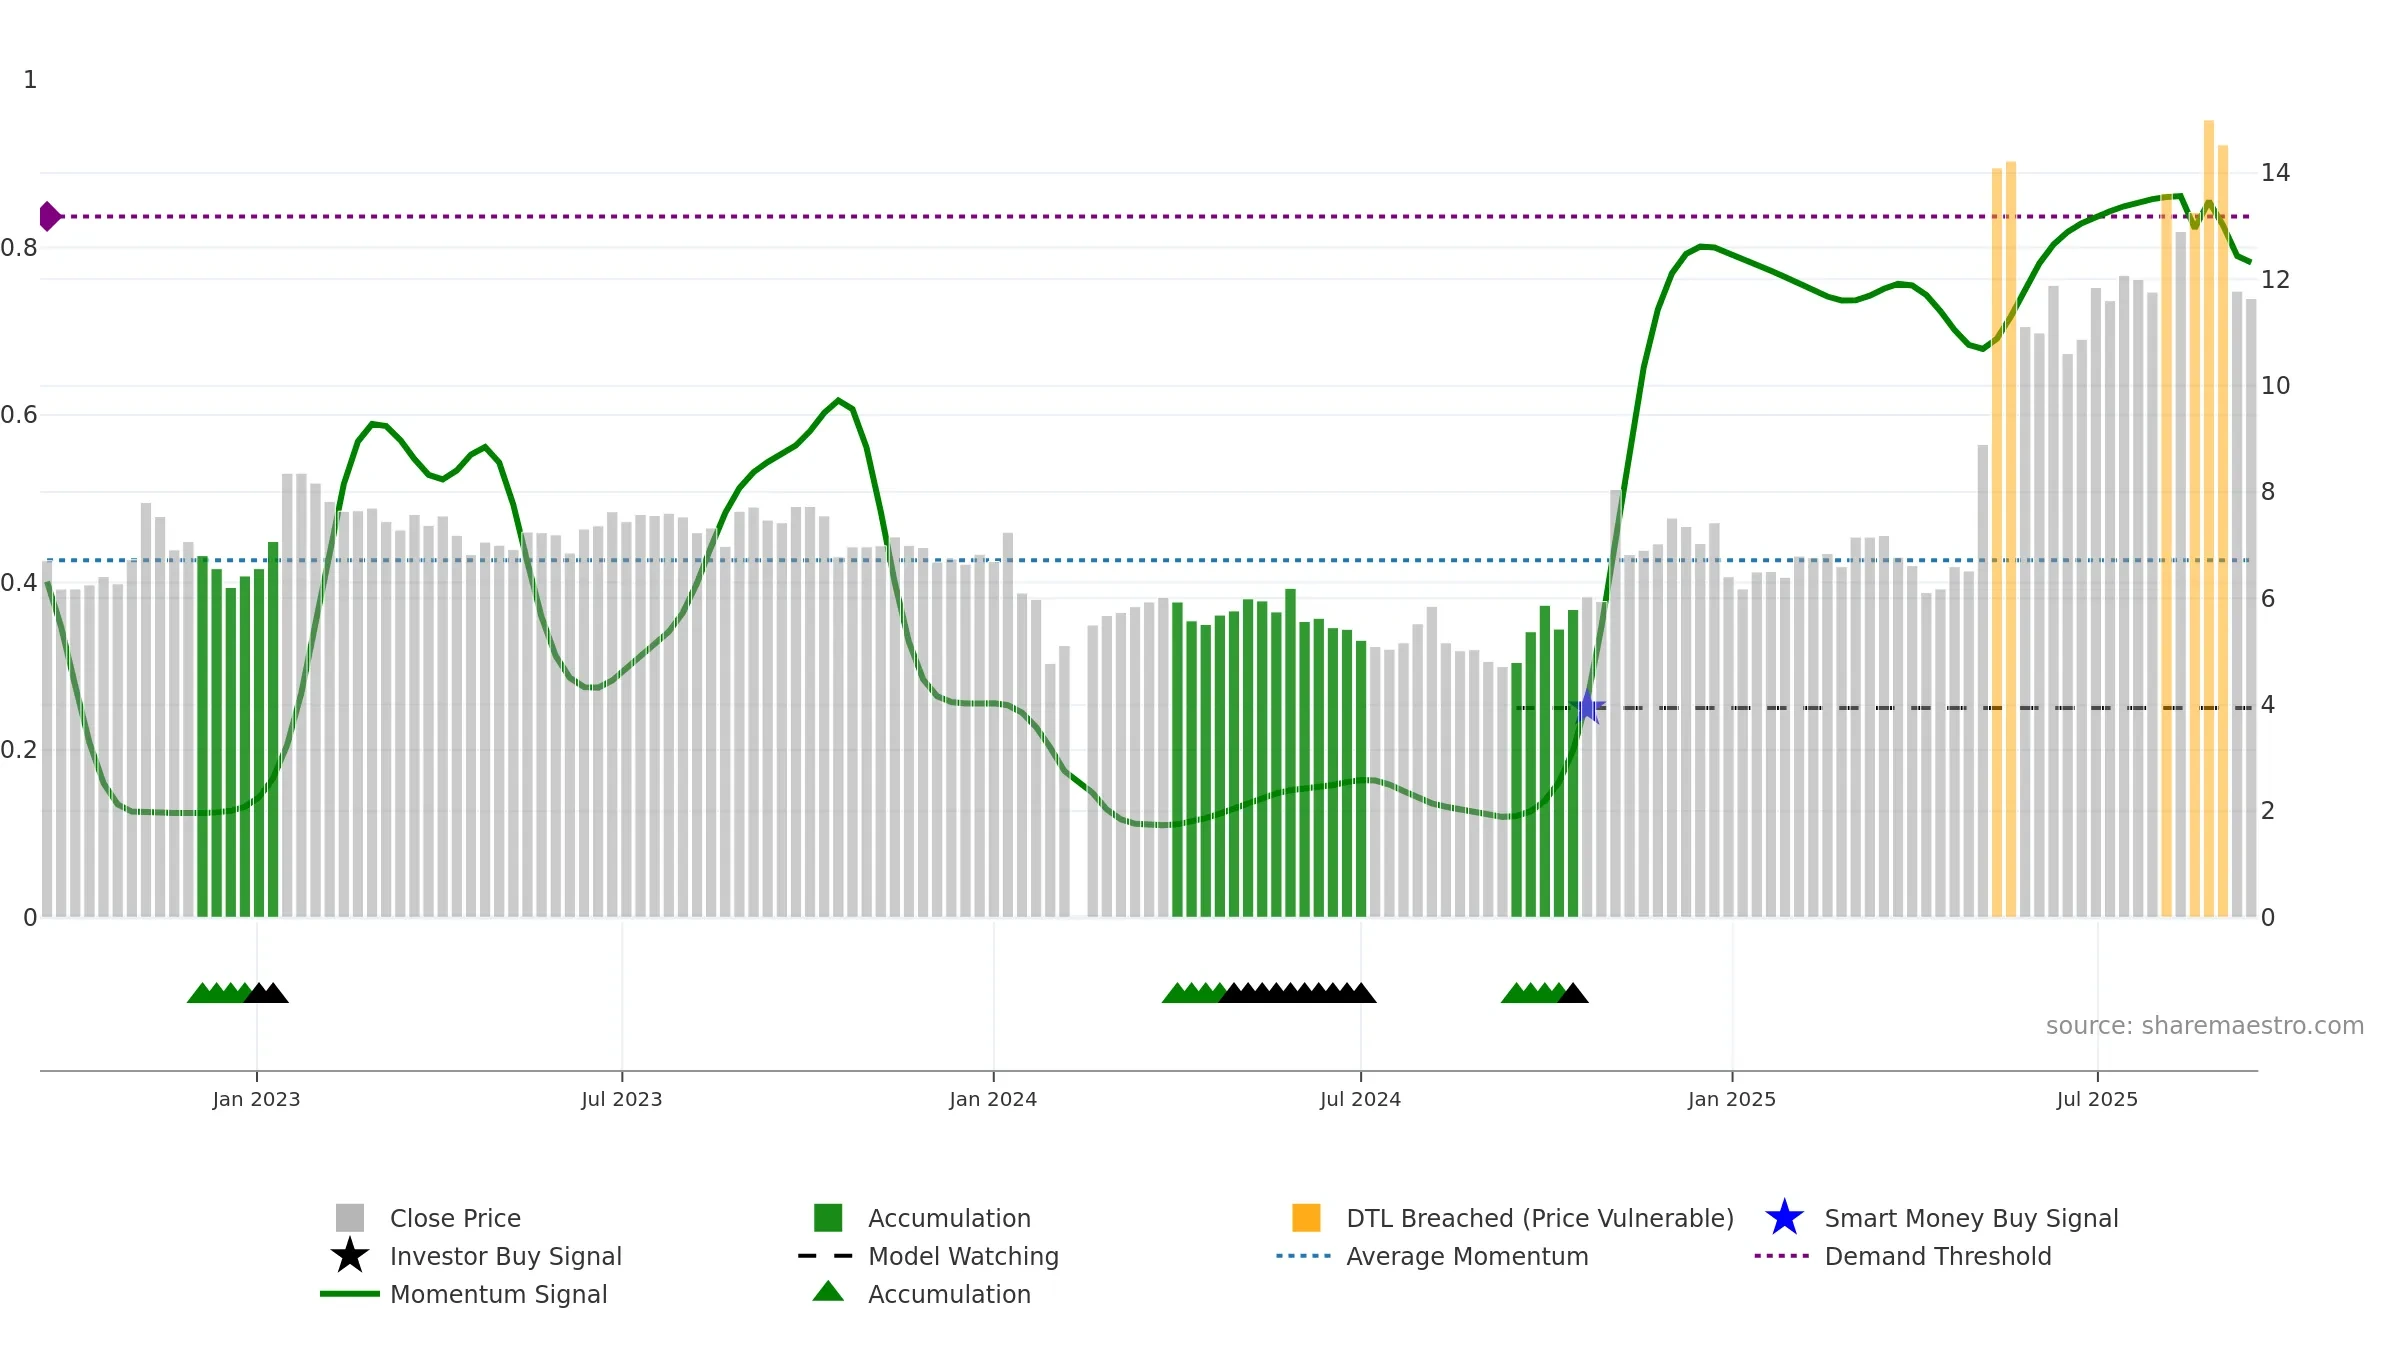
Weekly Report
Chengdu Leejun Industrial Co., Ltd. closed at 11.6400 (-1.85% WoW) . Data window ends Mon, 15 Sep 2025.
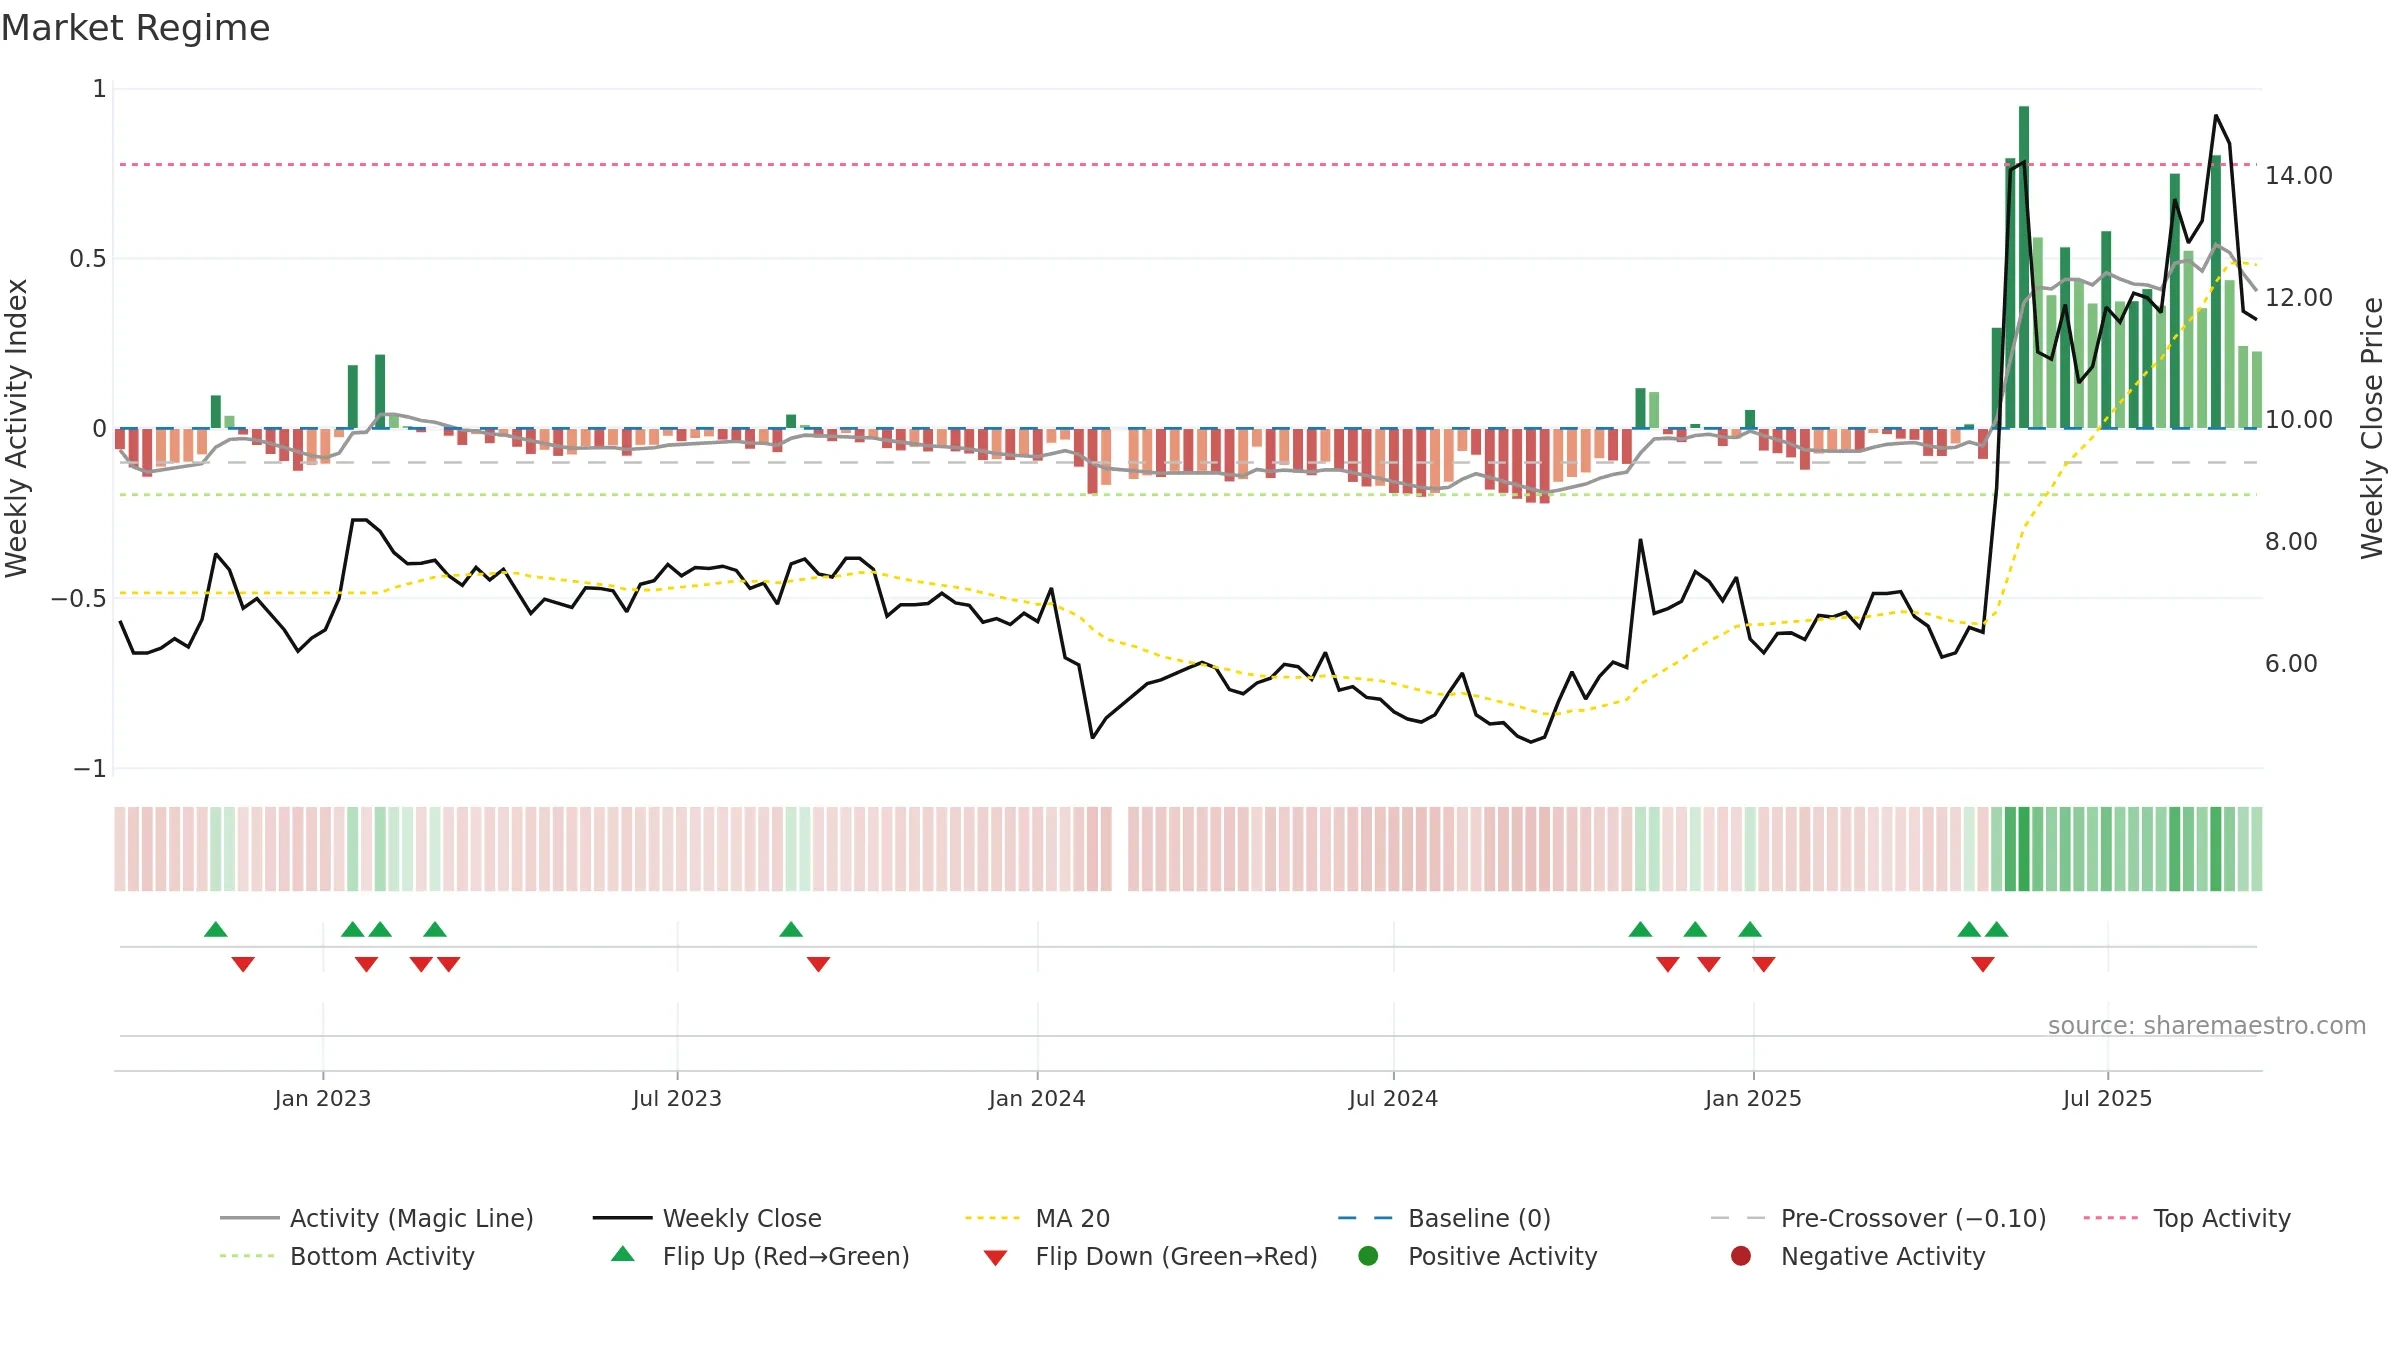
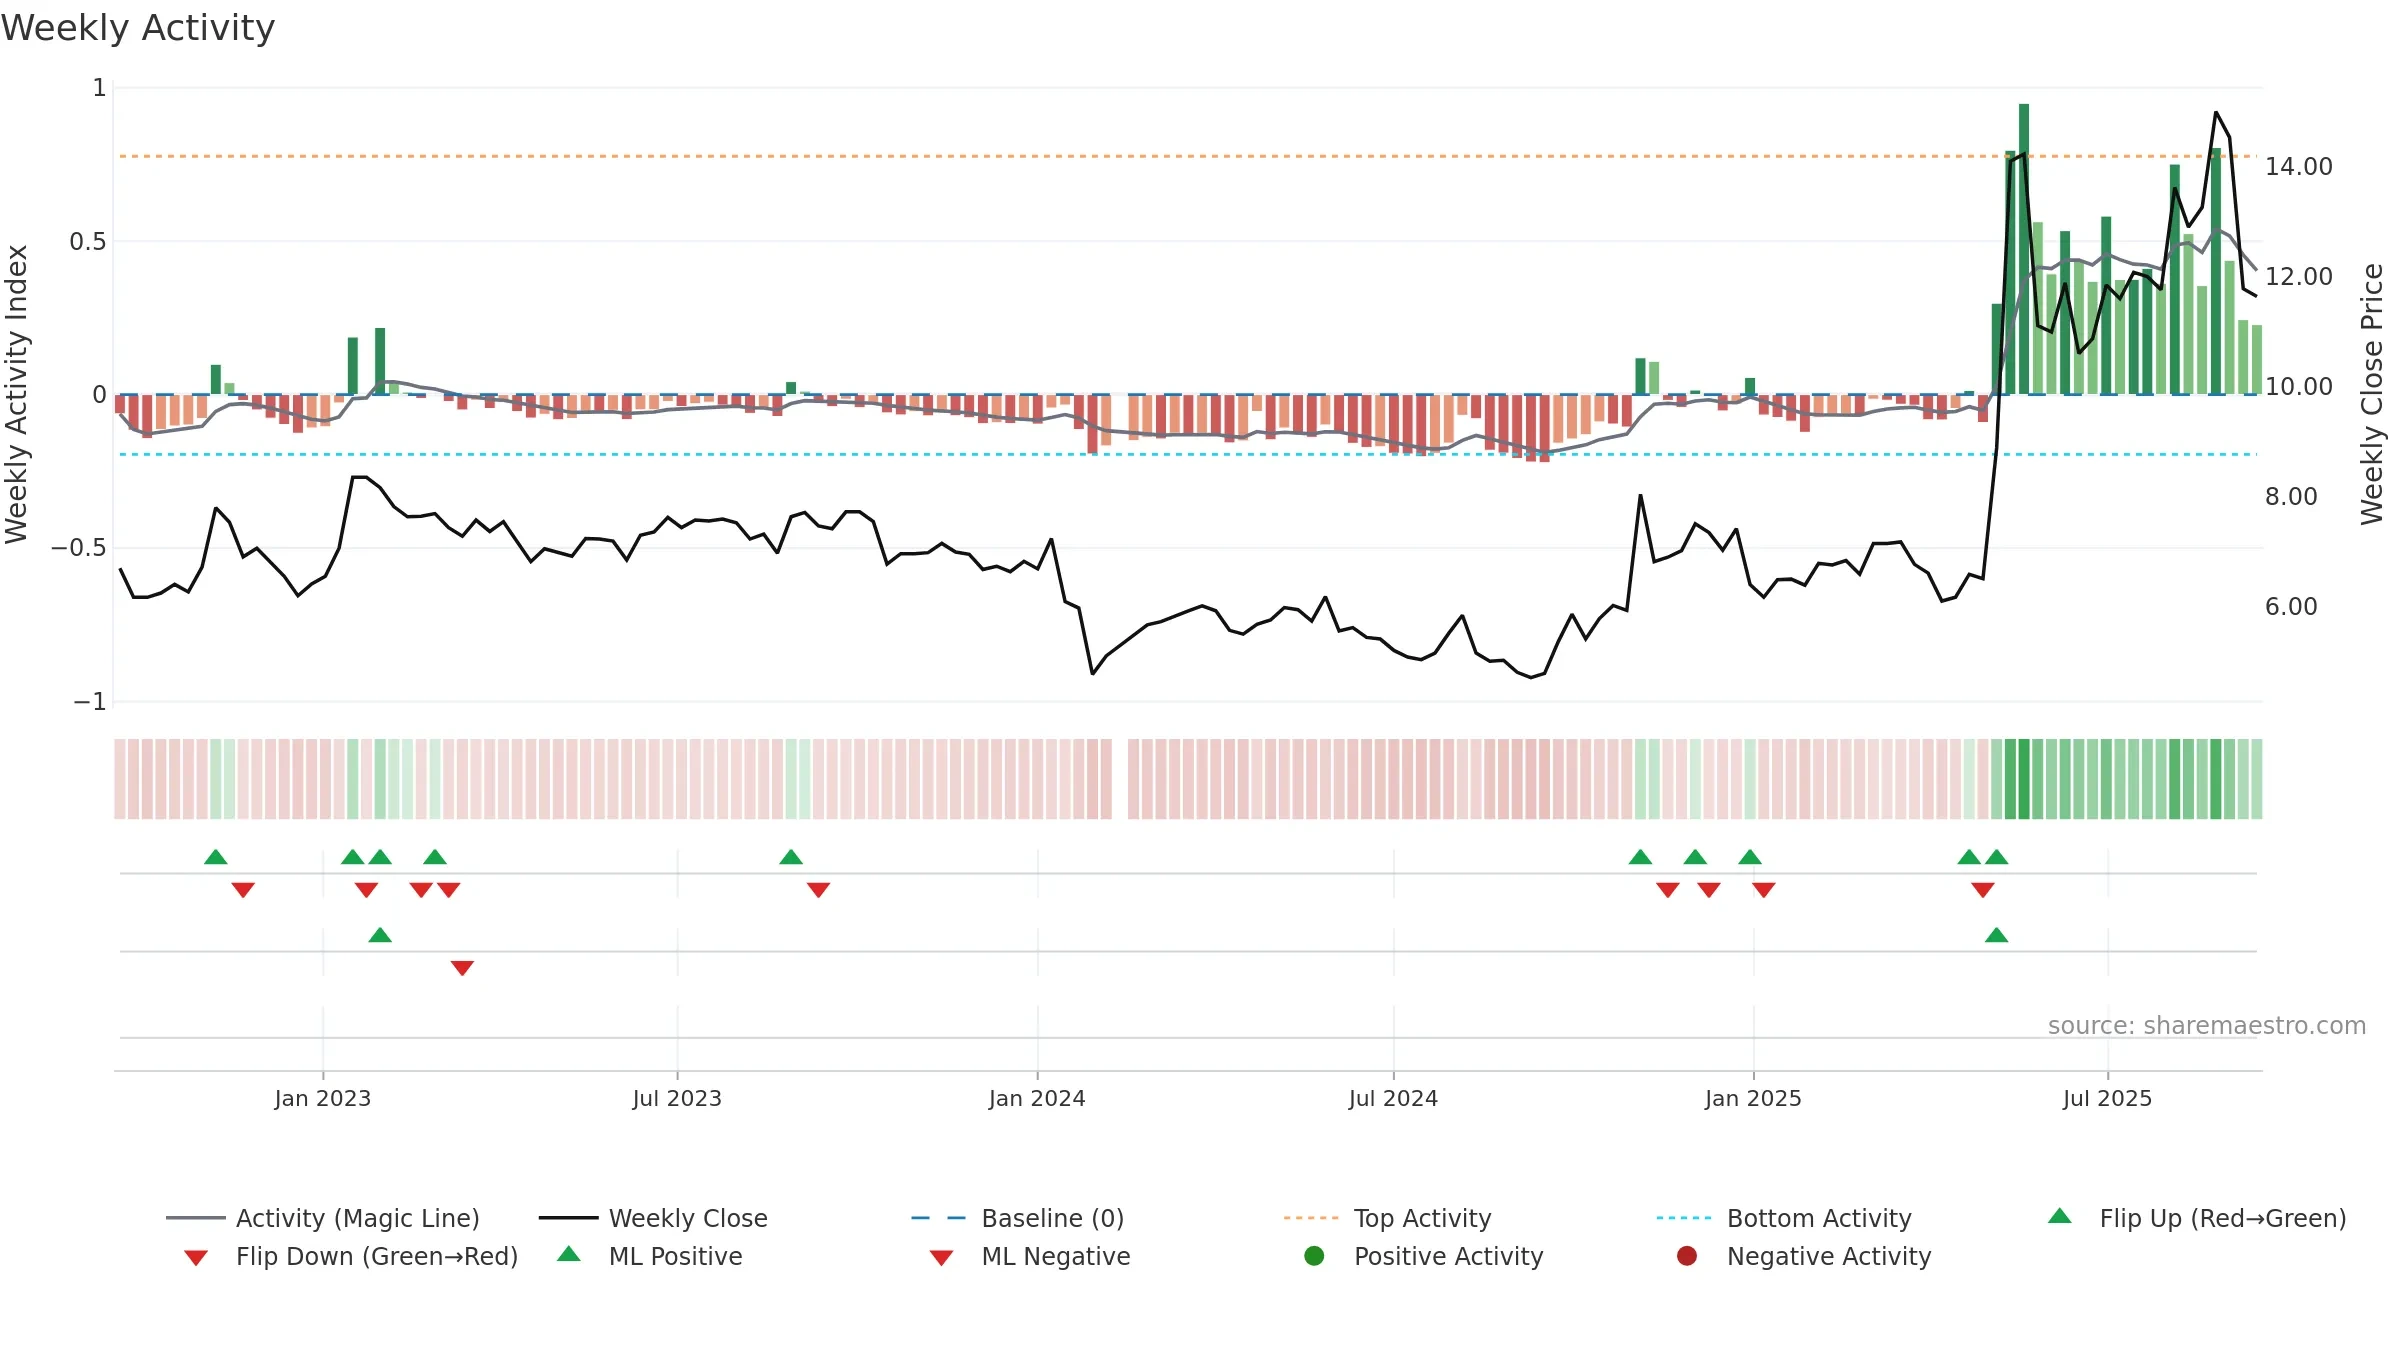
How to read this — Price slope is downward, indicating persistent supply pressure. Elevated weekly volatility increases whipsaw risk. Volume and price are moving in the same direction — a constructive confirmation. Constructive MA stack supports the up-drift; pullbacks may find support at the 8–13 week region.
Down-slope argues for patience; rallies can fade sooner unless participation improves.
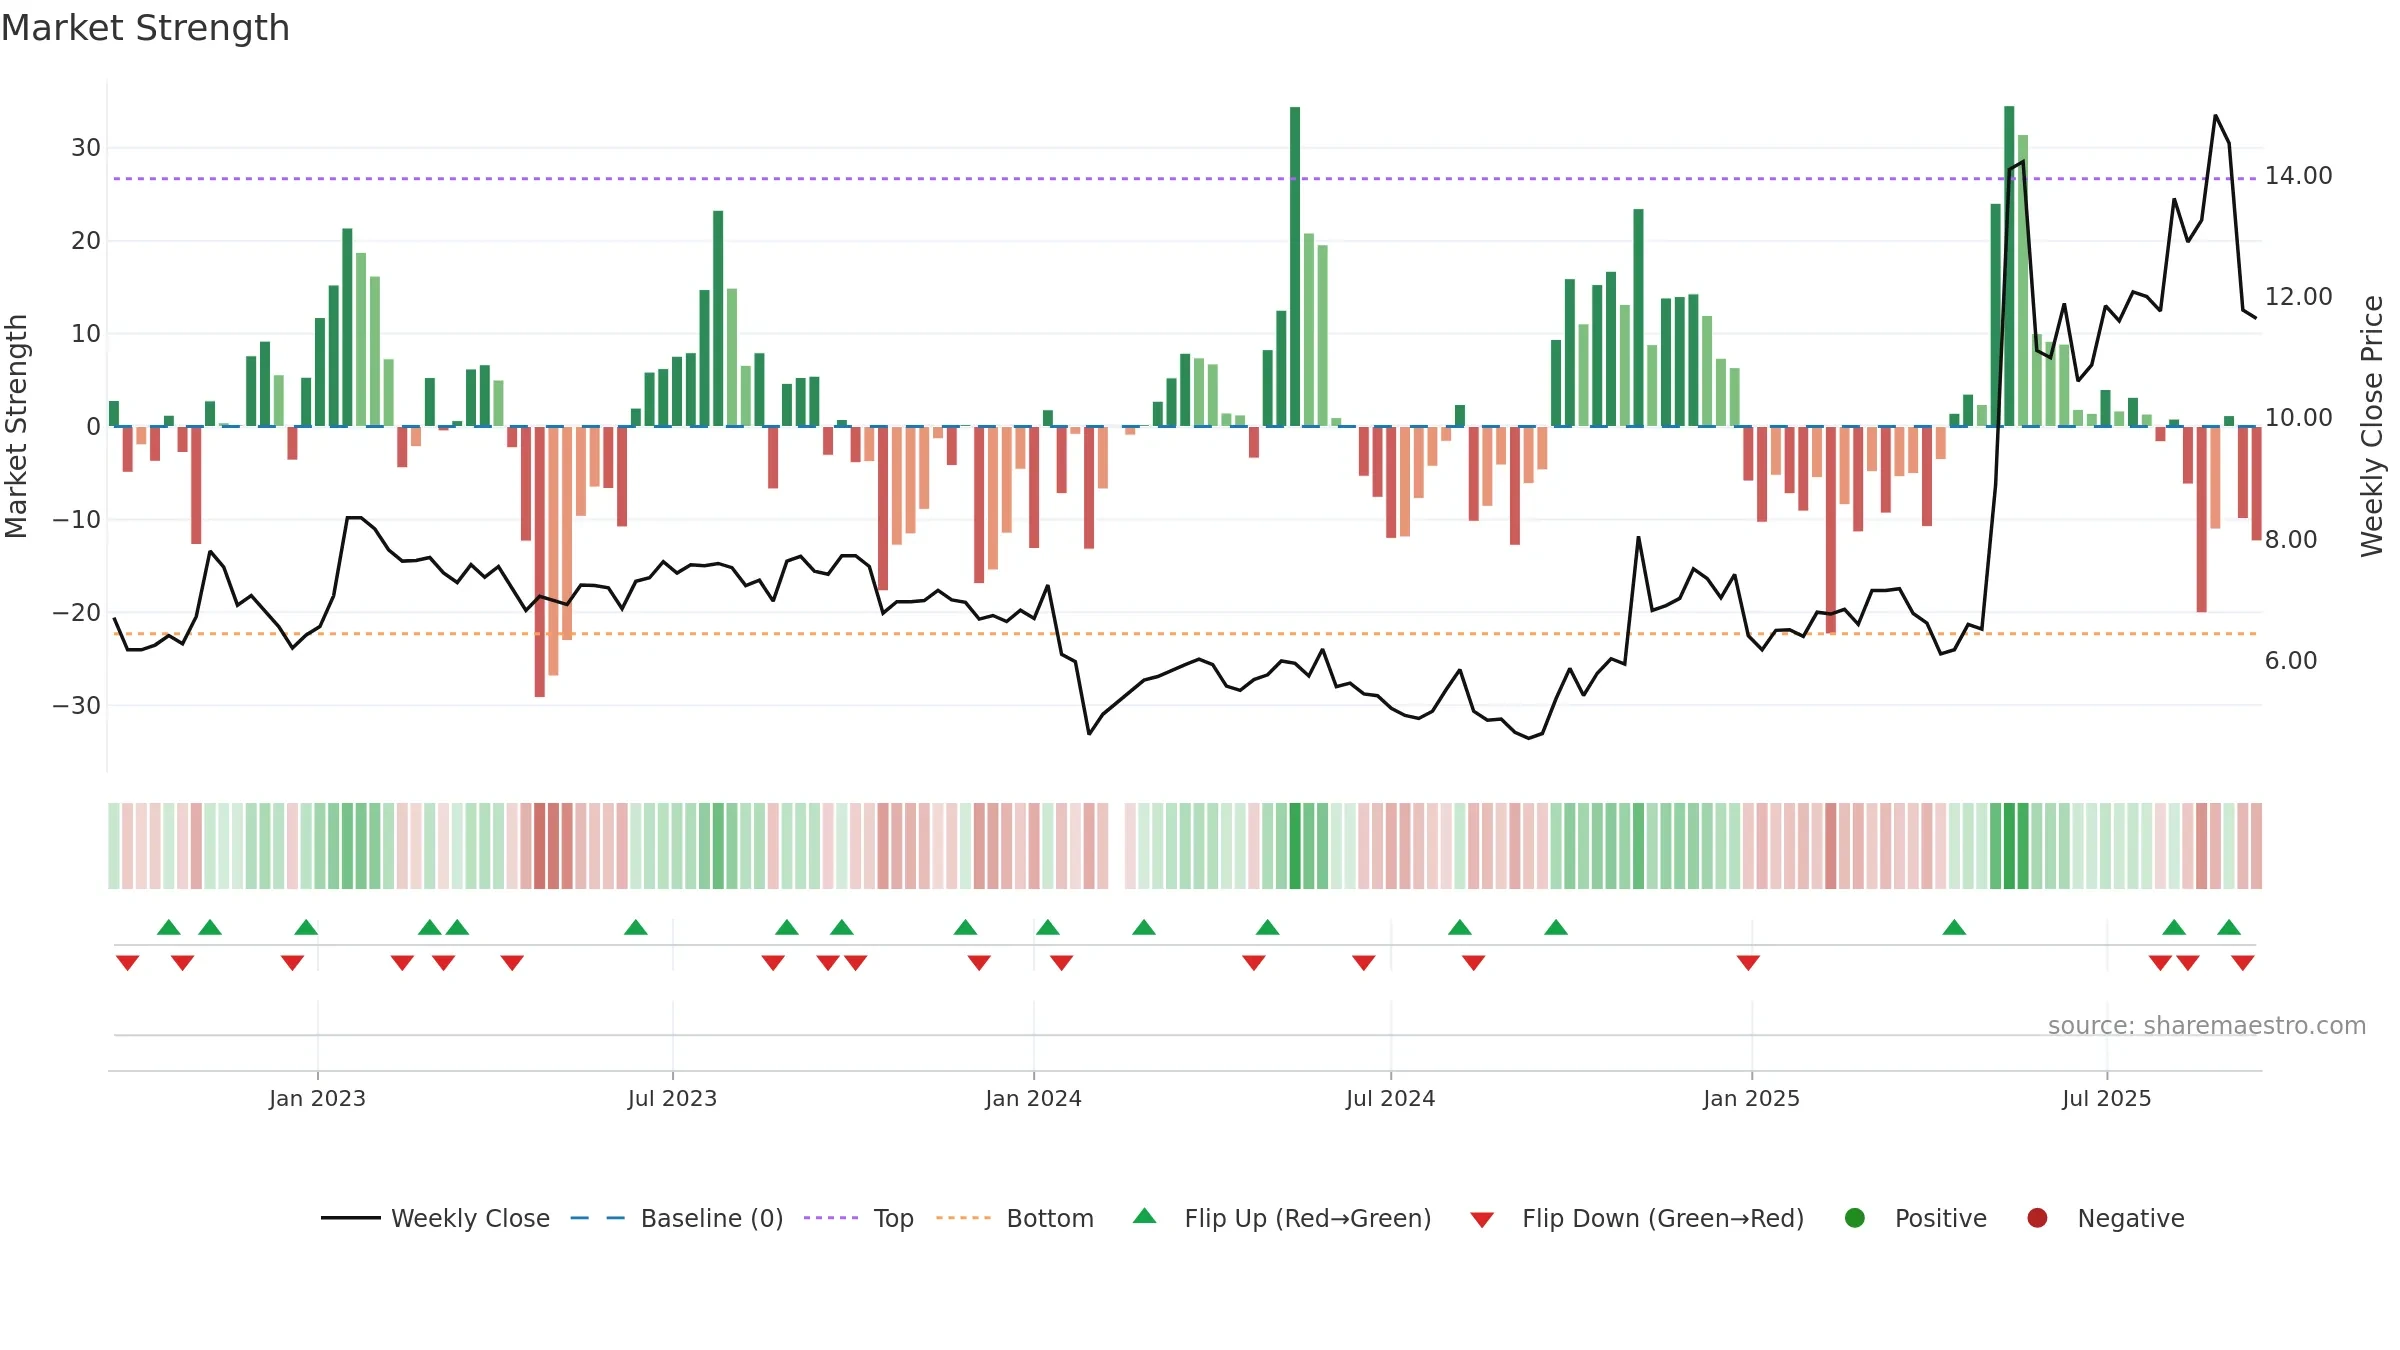
Gauge maps the trend signal to a 0–100 scale.
How to read this — Gauge is elevated but momentum is rolling over; topping risk is rising. Notable breakdown from ≥0.80 weakens trend quality.
Stay alert: protect gains or seek confirmation before adding risk.
Price is above fair value; upside may be capped without catalysts.
Conclusion
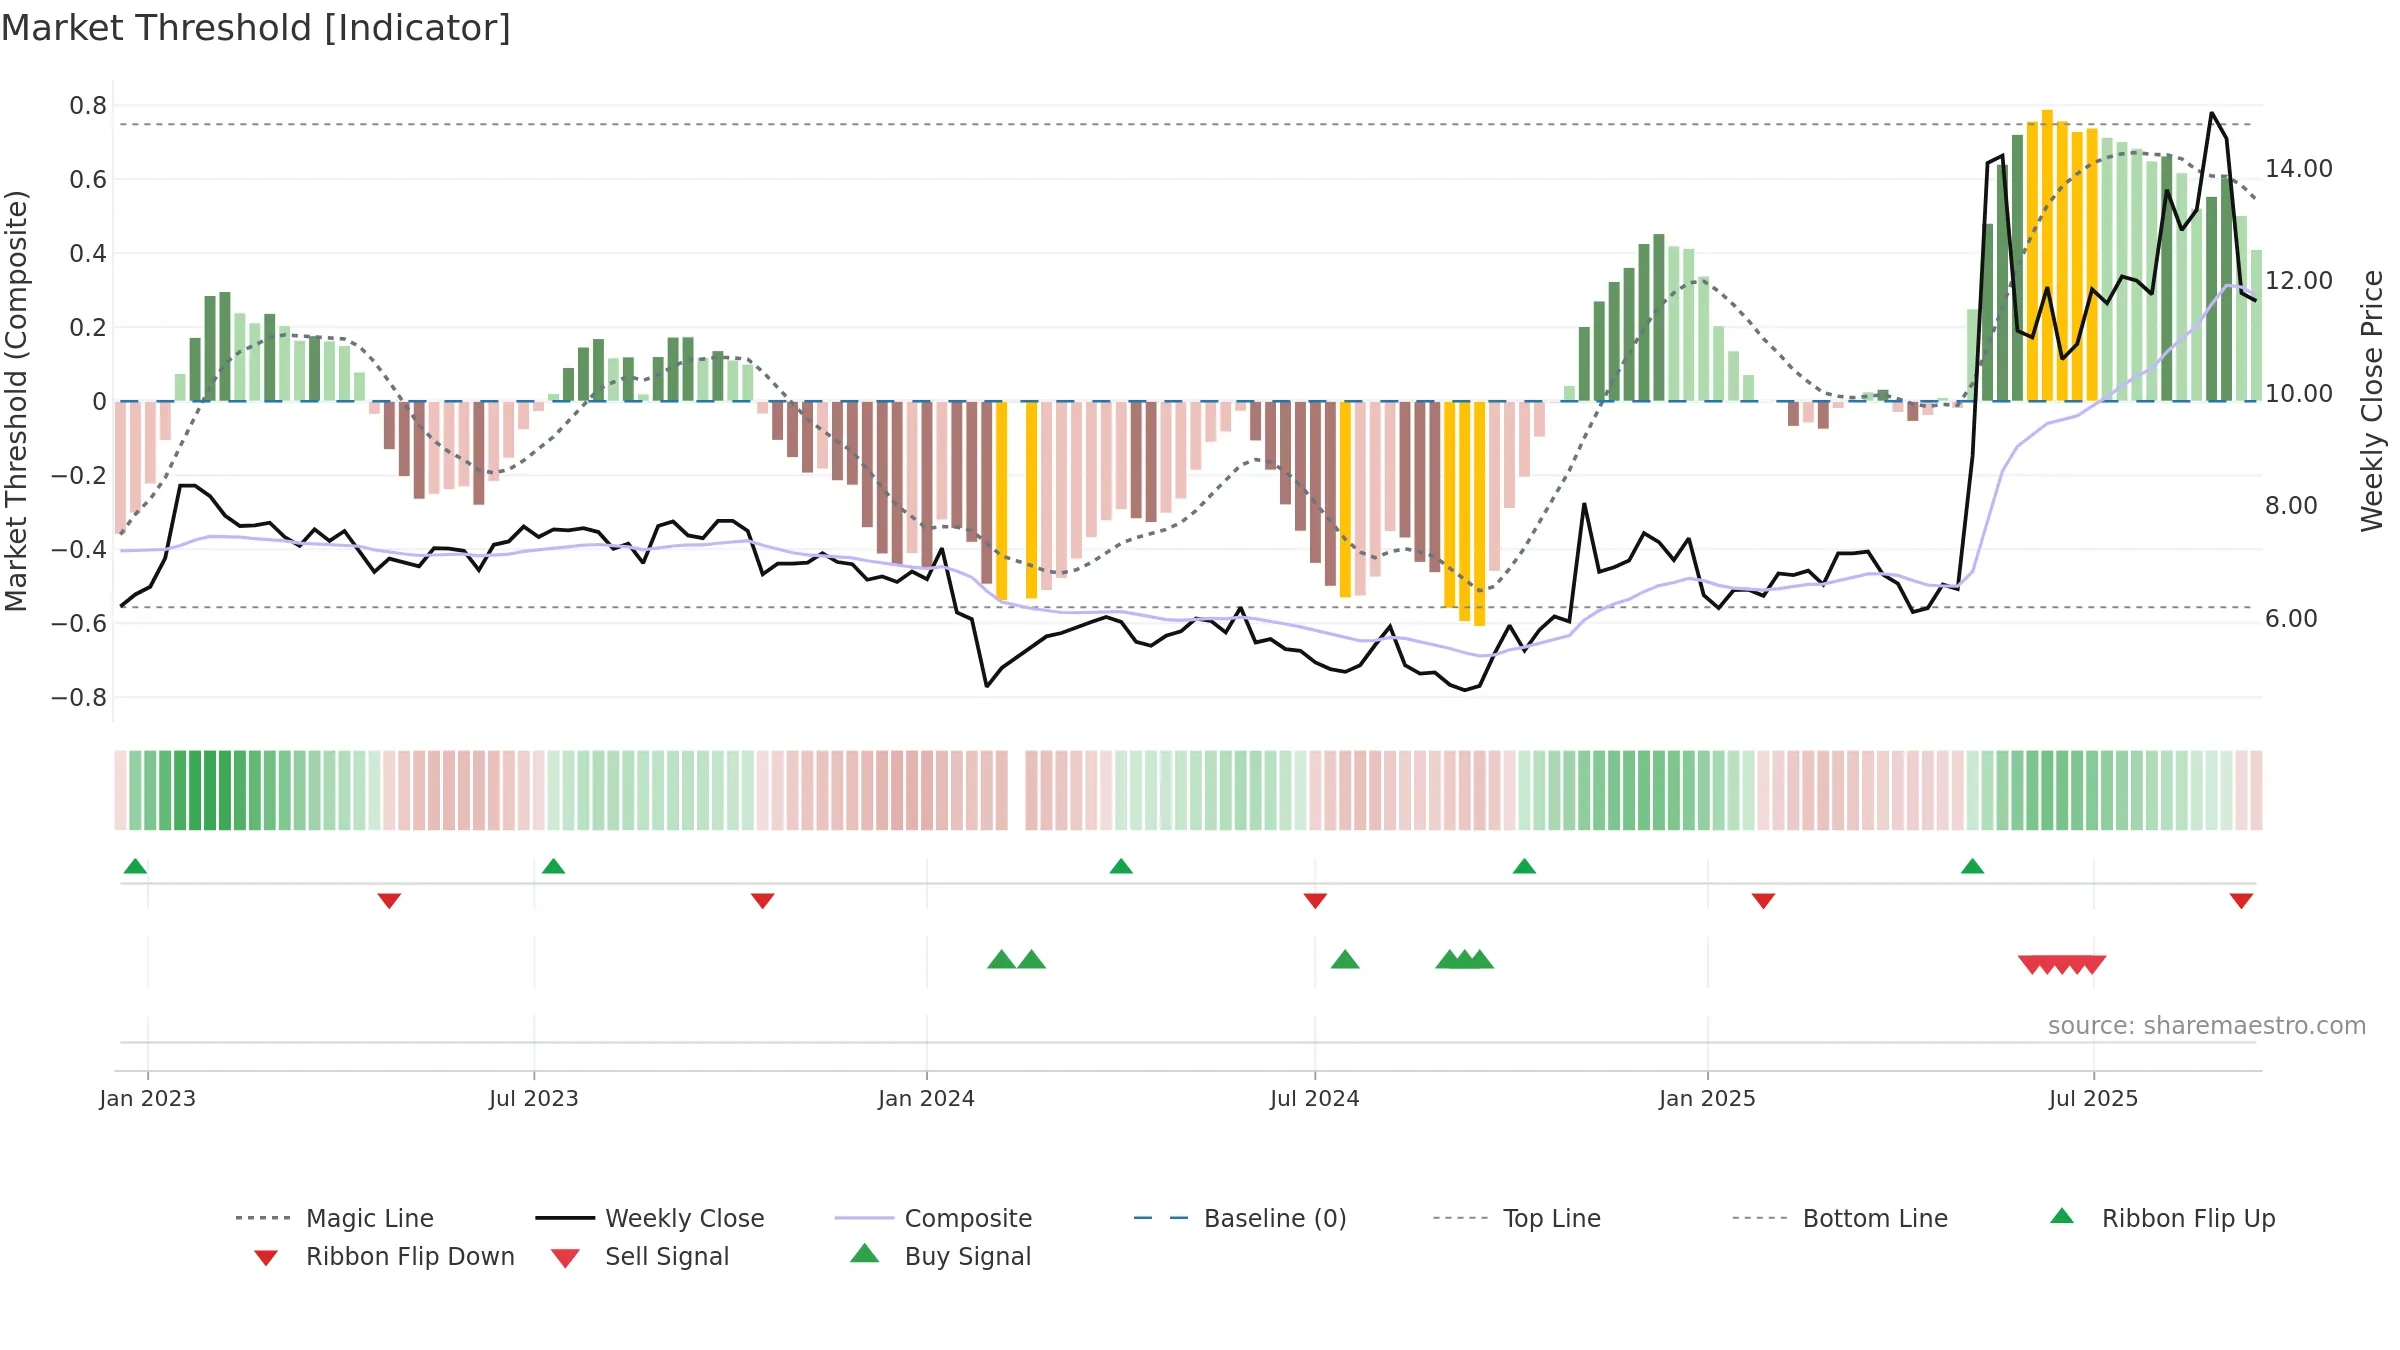
Negative setup. ★★☆☆☆ confidence. Price window: -1. Trend: Uptrend at Risk; gauge 78. In combination, liquidity confirms the move.
- Constructive moving-average stack
- Liquidity confirms the price trend
- High-level but rolling over (topping risk)
- Momentum is weak/falling
- Price is not above key averages
- High return volatility raises whipsaw risk
Why: Price window -1.02% over 8w. Close is -22.40% below the prior-window high. Return volatility 7.08%. Volume trend falling. Liquidity convergence with price. Trend state uptrend at risk. High-regime (0.80–1.00) downticks 3/6 (50.0%) • Accumulating. MA stack constructive. Momentum neutral and falling. Valuation limited upside without catalysts.
Tip: Most metrics include a hover tooltip where they appear in the report.