Changzhou Xingyu Automotive Lighting Systems Co.,Ltd.
601799 SHA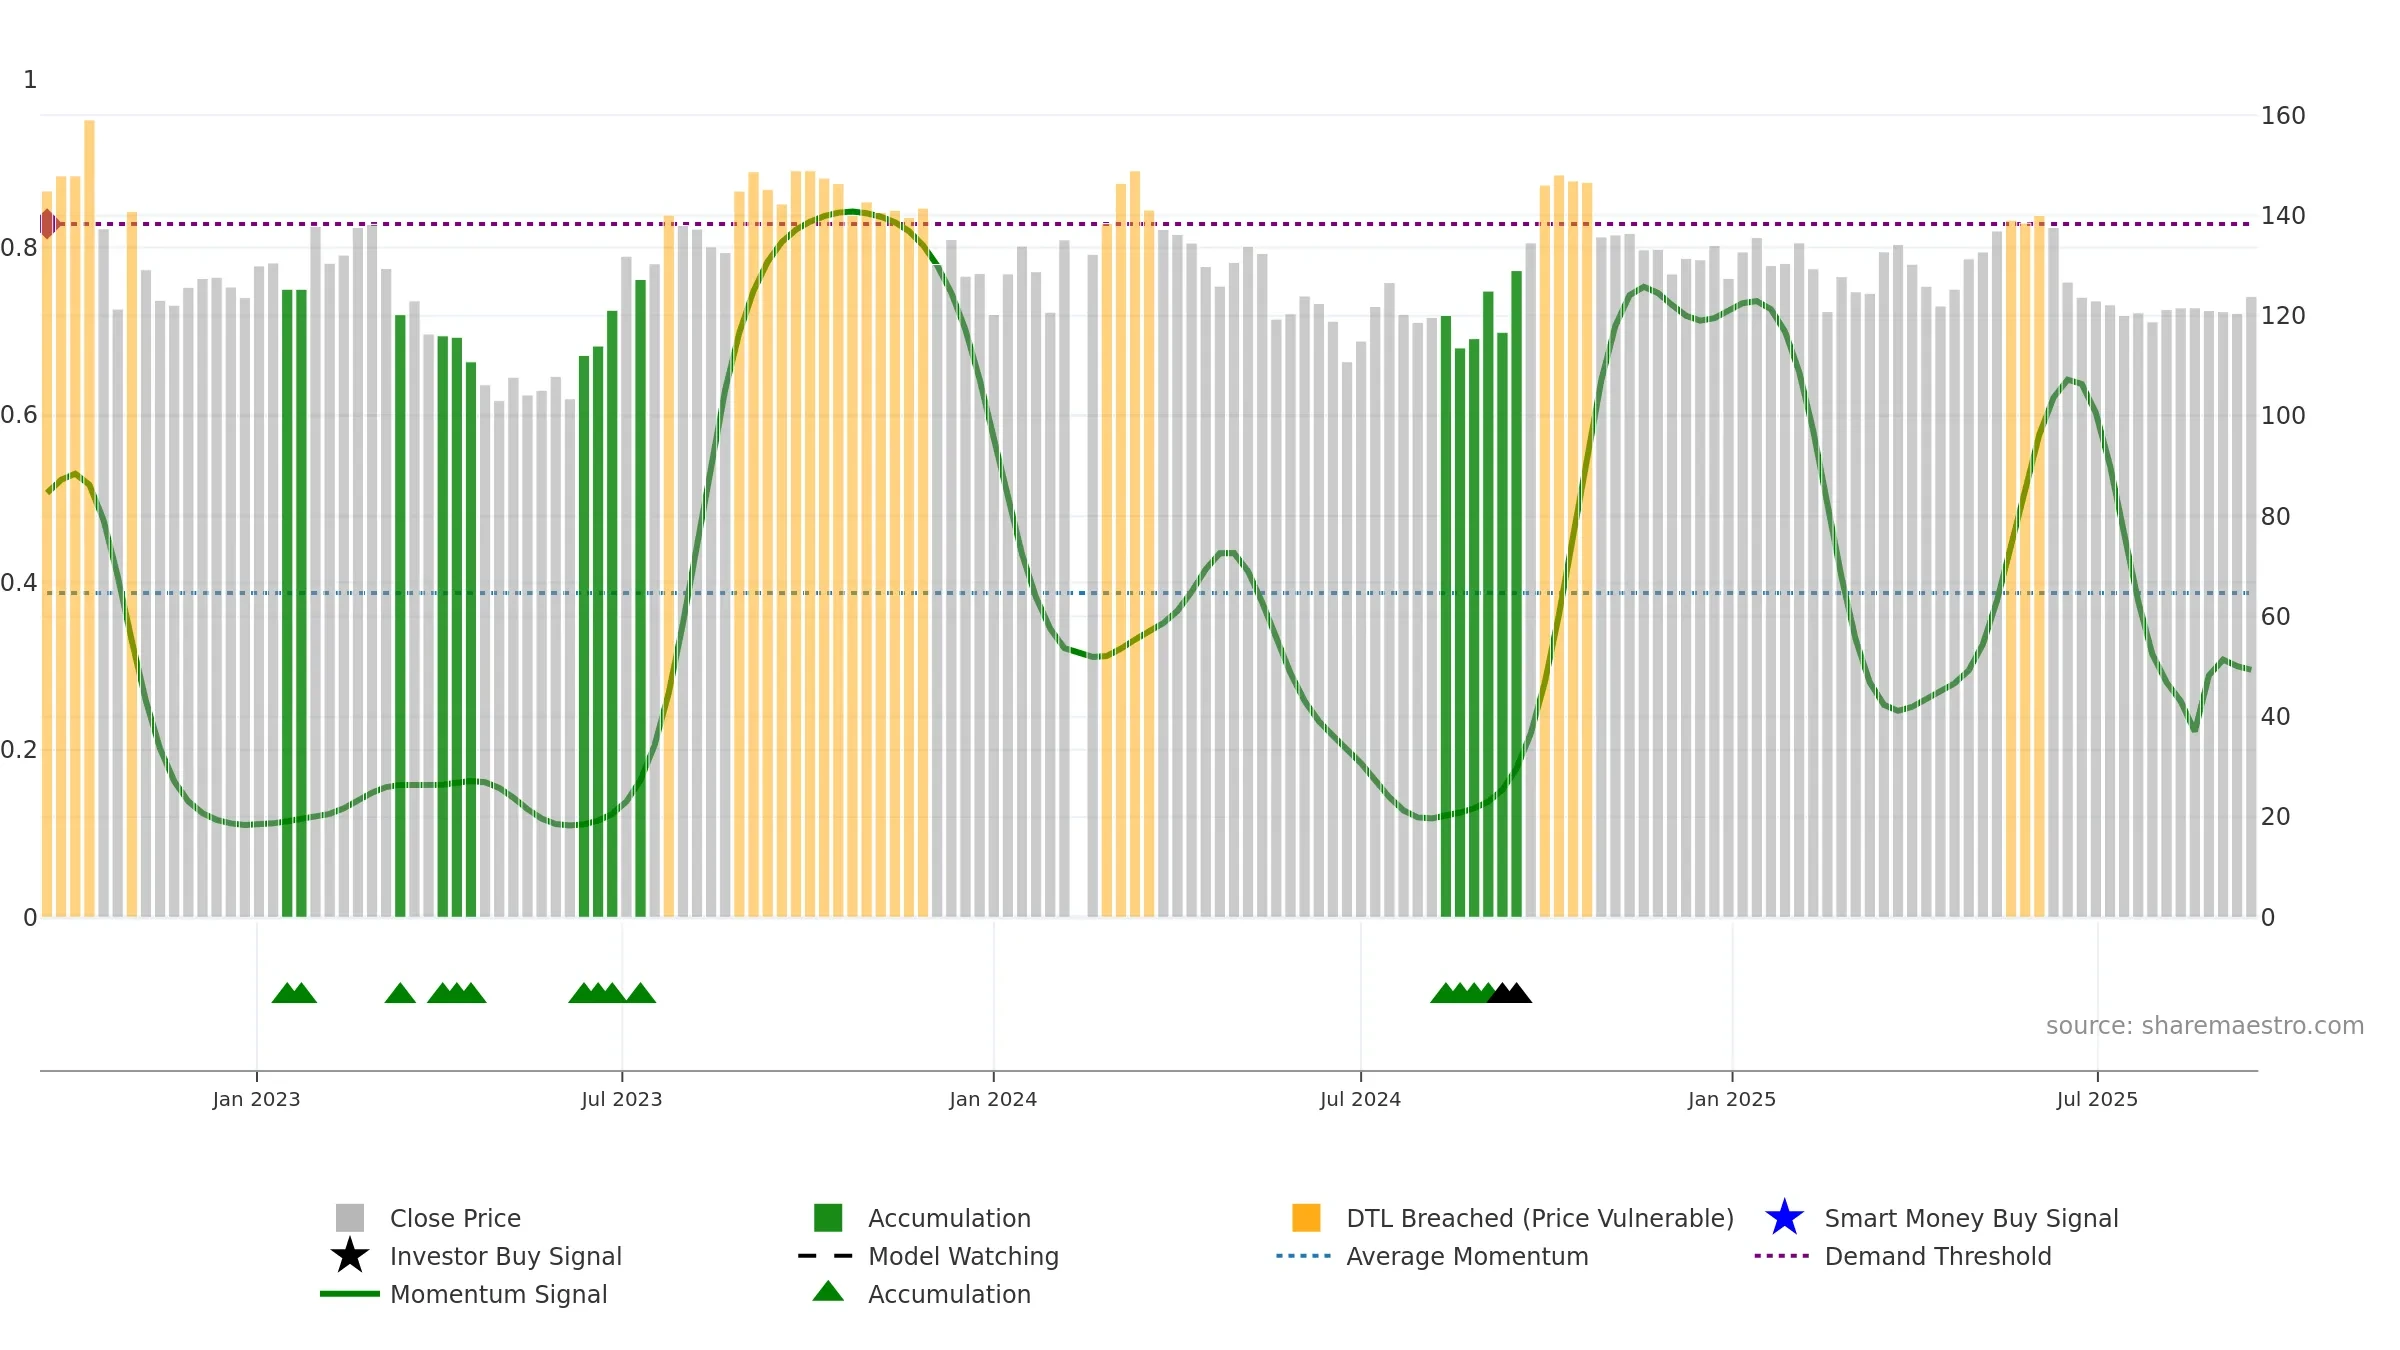
Weekly Report
Changzhou Xingyu Automotive Lighting Systems Co.,Ltd. closed at 123.8800 (1.18% WoW) . Data window ends Mon, 15 Sep 2025.
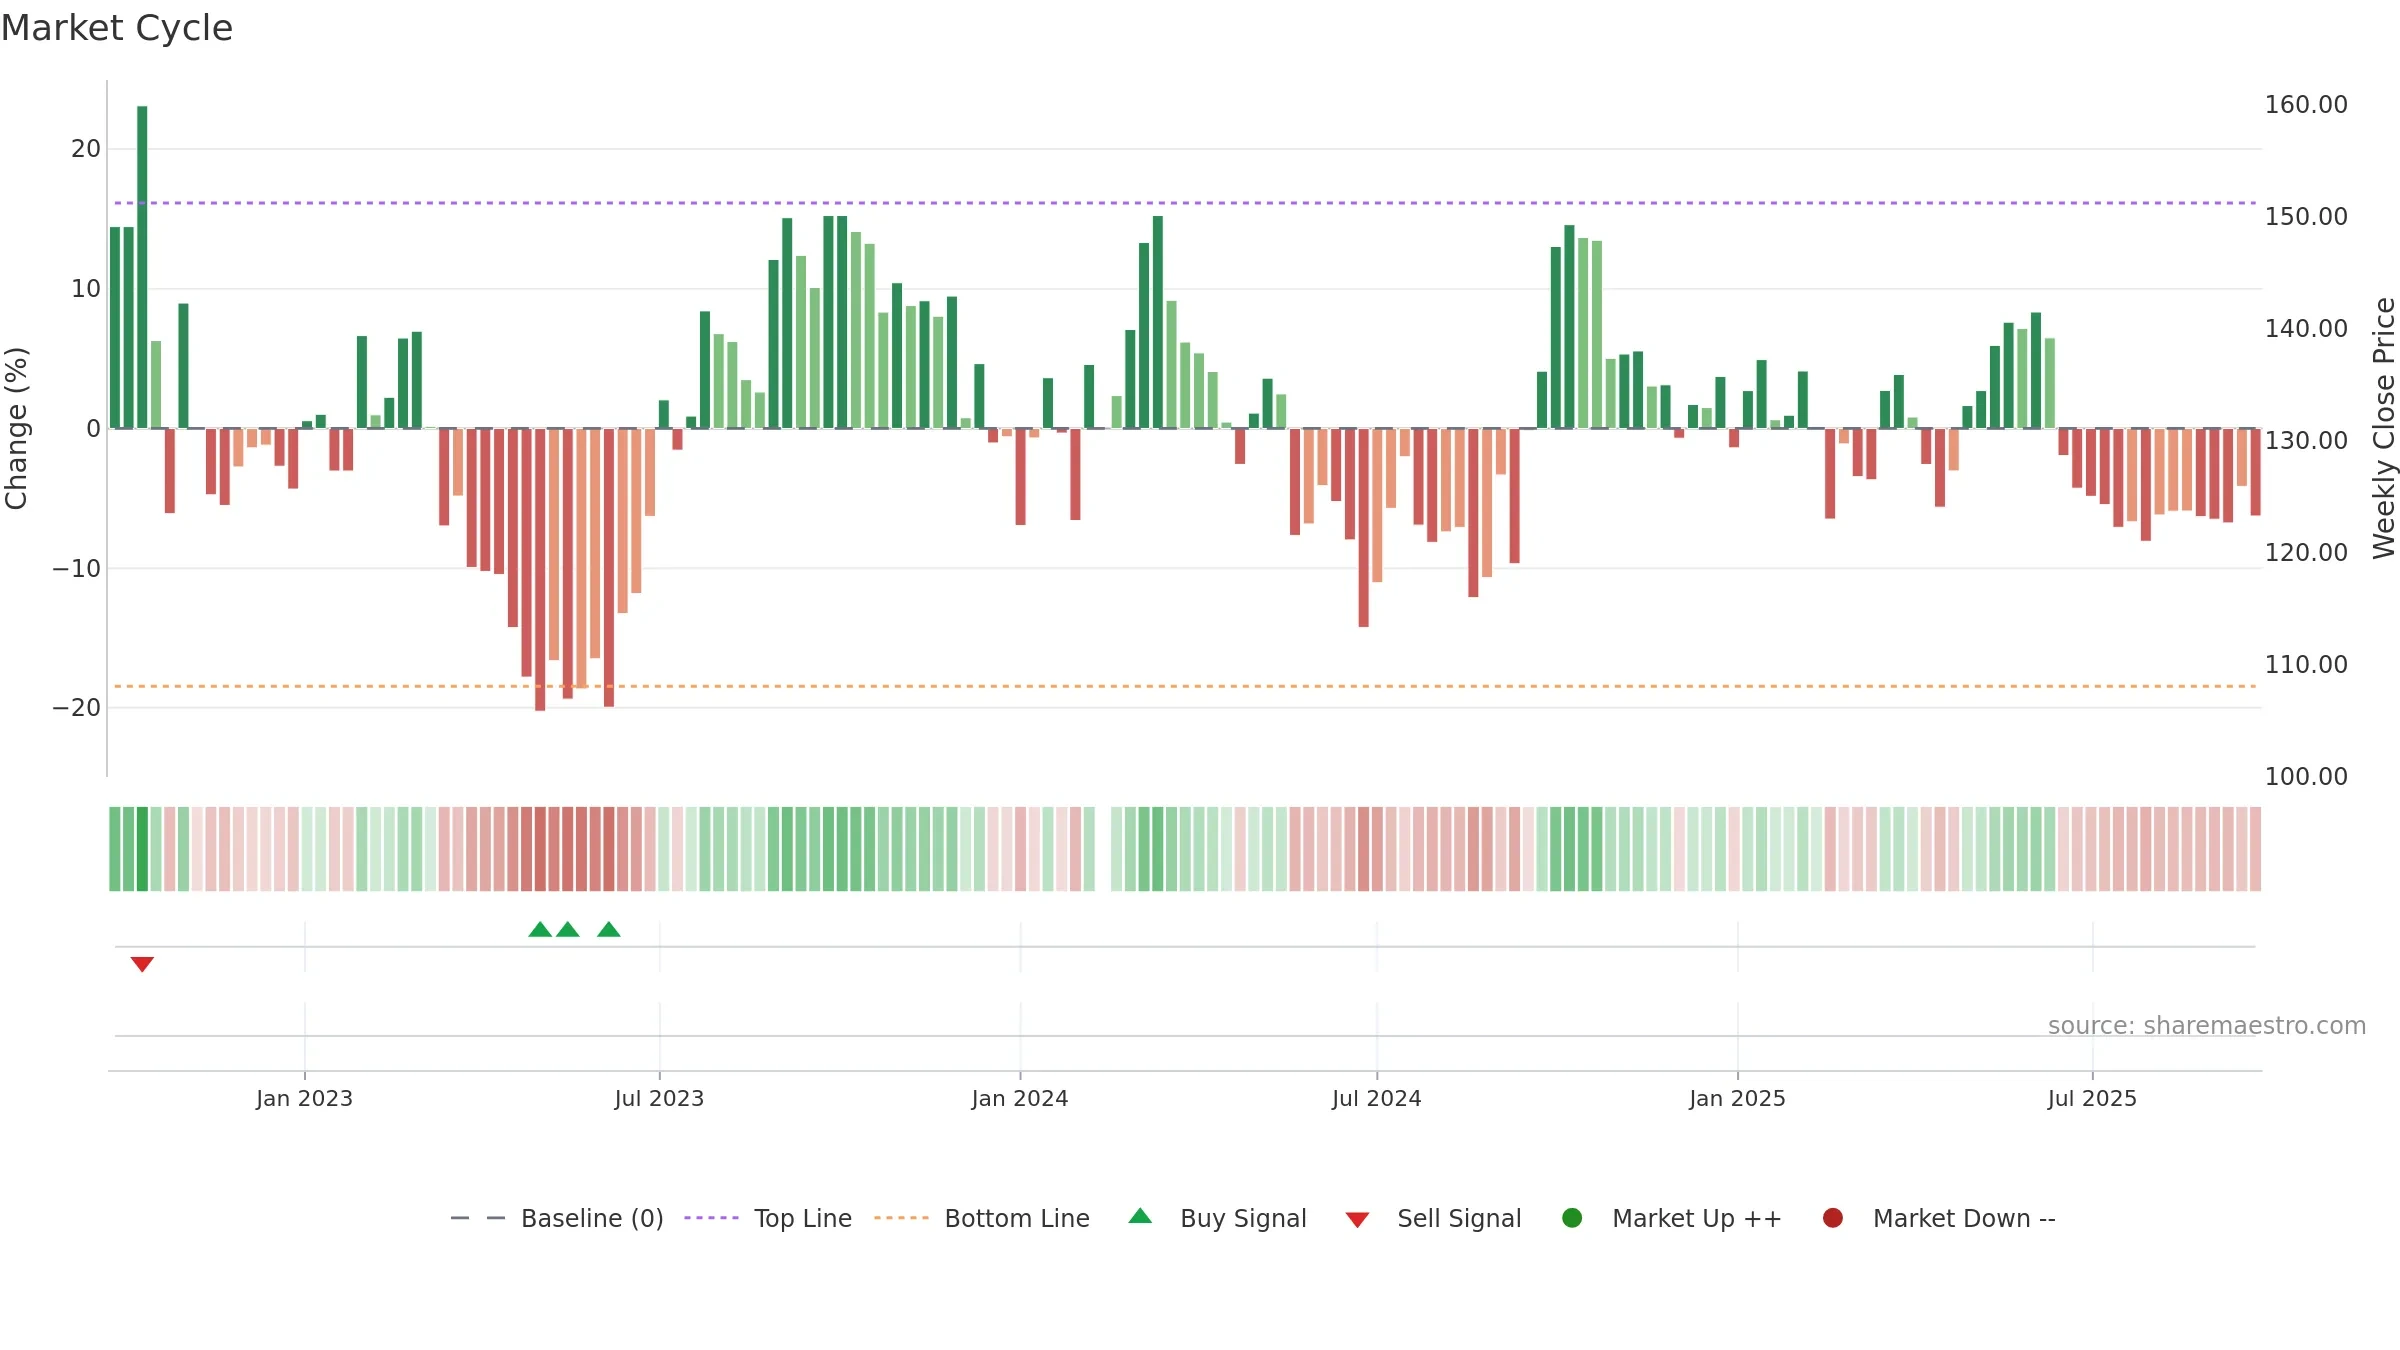
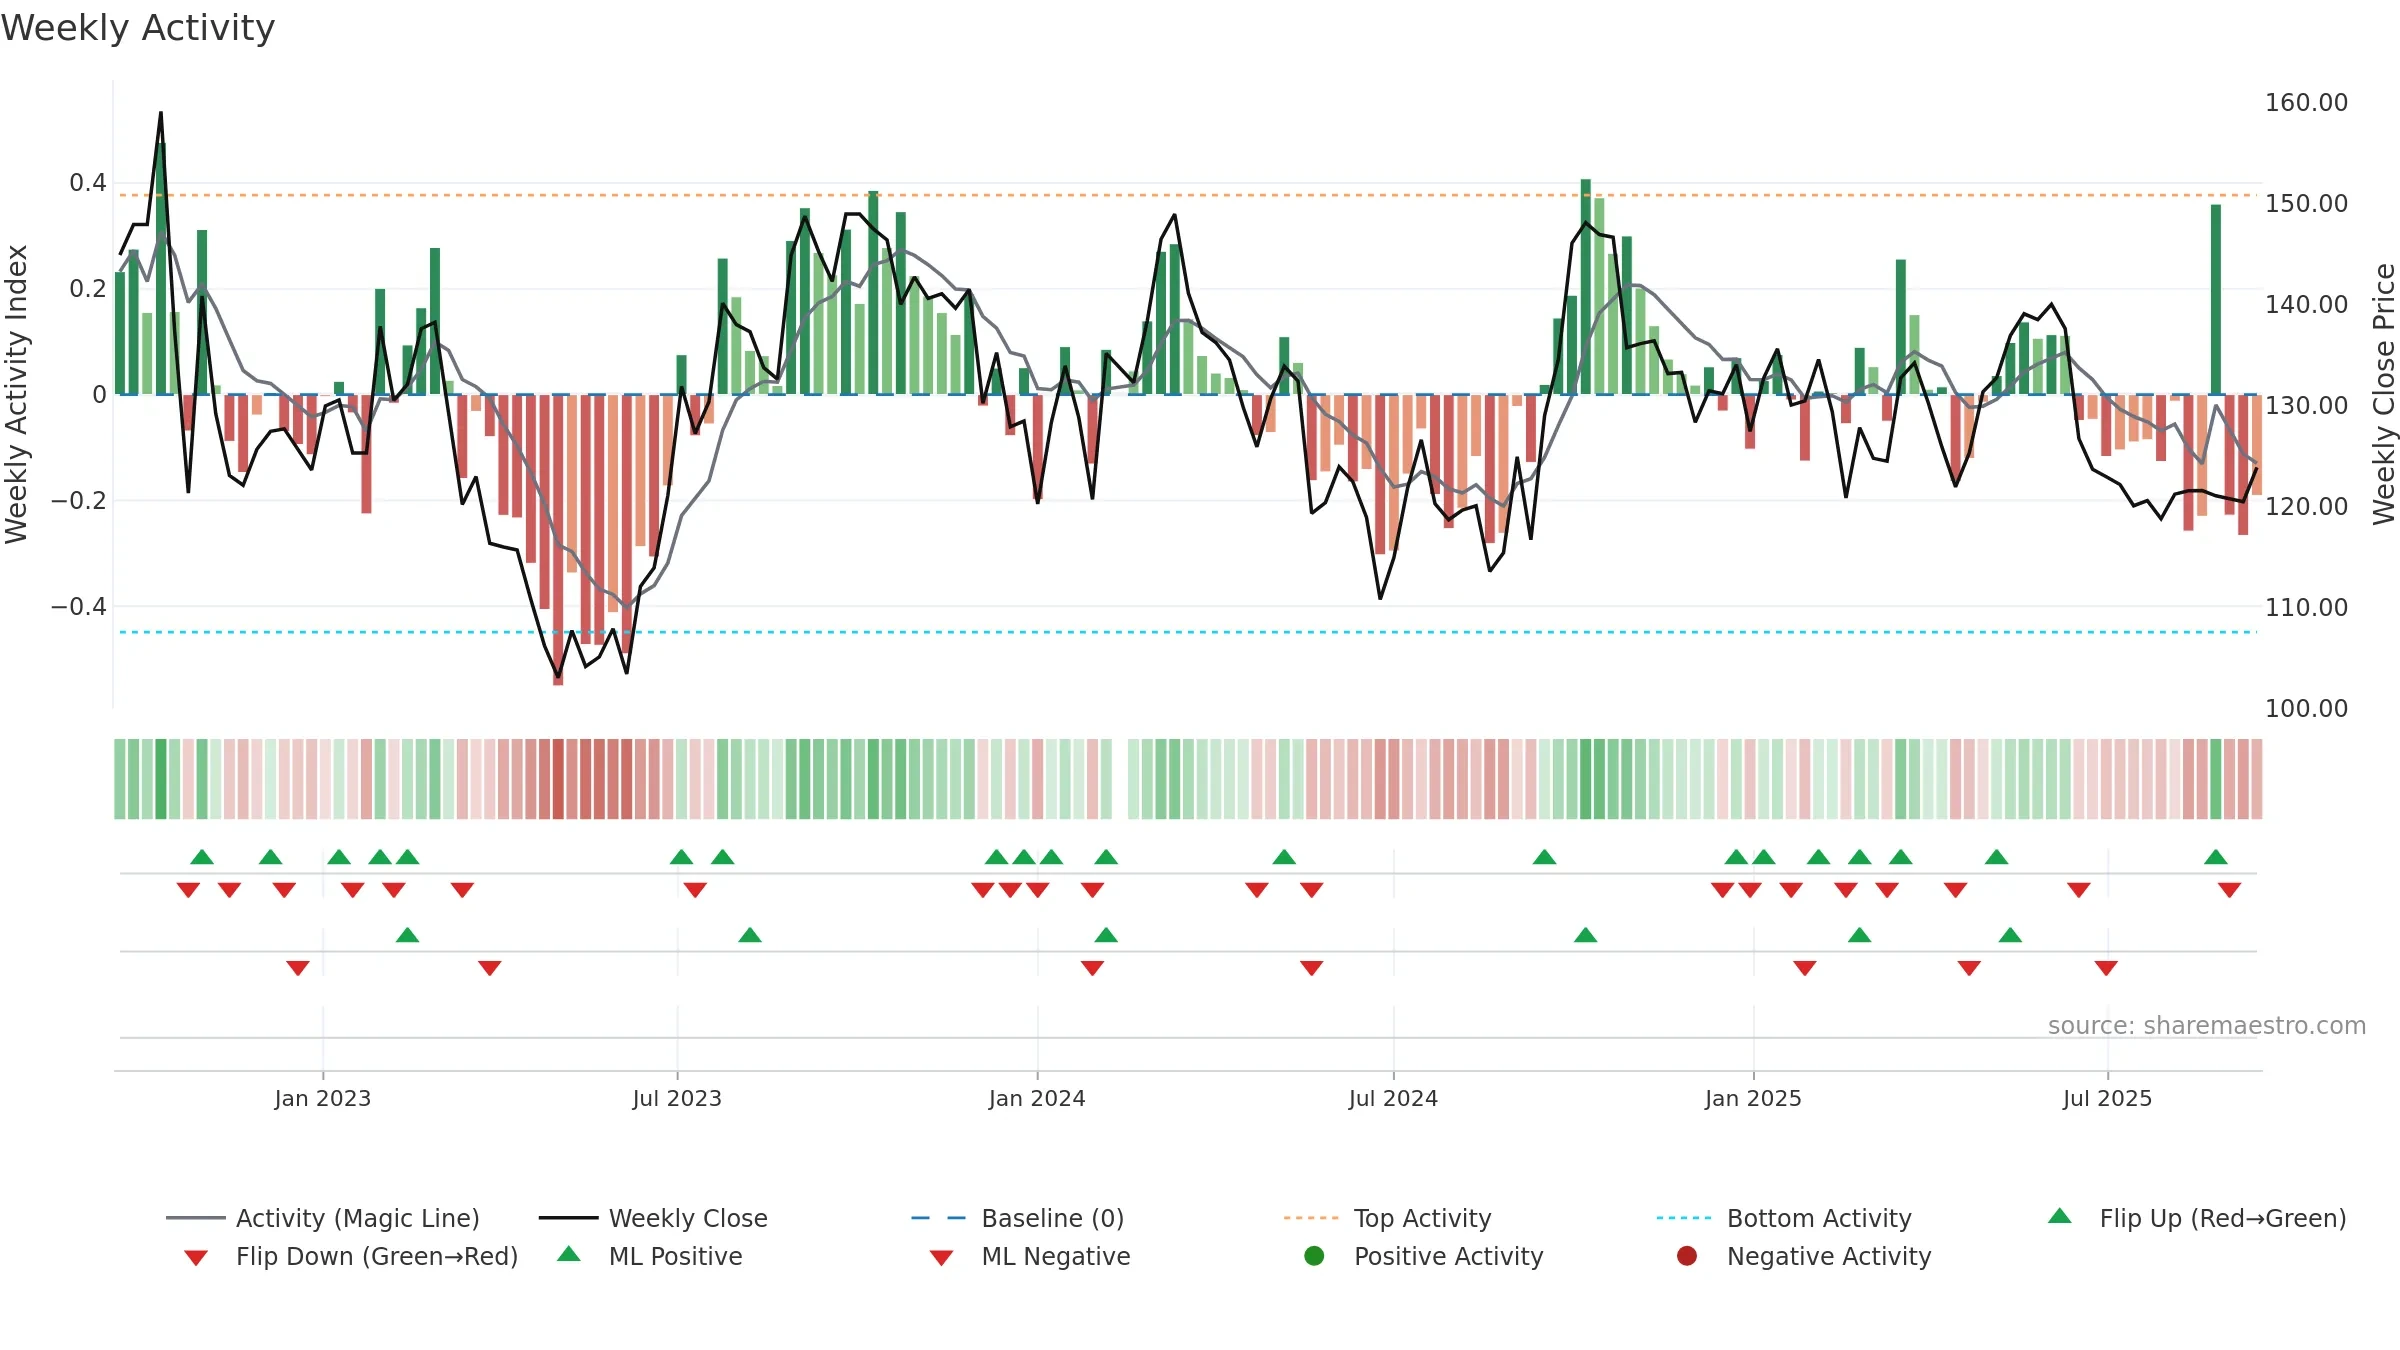
How to read this — Price slope is upward, indicating persistent buying over the window. Volume trend diverges from price — watch for fatigue or rotation. Returns are negatively correlated with volume — strength may come on lighter activity.
Up-slope supports buying interest; pullbacks may be contained if activity stays firm. Because liquidity isn’t confirming, prefer evidence of fresh demand before chasing moves.
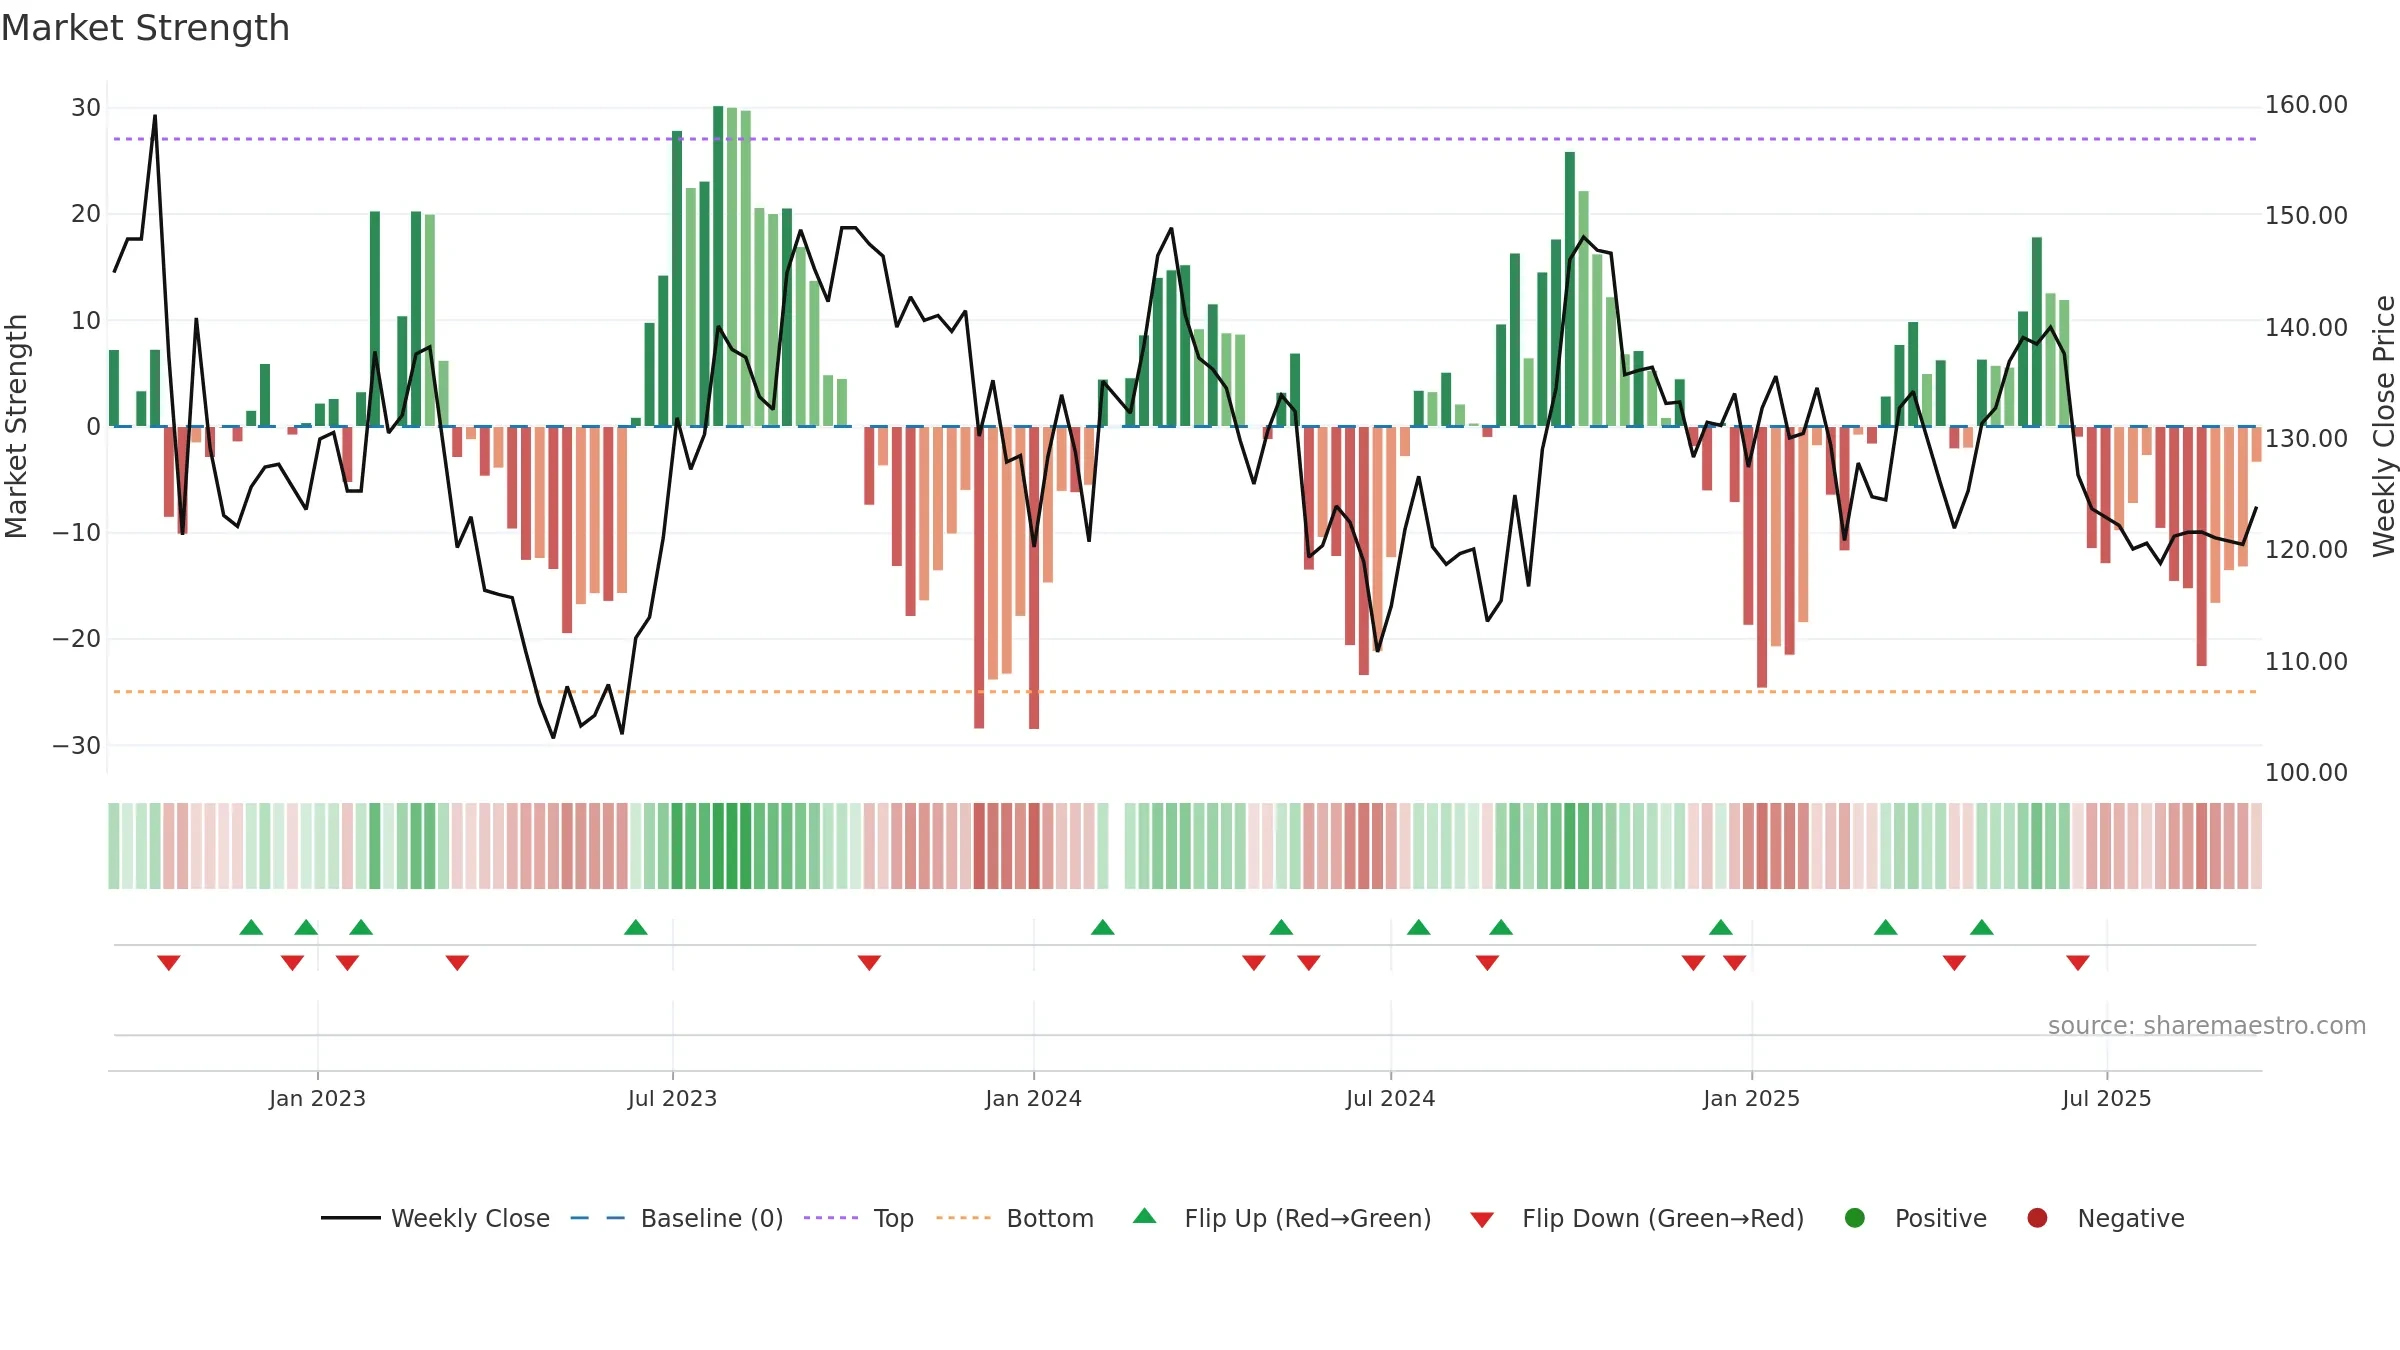
Gauge maps the trend signal to a 0–100 scale.
How to read this — Bearish backdrop but short-term momentum is improving; confirmation still needed.
Early improvement — look for a reclaim of 0.50→0.60 to validate.
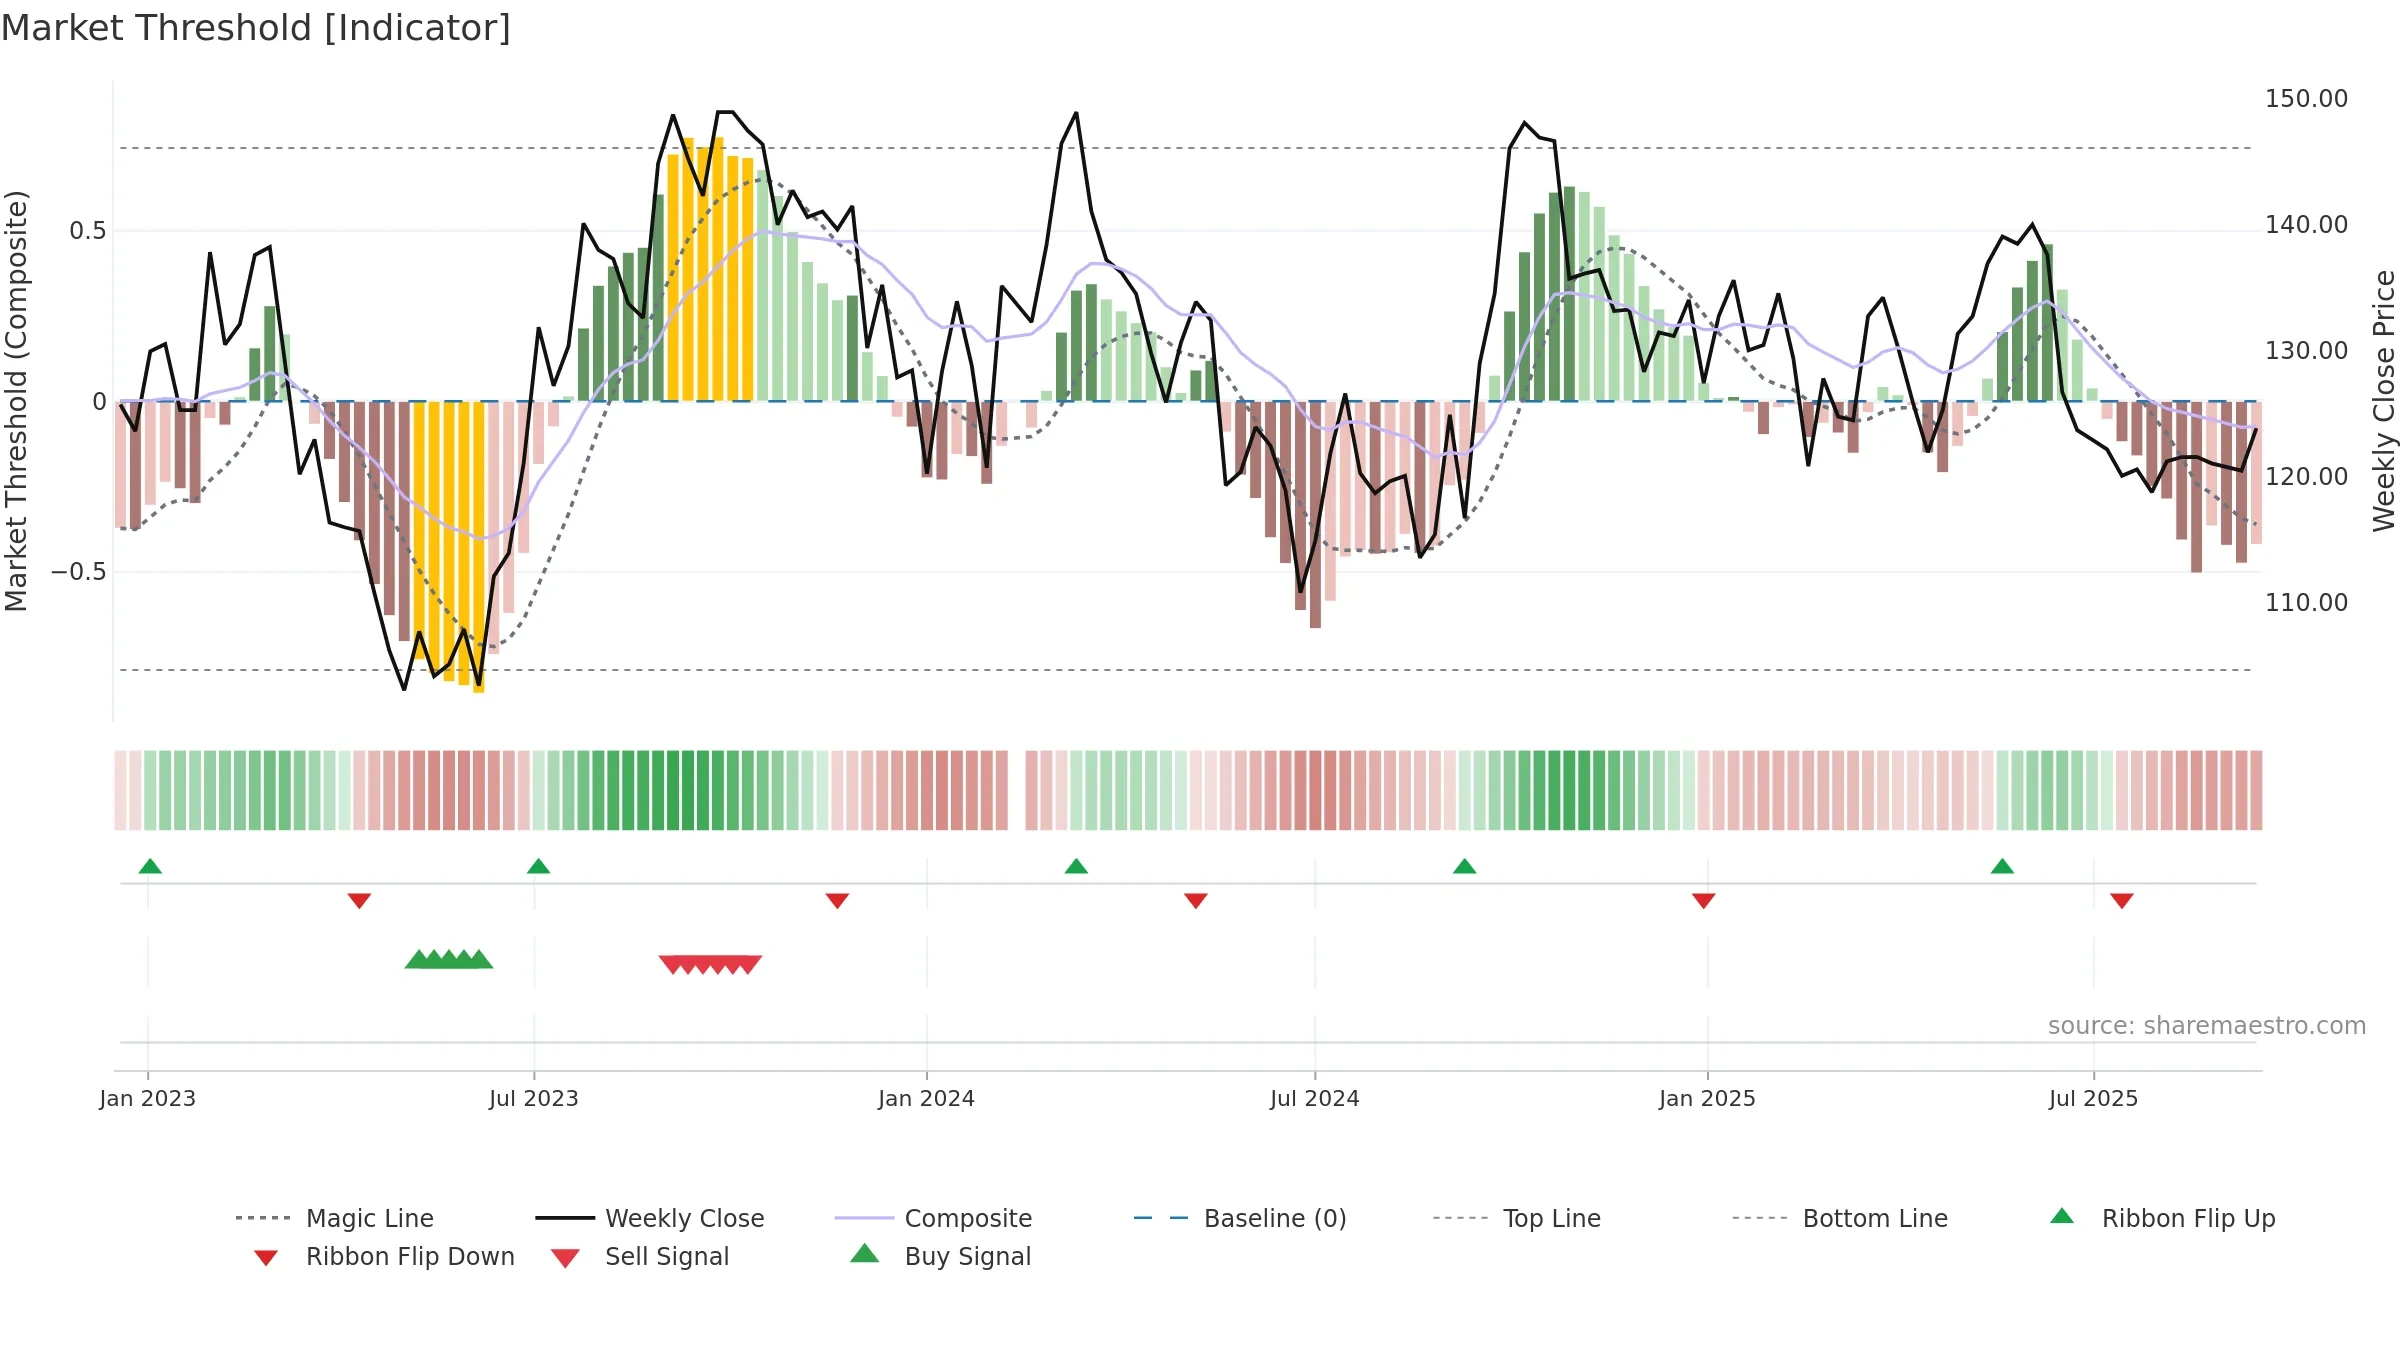
The flag is positive: favourable upside skew with supportive conditions.
Conclusion
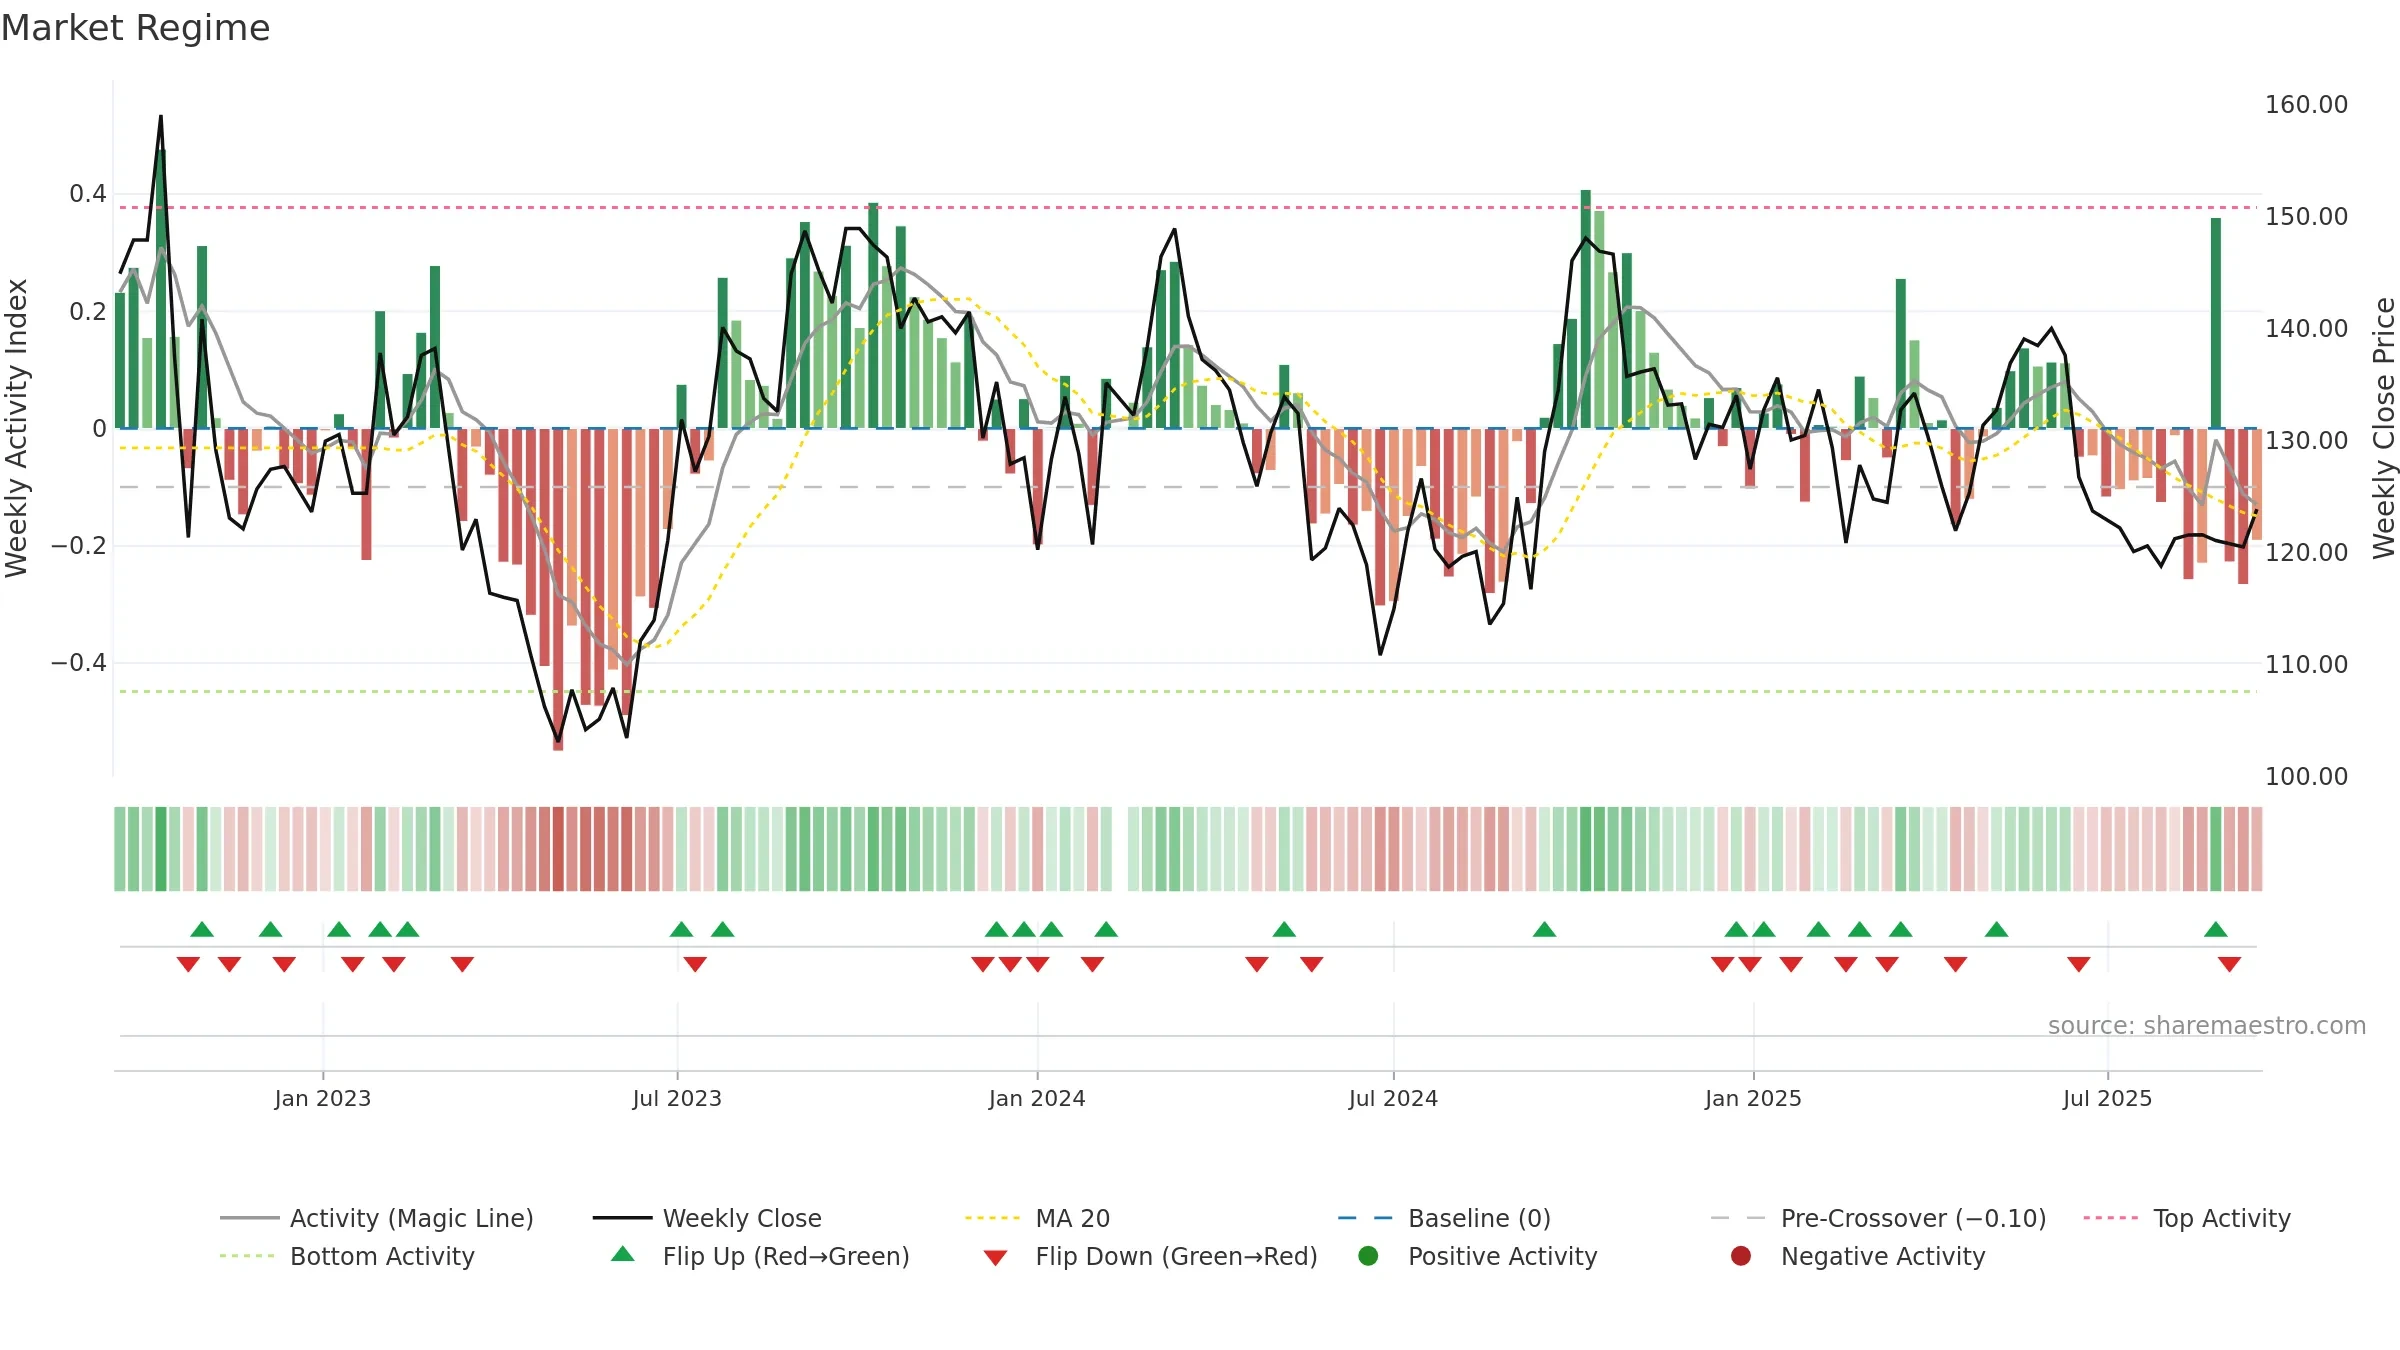
Negative setup. ★★☆☆☆ confidence. Price window: 4. Trend: Bottoming Attempt; gauge 29. In combination, liquidity diverges from price.
- Early improvement from bearish zone (bottoming attempt)
- Momentum is weak/falling
- Price is not above key averages
- Liquidity diverges from price
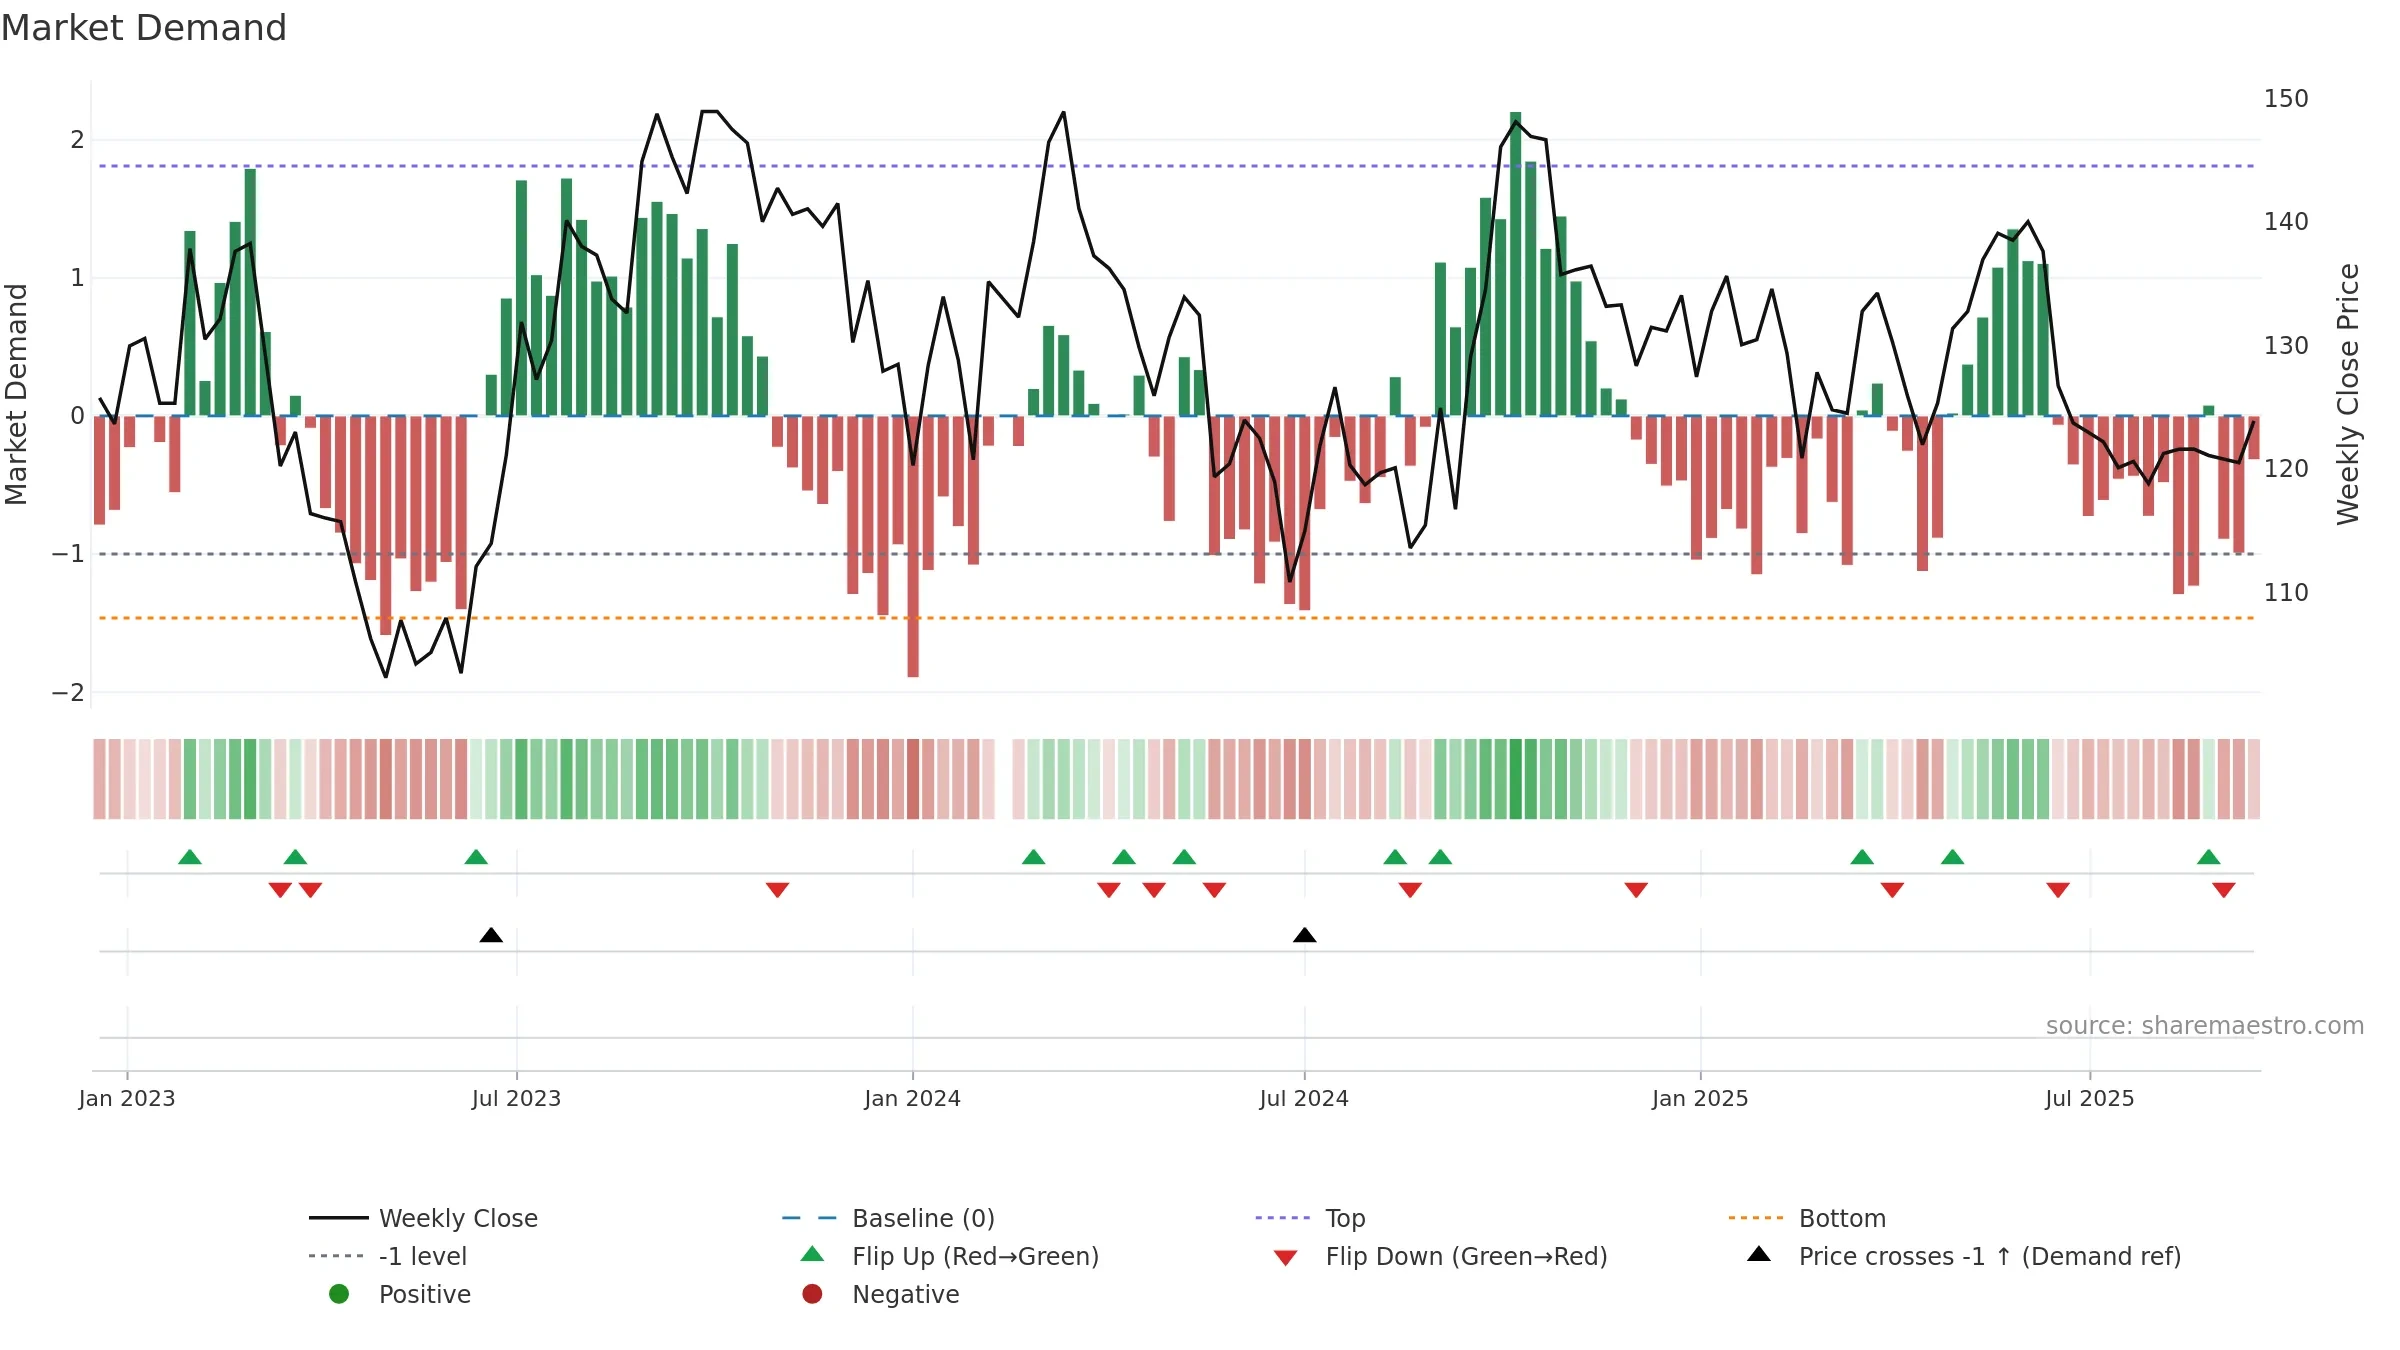
Why: Price window 4.28% over 8w. Close is 1.88% above the prior-window high. Return volatility 2.24%. Volume trend falling. Liquidity divergence with price. Trend state bottoming attempt. Momentum bearish and rising. Valuation stance positive.
Tip: Most metrics include a hover tooltip where they appear in the report.