Meridian Energy Limited
MEZ ASX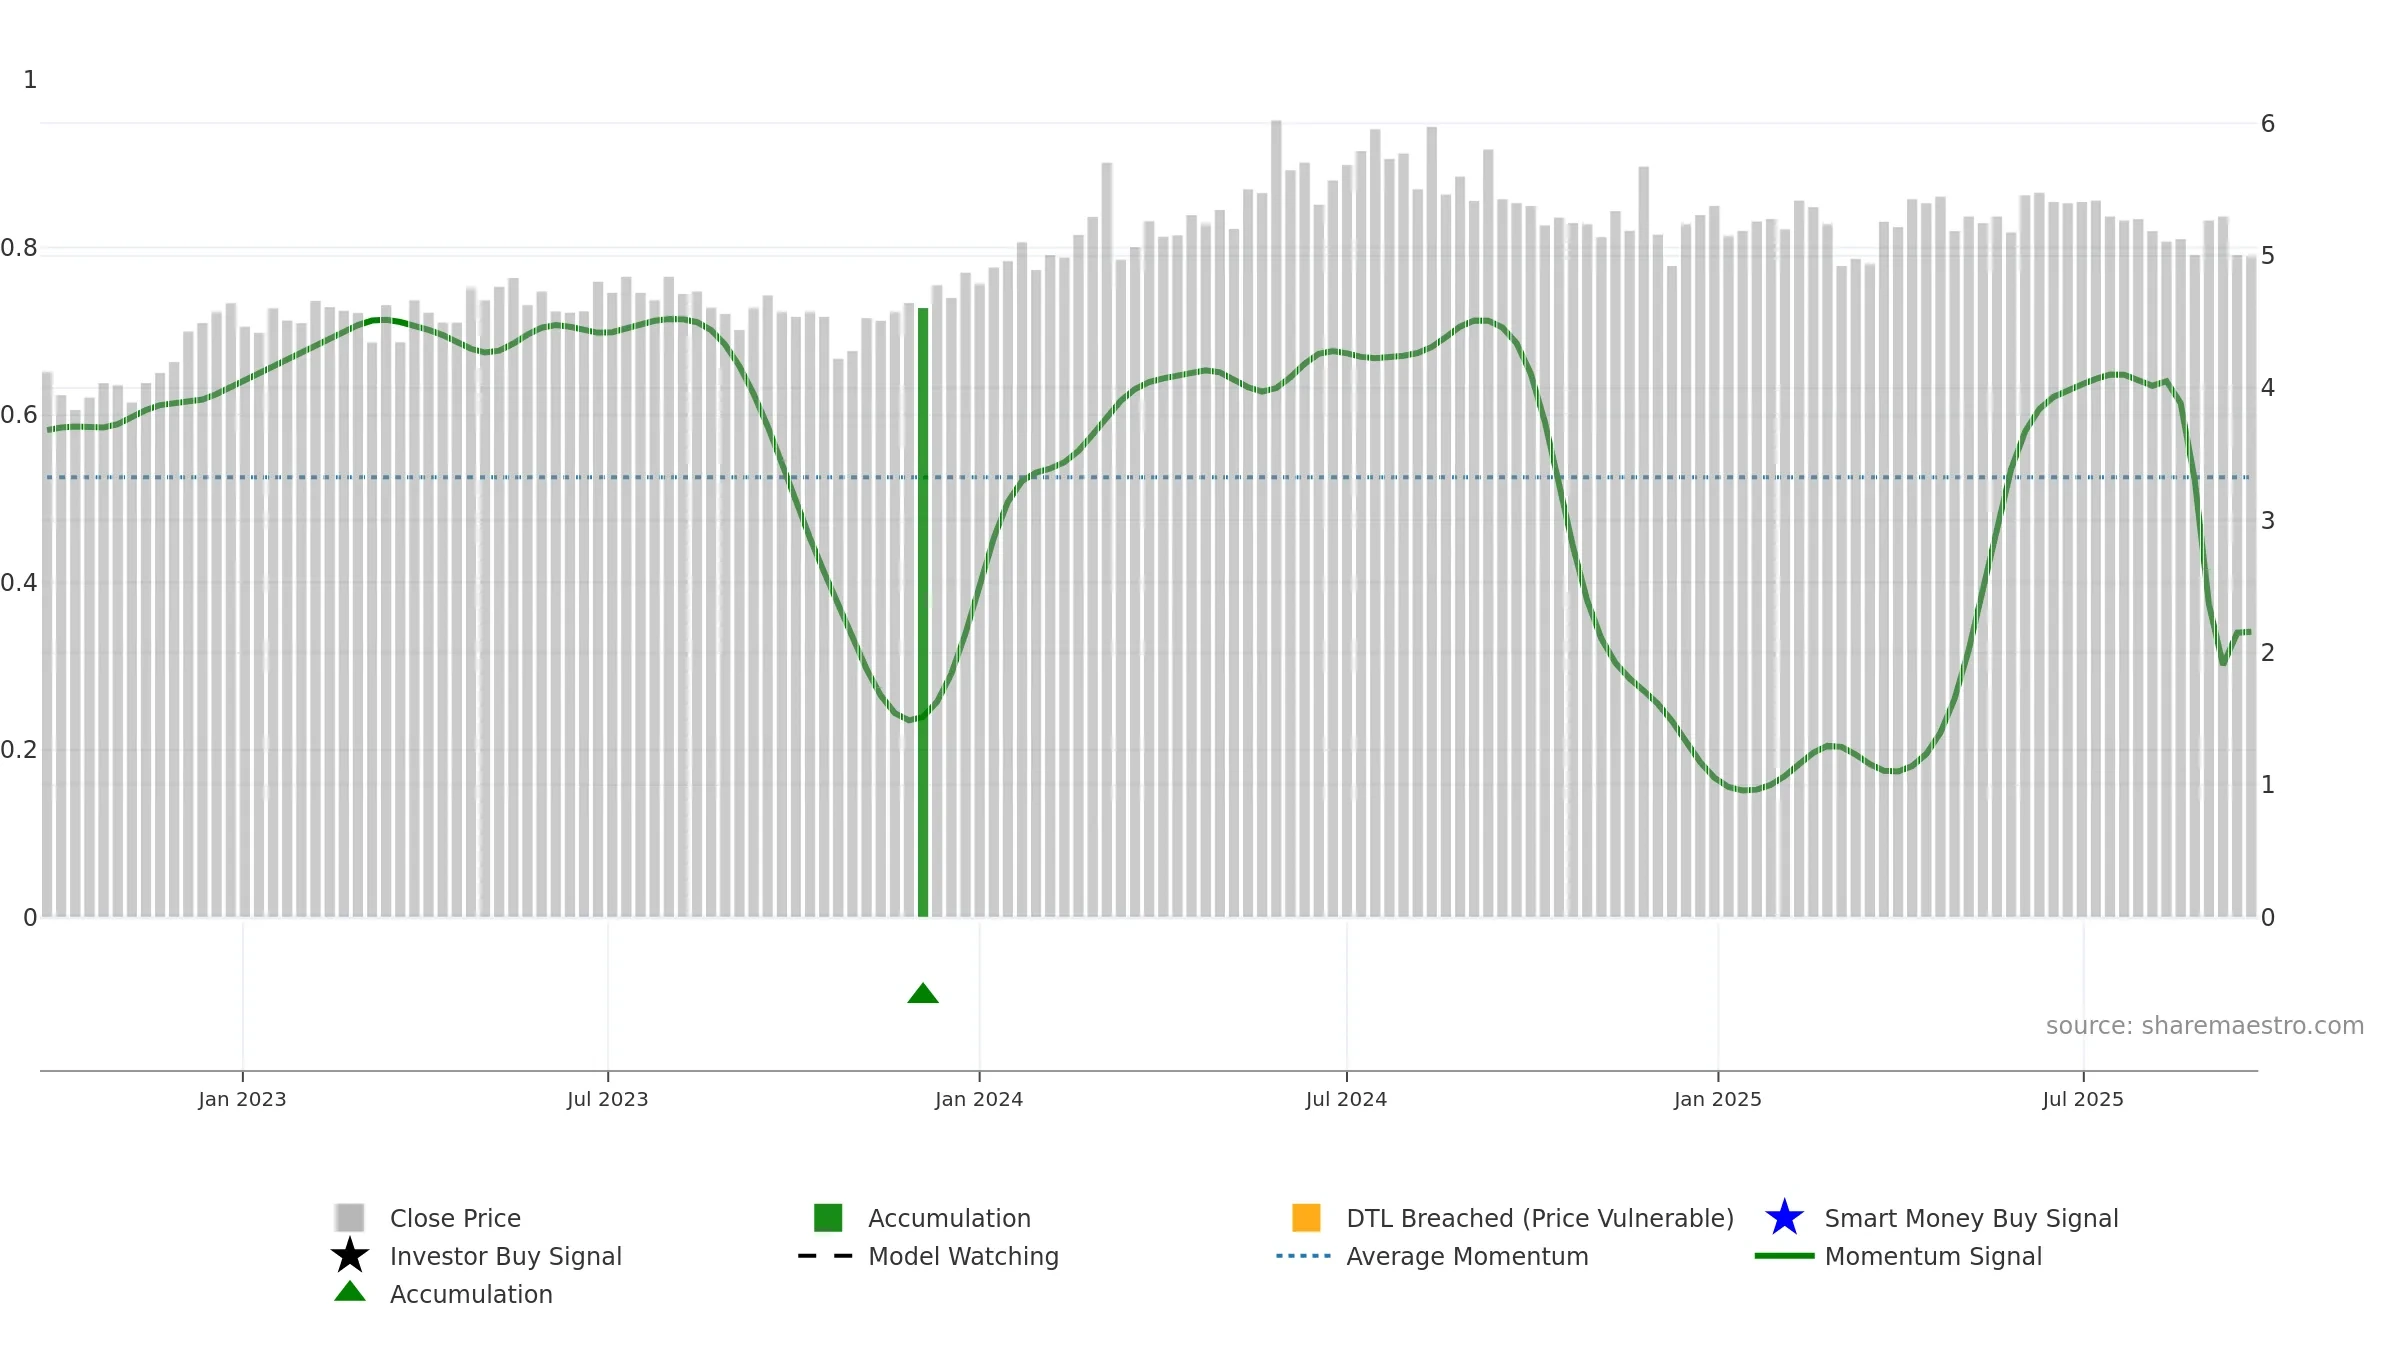
Weekly Summary
Meridian Energy Limited closed at 5.0000 (0.00% WoW) . Data window ends Mon, 22 Sep 2025.
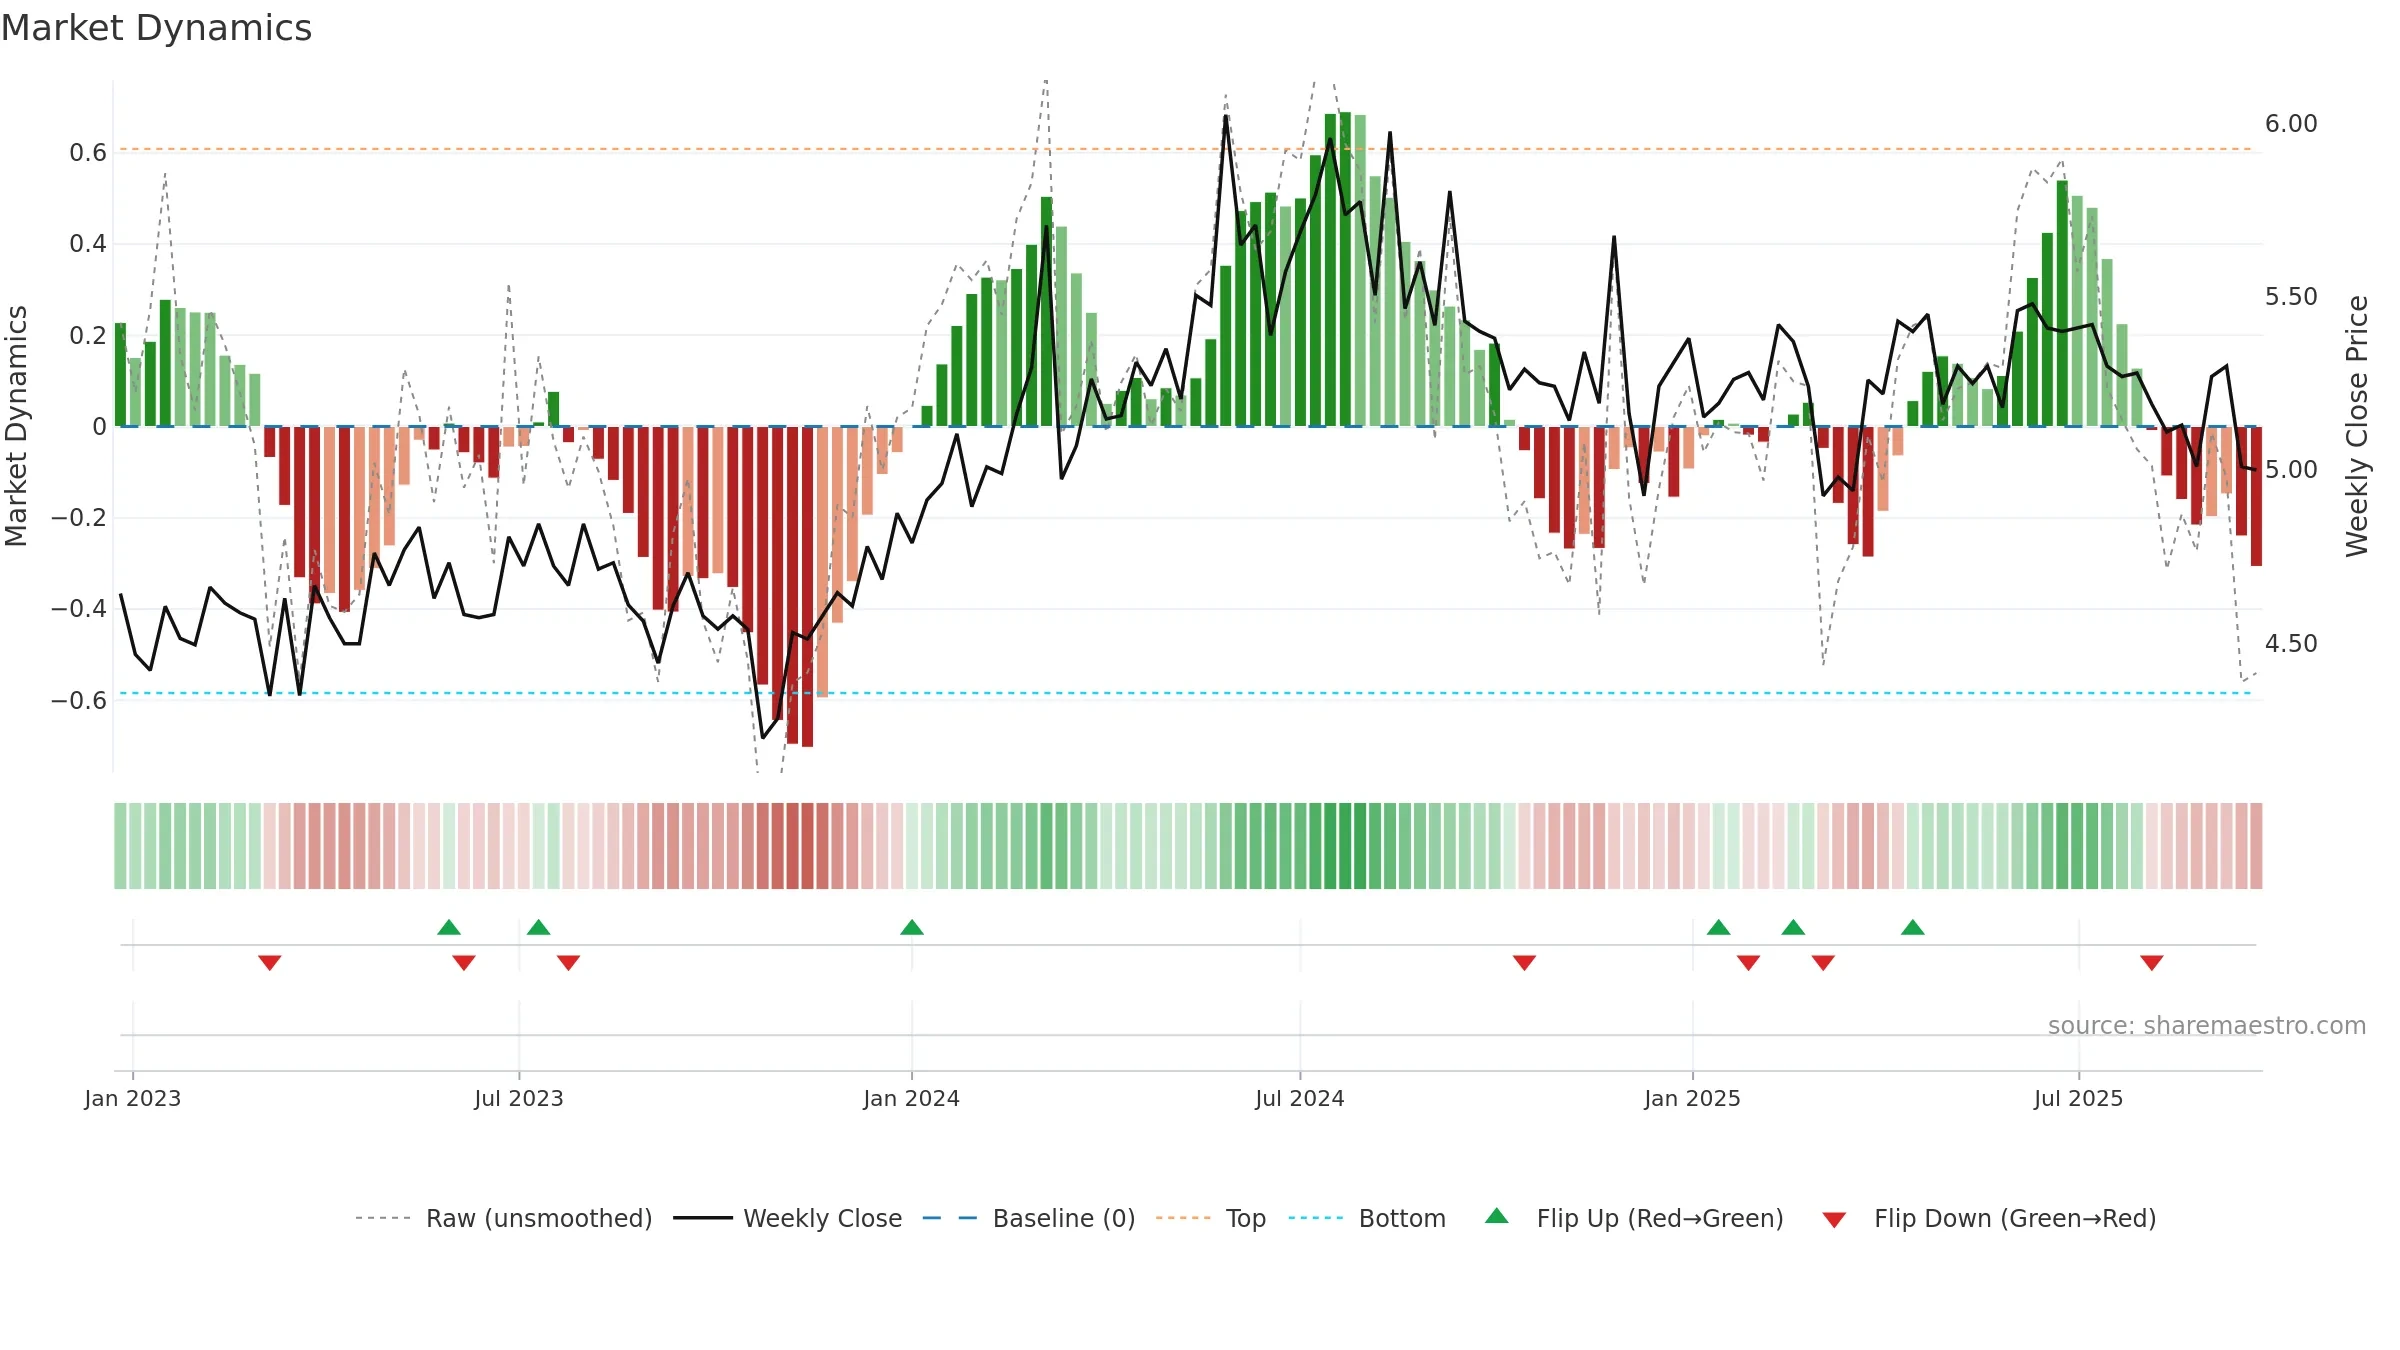
How to read this — Price slope is downward, indicating persistent supply pressure. Volume and price are moving in the same direction — a constructive confirmation. Distance to baseline is narrowing — reverting closer to its fair-value track. Fresh short-term crossover improves near-term tone. Price sits below key averages, keeping pressure on the tape.
Down-slope argues for patience; rallies can fade sooner unless participation improves.
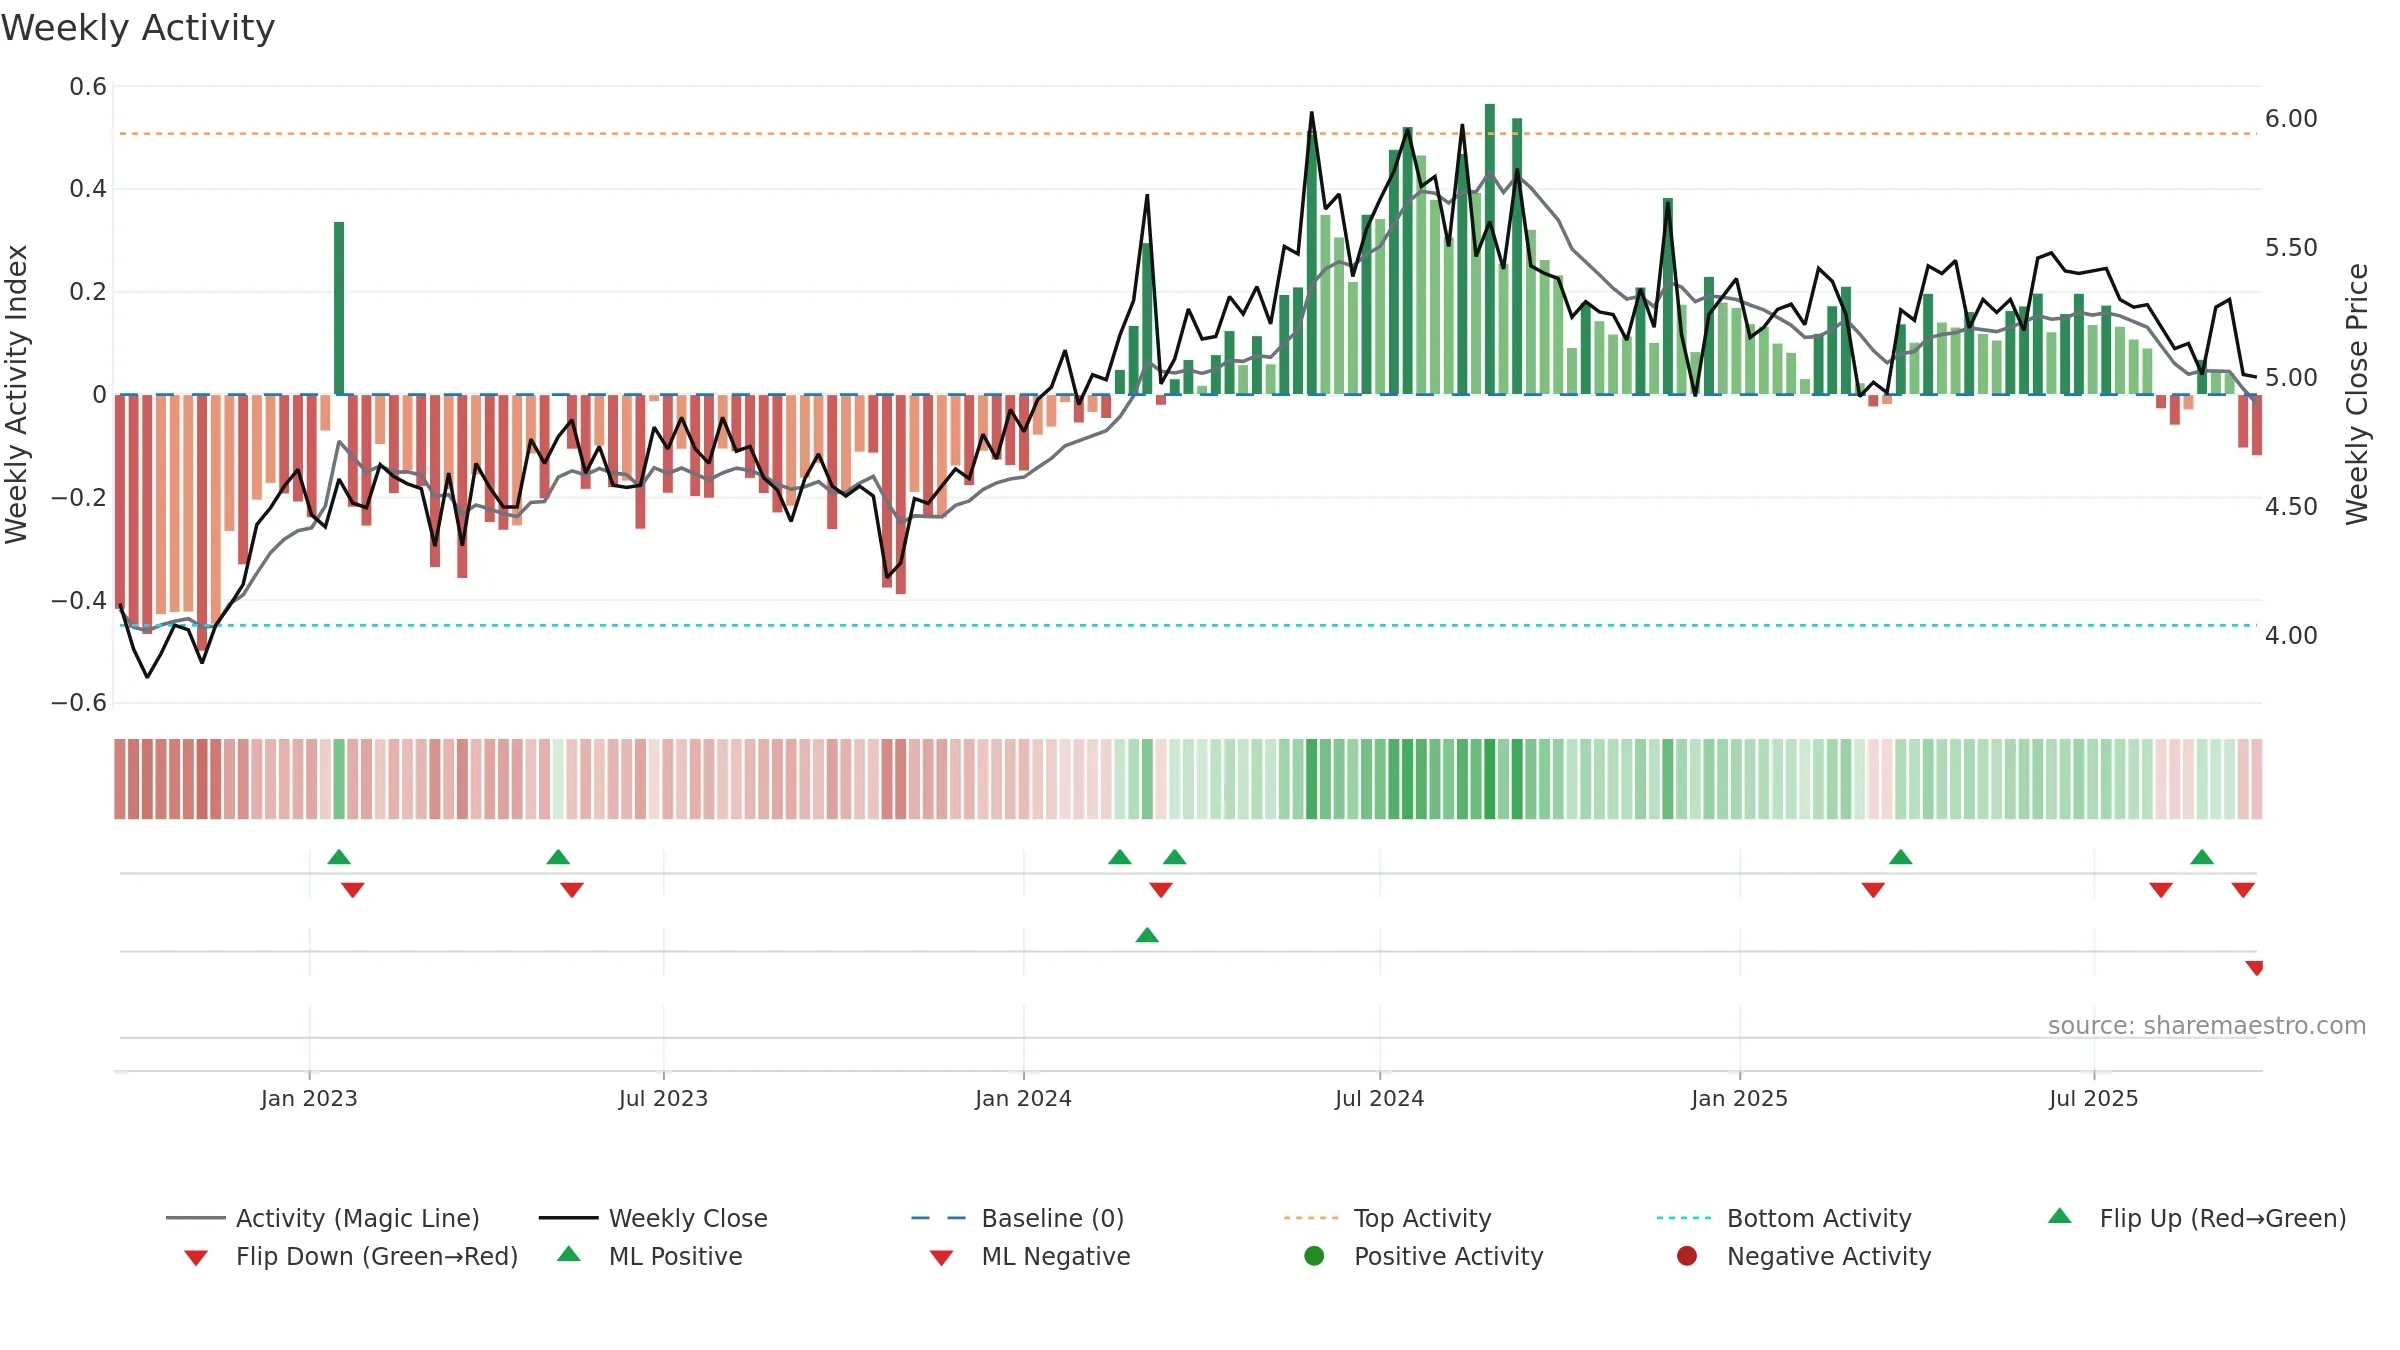
Gauge maps the trend signal to a 0–100 scale.
How to read this — Range-bound conditions; conviction is limited until a break or acceleration emerges.
Wait for a directional break or improving acceleration.

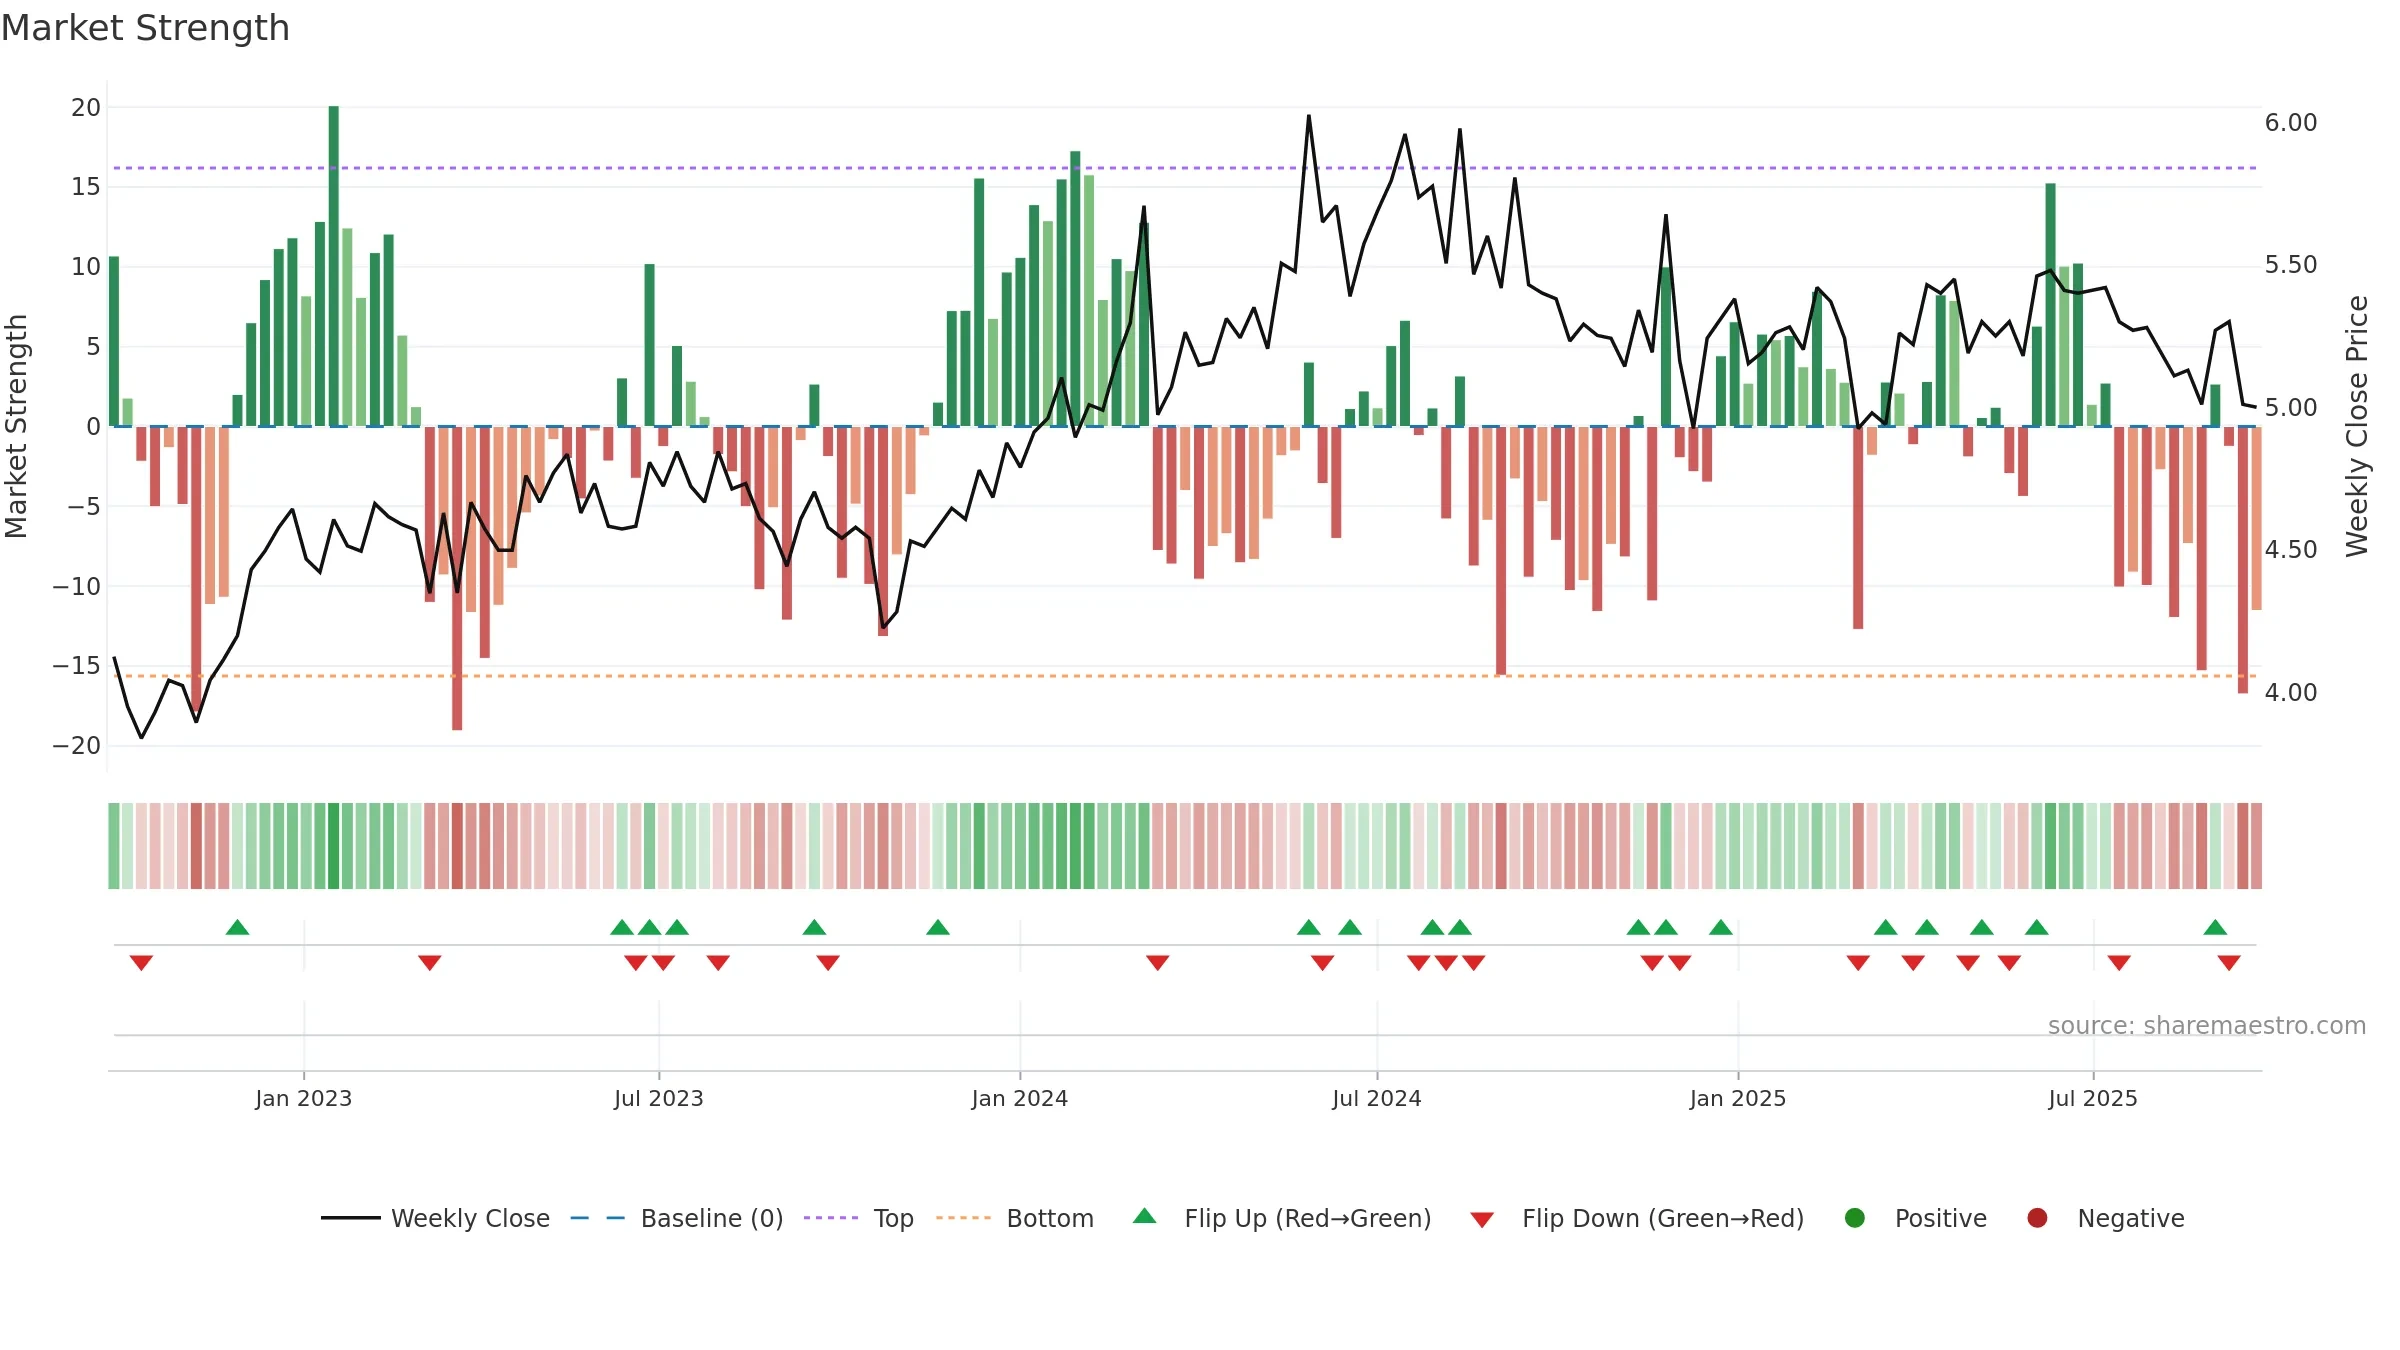
Relative strength is Negative
(< 0%, underperforming).
Latest MRS: -8.46% (week ending Fri, 26 Sep 2025).
Slope: Falling over 8w.
Notes:
- Below zero line indicates relative weakness vs benchmark.
- MRS slope falling over ~8 weeks.
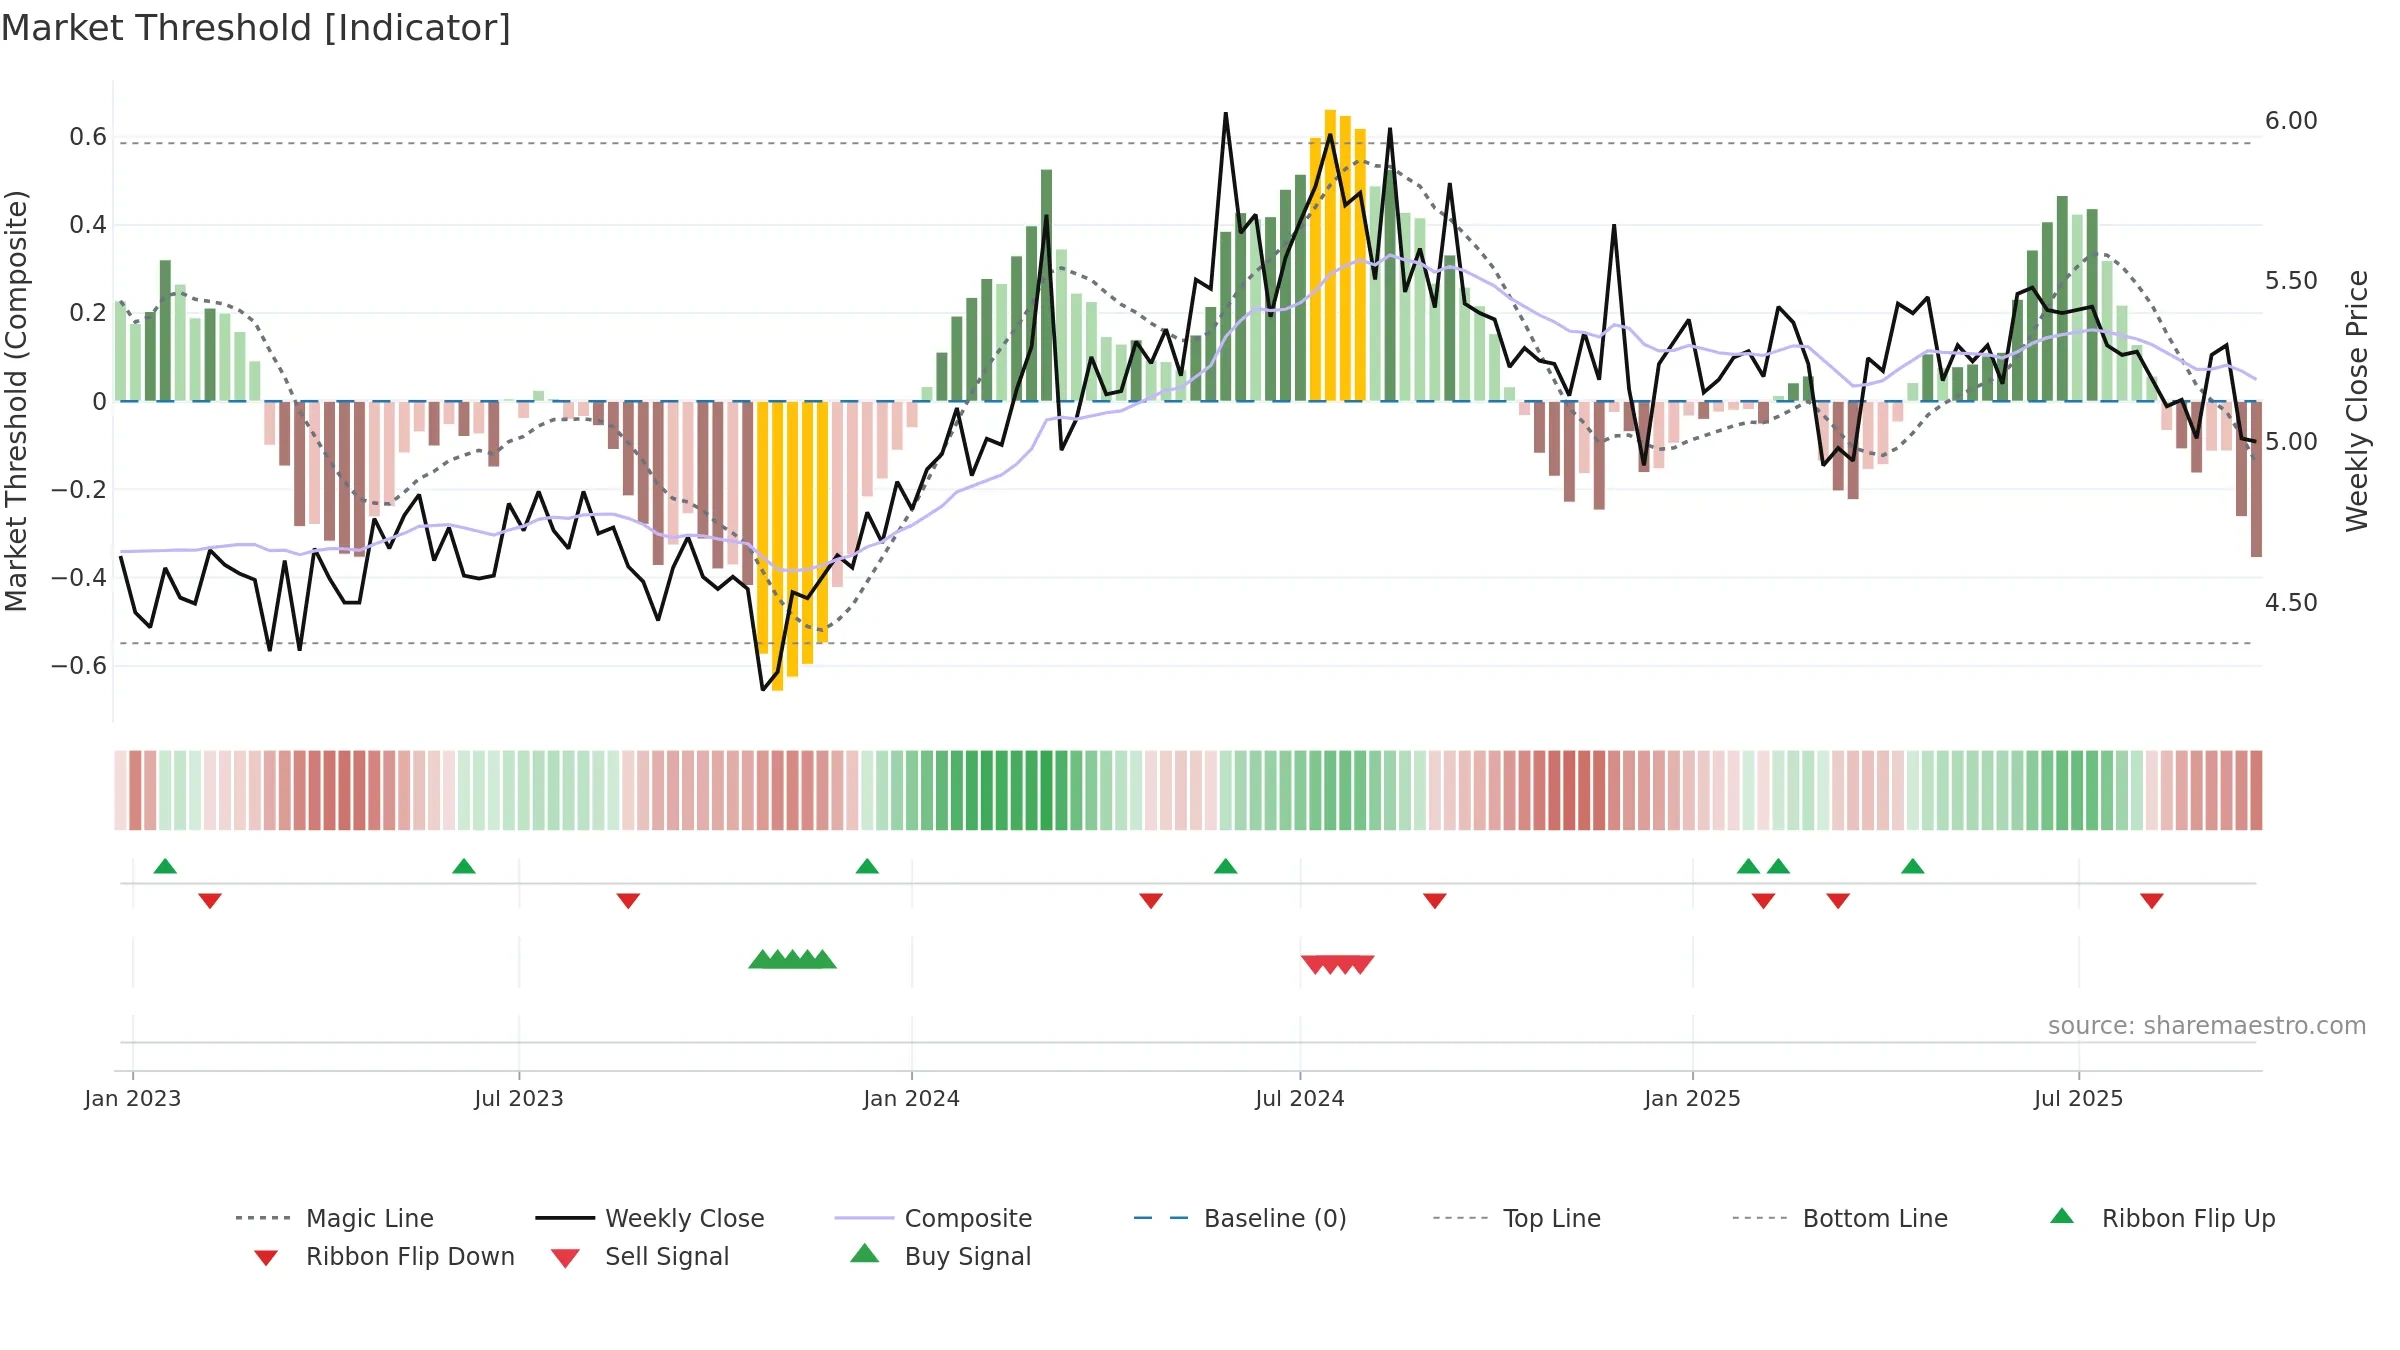
Conclusion
Negative setup. ★⯪☆☆☆ confidence. Trend: Range / Neutral · -3.66% over window · vol 2.22% · liquidity convergence · posture below · RS weak
- Liquidity confirms the price trend
- Momentum is weak/falling
- Price is not above key averages
- Negative multi-week performance
- Mansfield RS: weak & falling
Why: Price window -3.66% over w. Close is -5.66% below the prior-window high. Return volatility 2.22%. Volume trend falling. Liquidity convergence with price. Trend state range / neutral. 4–8w crossover bullish. Momentum bearish and falling.
Tip: Most metrics include a hover tooltip where they appear in the report.