Hua Eng Wire & Cable Co., Ltd.
1608 TPE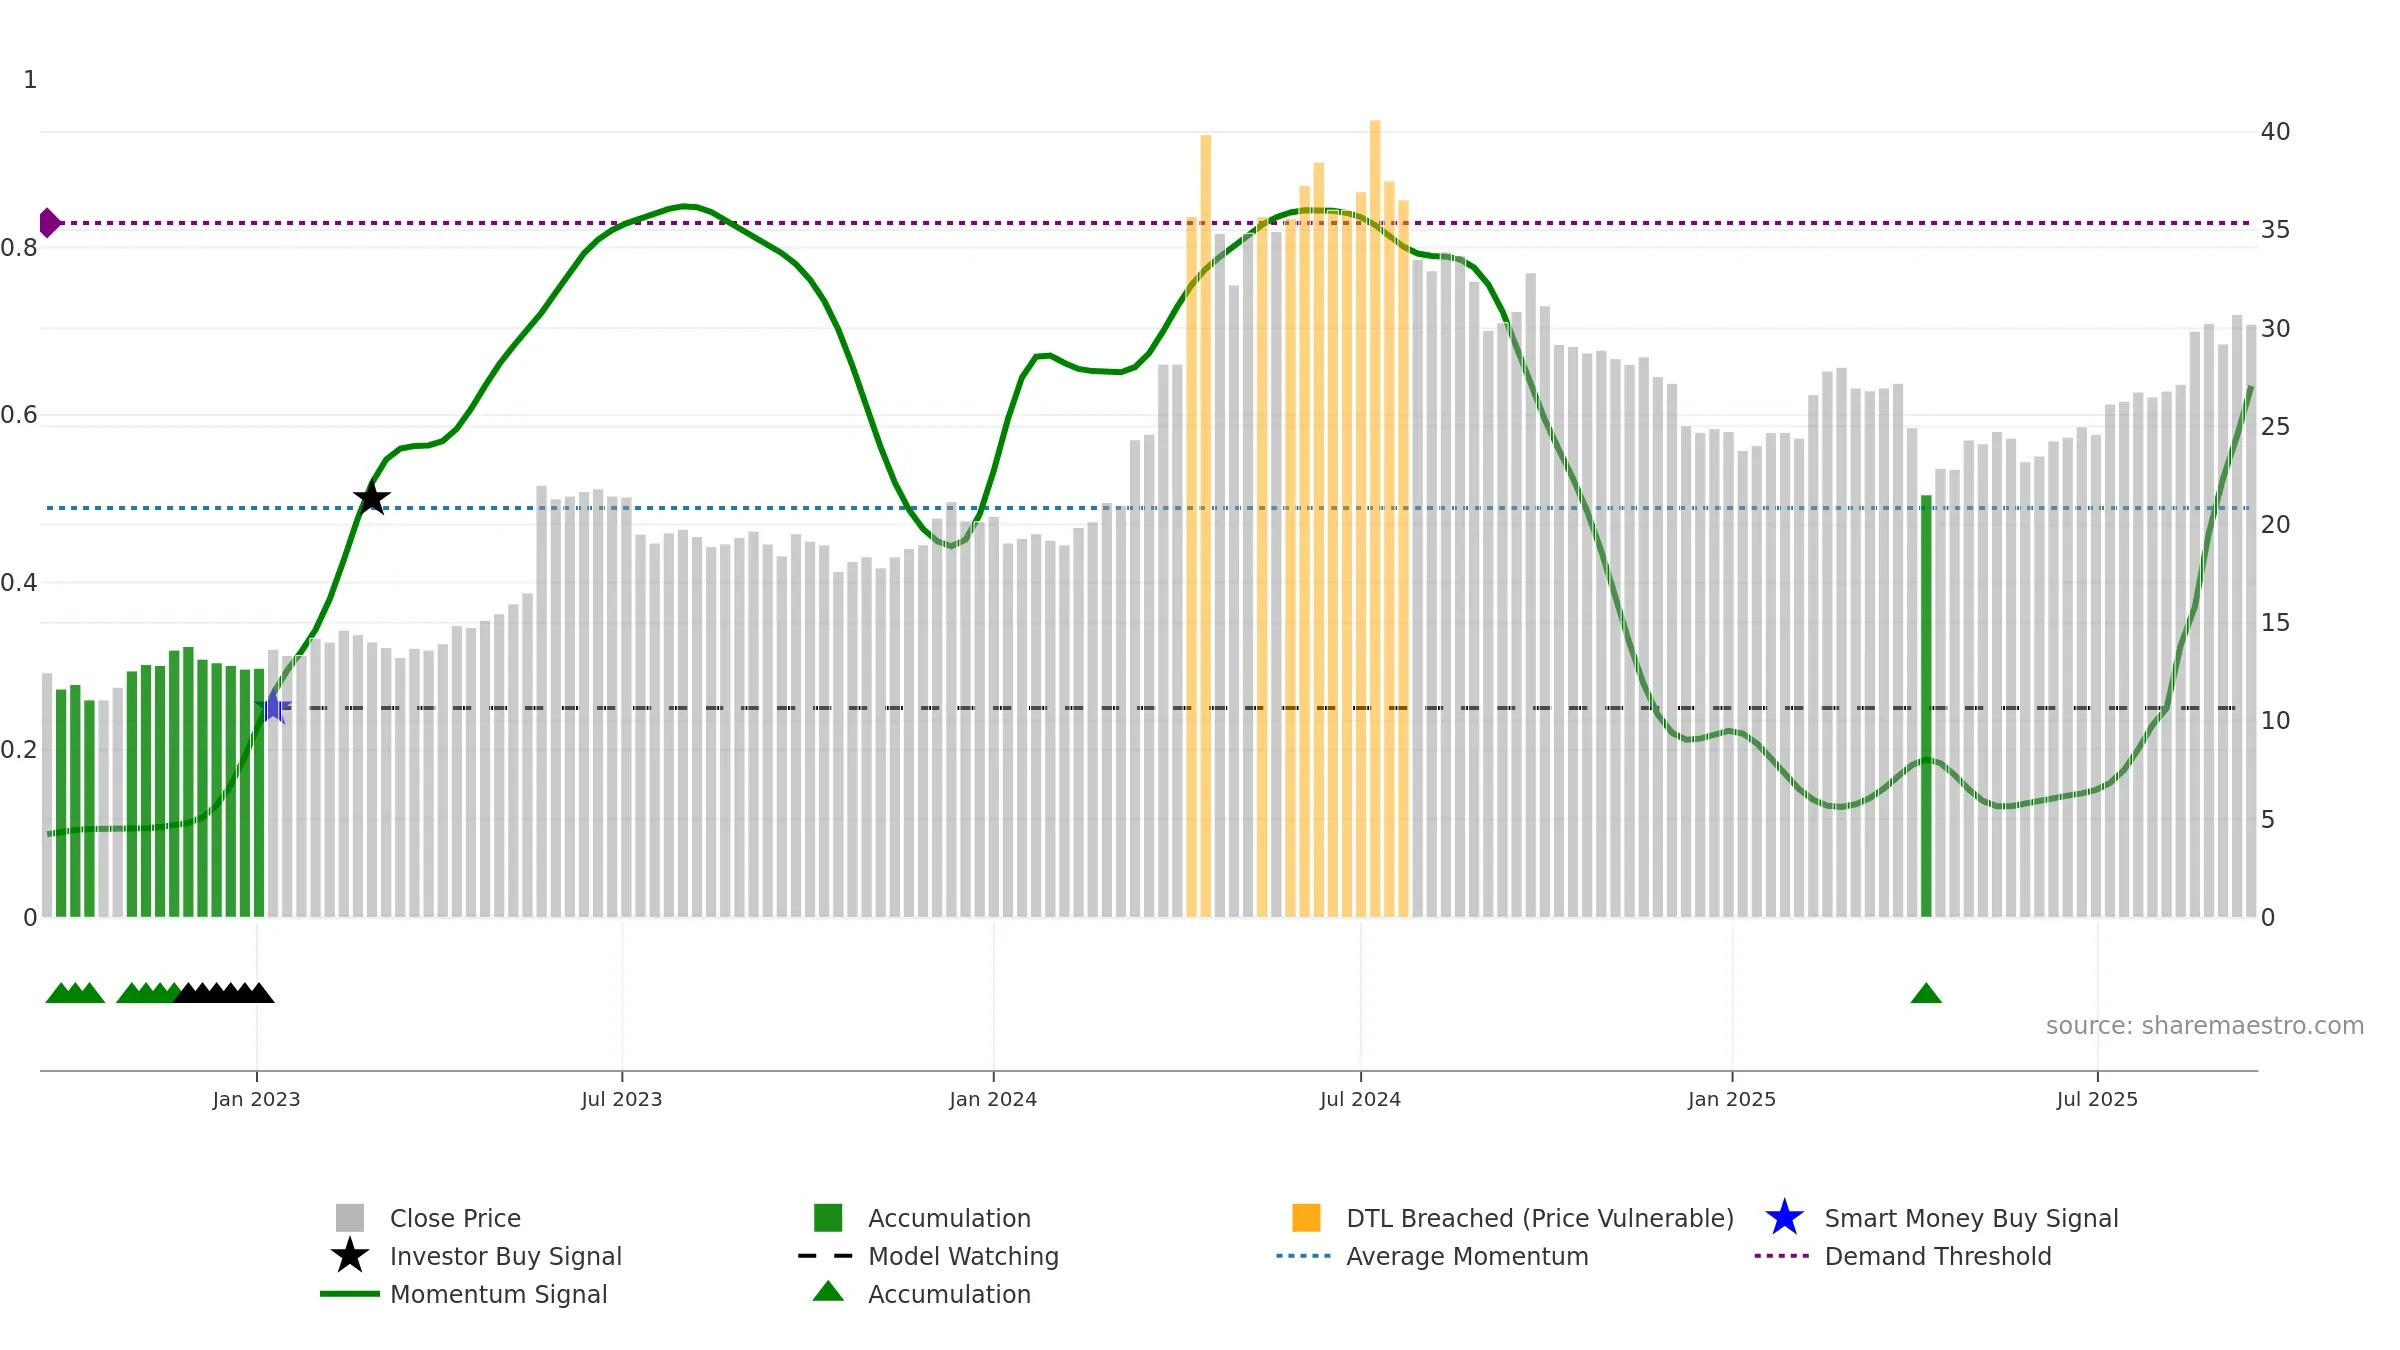
Weekly Report
Hua Eng Wire & Cable Co., Ltd. closed at 30.2000 (0.00% WoW) . Data window ends Mon, 15 Sep 2025.
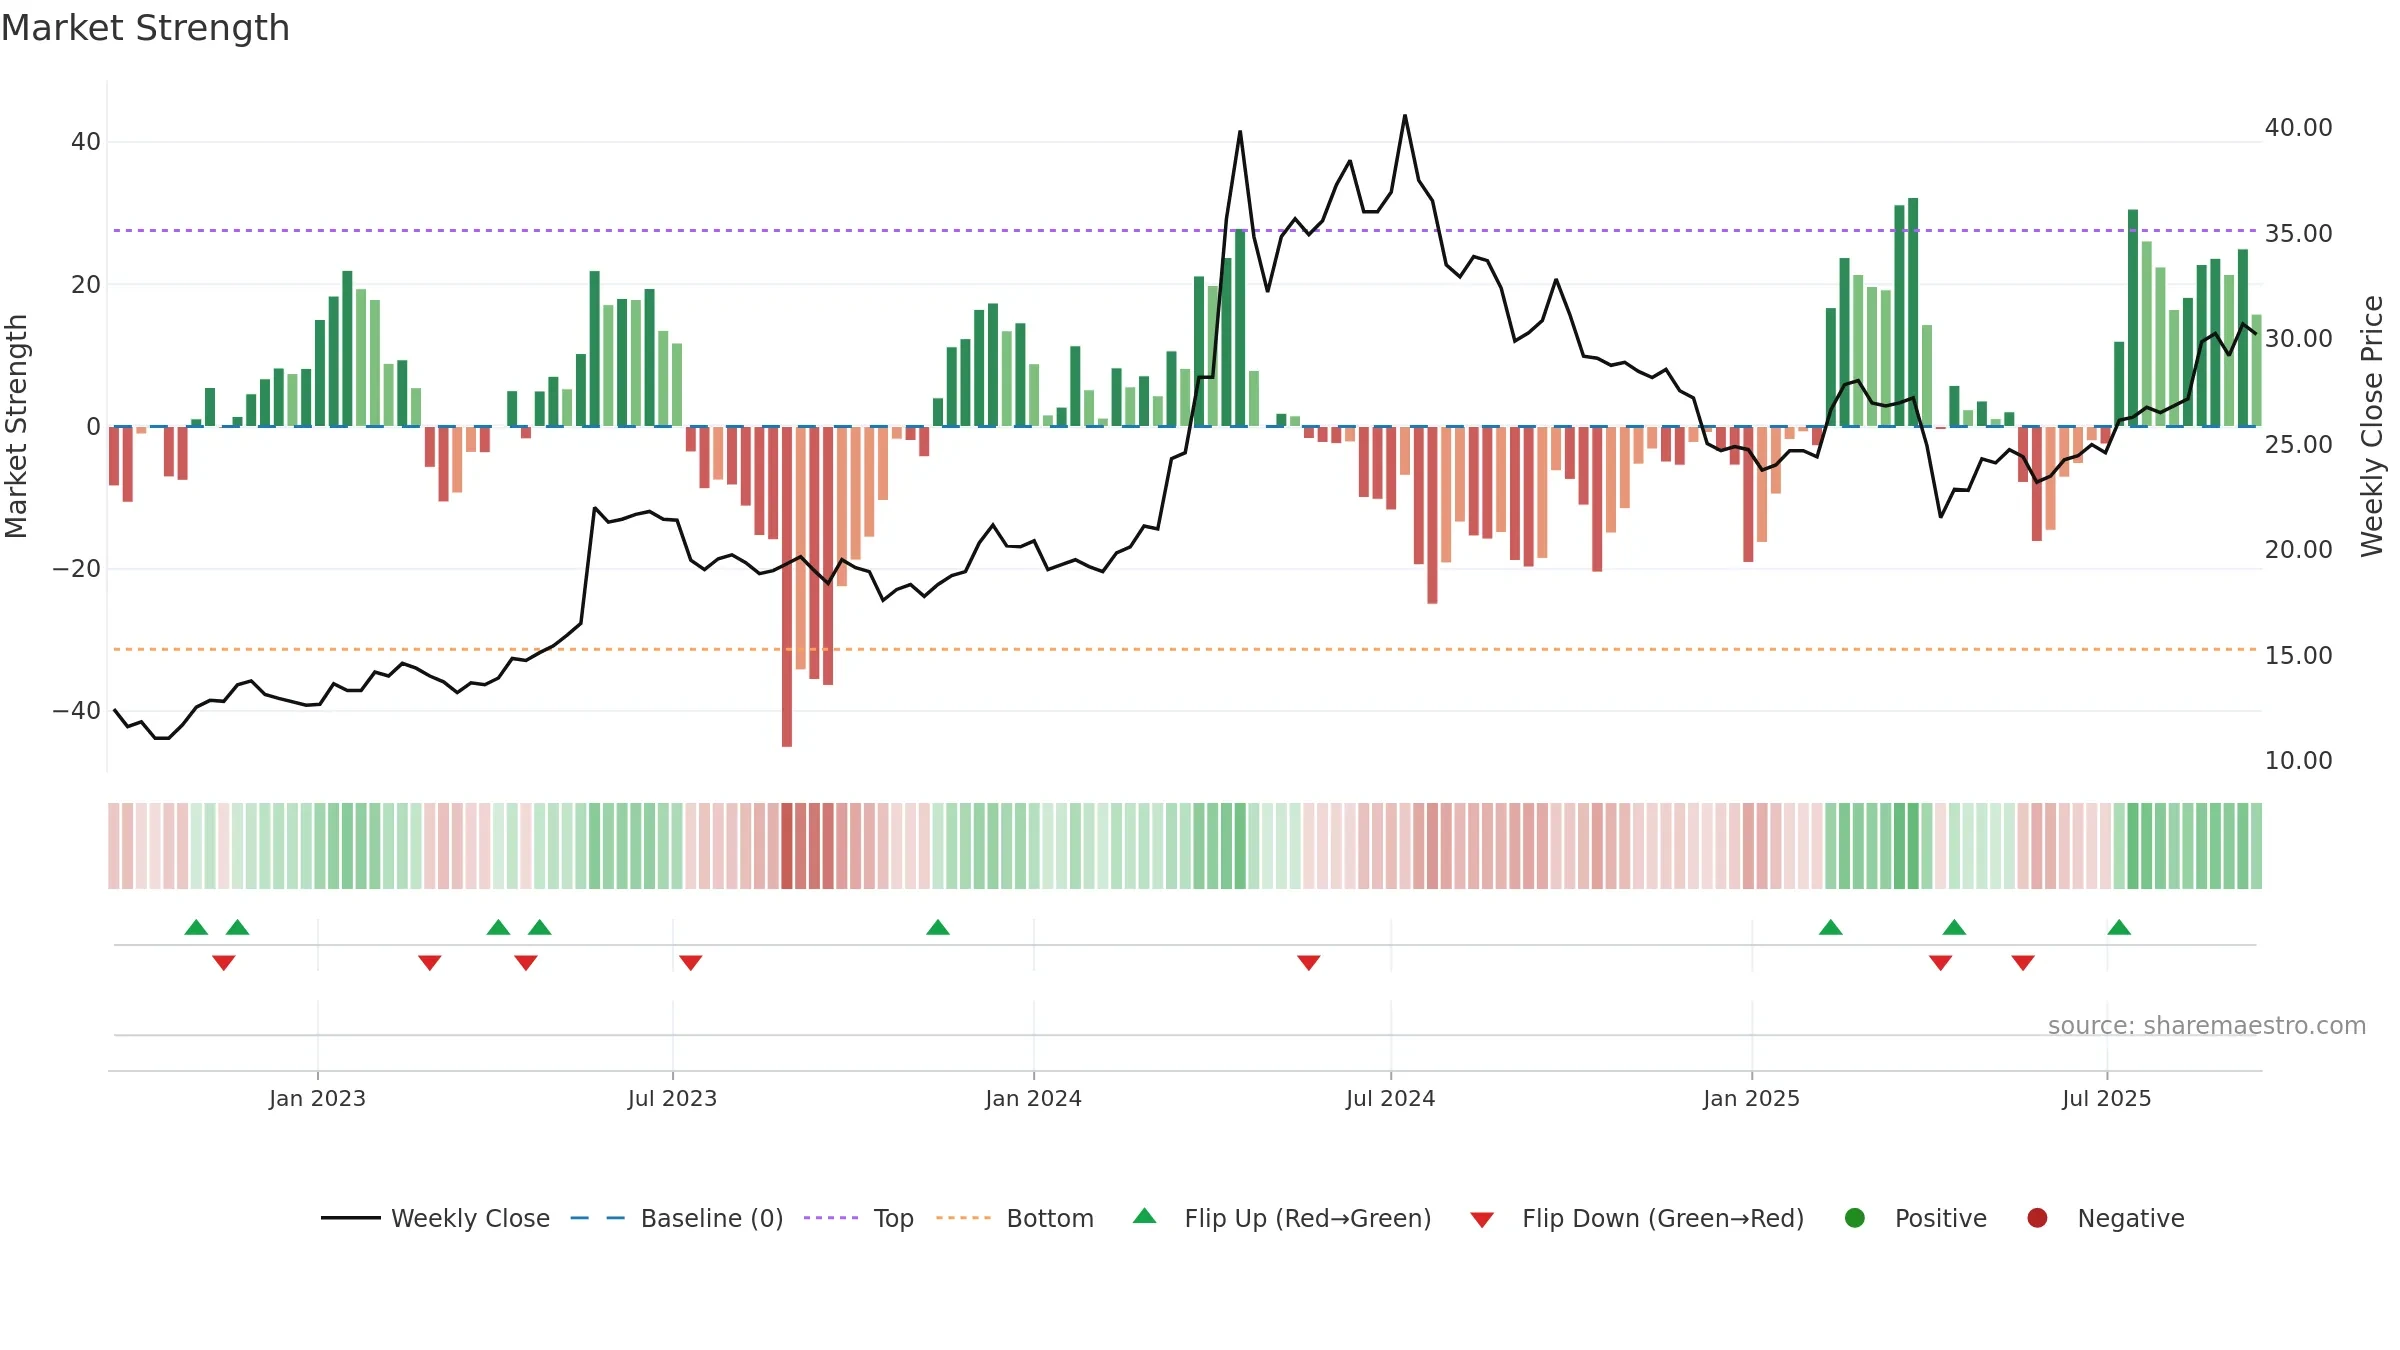
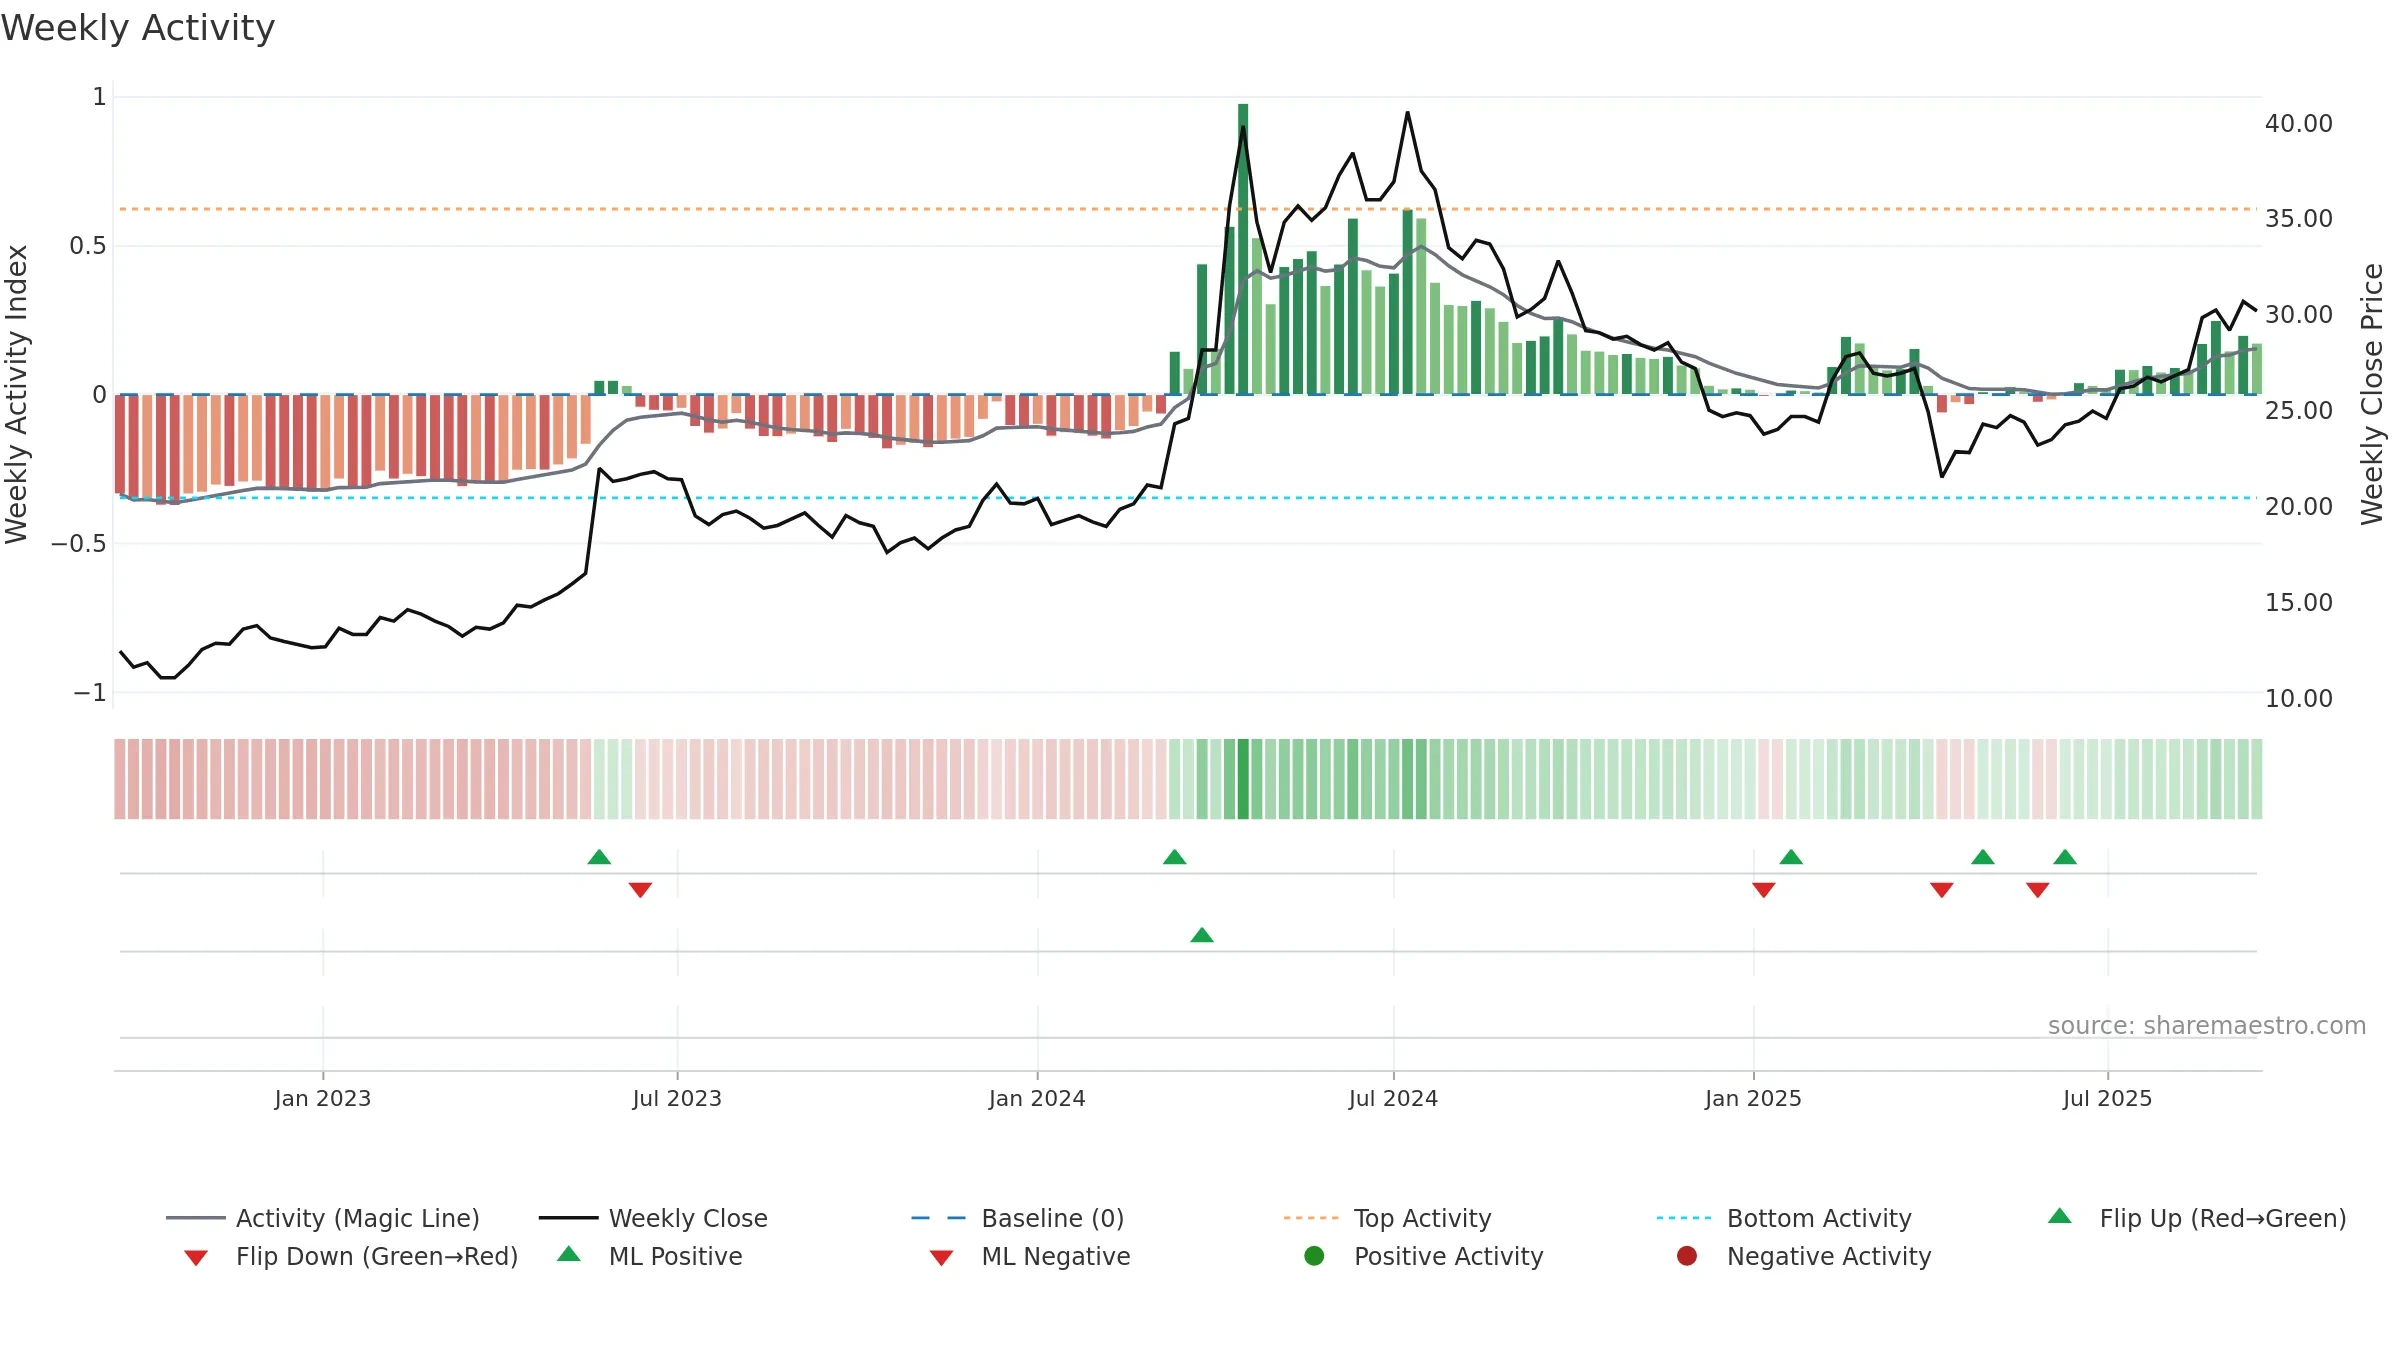
How to read this — Price slope is upward, indicating persistent buying over the window. Volume and price are moving in the same direction — a constructive confirmation. Returns are positively correlated with volume — strength tends to arrive on higher activity. Distance to baseline is narrowing — reverting closer to its fair-value track. Constructive MA stack supports the up-drift; pullbacks may find support at the 8–13 week region. Price holds above key averages, indicating constructive participation.
Up-slope supports buying interest; pullbacks may be contained if activity stays firm.
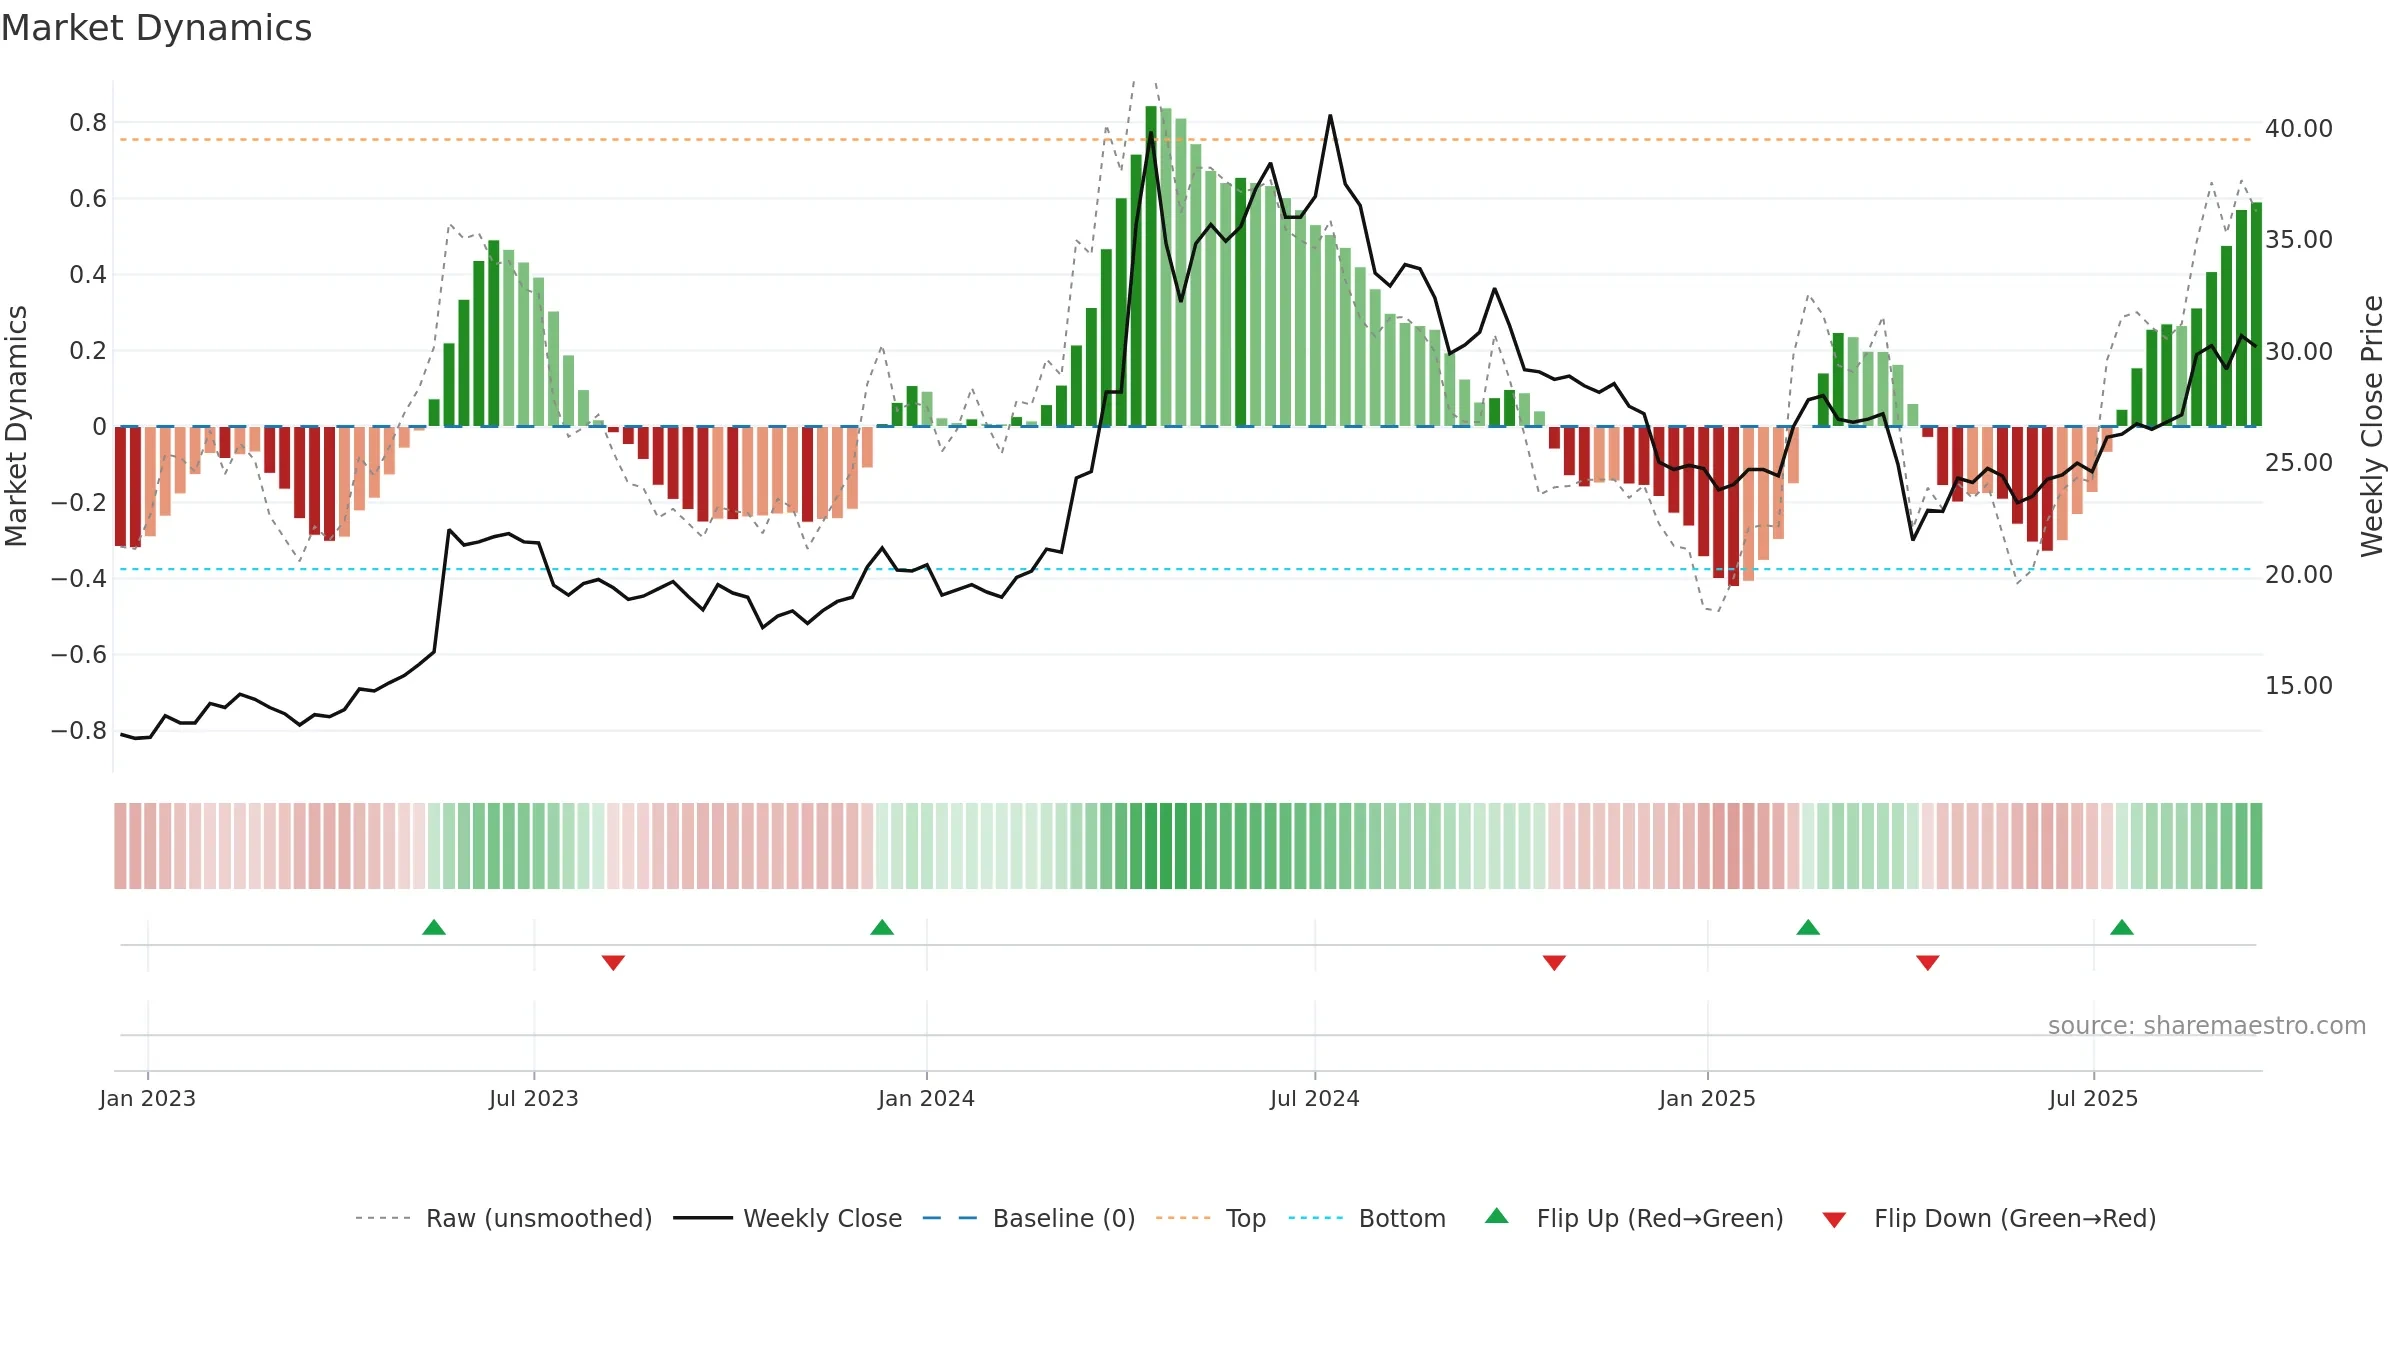
Gauge maps the trend signal to a 0–100 scale.
How to read this — High gauge and rising momentum — buyers in control.
Bias remains higher; pullbacks could be buyable if participation holds.
Price is above fair value; upside may be capped without catalysts.
Conclusion
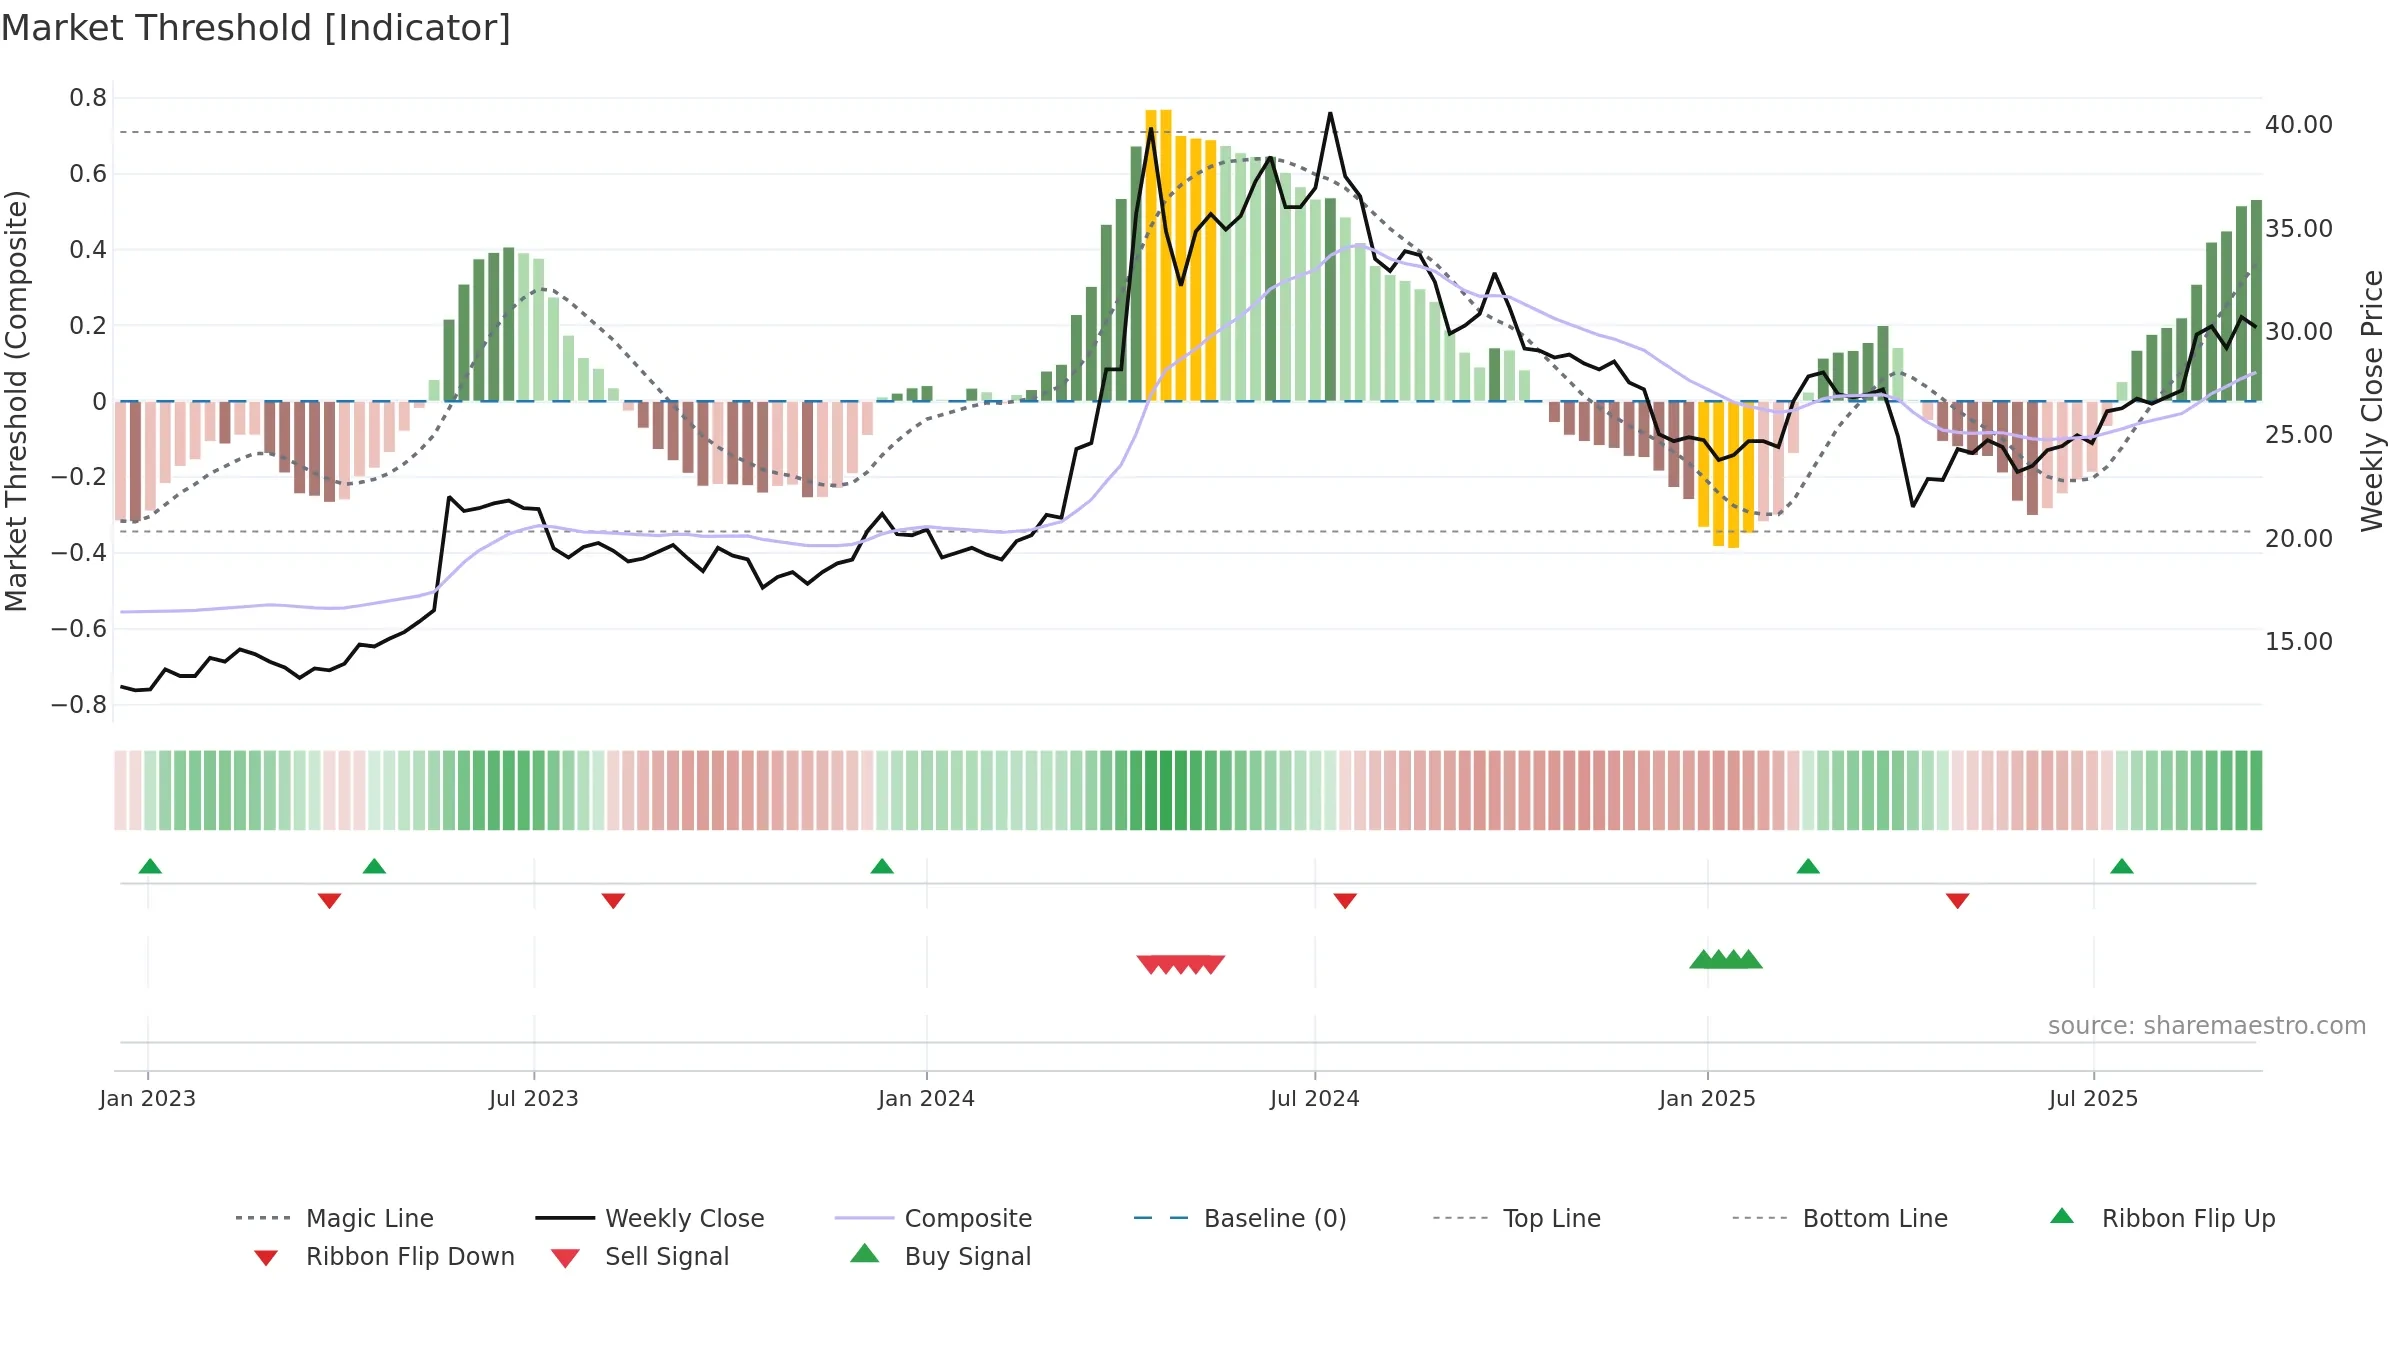
Positive setup. ★★★★☆ confidence. Price window: 13. Trend: Strong Uptrend; gauge 63. In combination, liquidity confirms the move.
- High gauge with rising momentum (strong uptrend)
- Momentum is bullish and rising
- Price holds above 8w & 26w averages
- Constructive moving-average stack
Why: Price window 13.96% over 8w. Close is -1.63% below the prior-window high. Volume trend rising. Liquidity convergence with price. Trend state strong uptrend. Low-regime (≤0.25) upticks 2/2 (100.0%) • Accumulating. MA stack constructive. Momentum bullish and rising. Valuation limited upside without catalysts.
Tip: Most metrics include a hover tooltip where they appear in the report.