Egetis Therapeutics AB (publ)
EGTX STO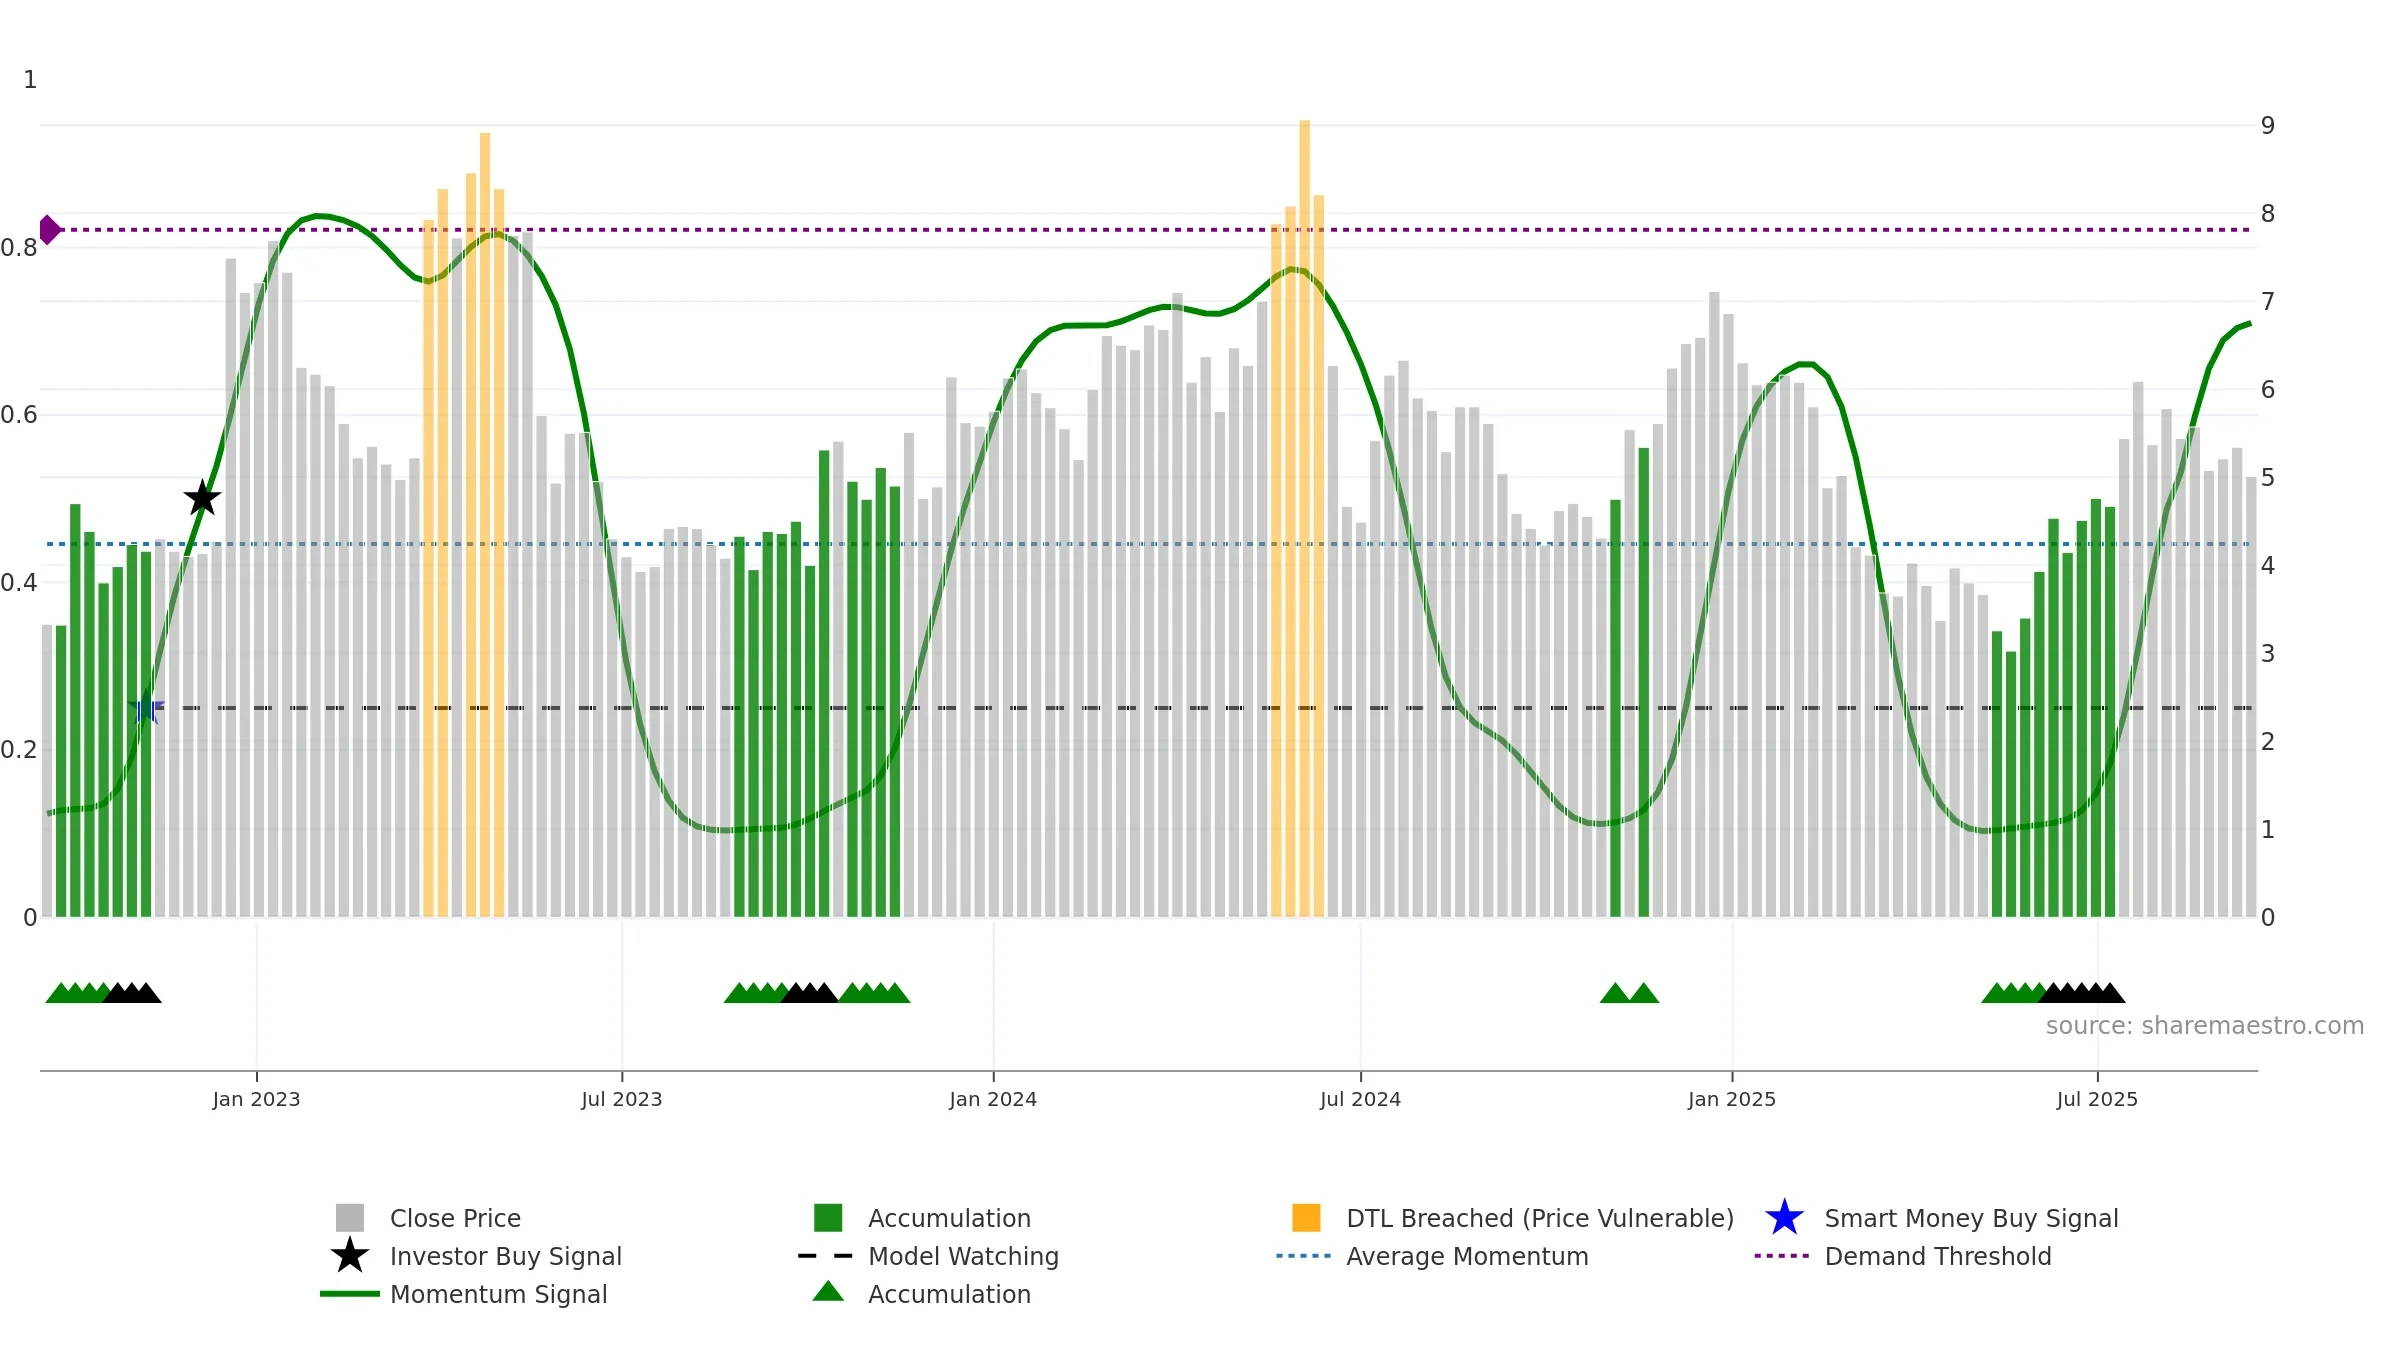
Weekly Report
Egetis Therapeutics AB (publ) closed at 5.0100 (0.70% WoW) . Data window ends Mon, 15 Sep 2025.
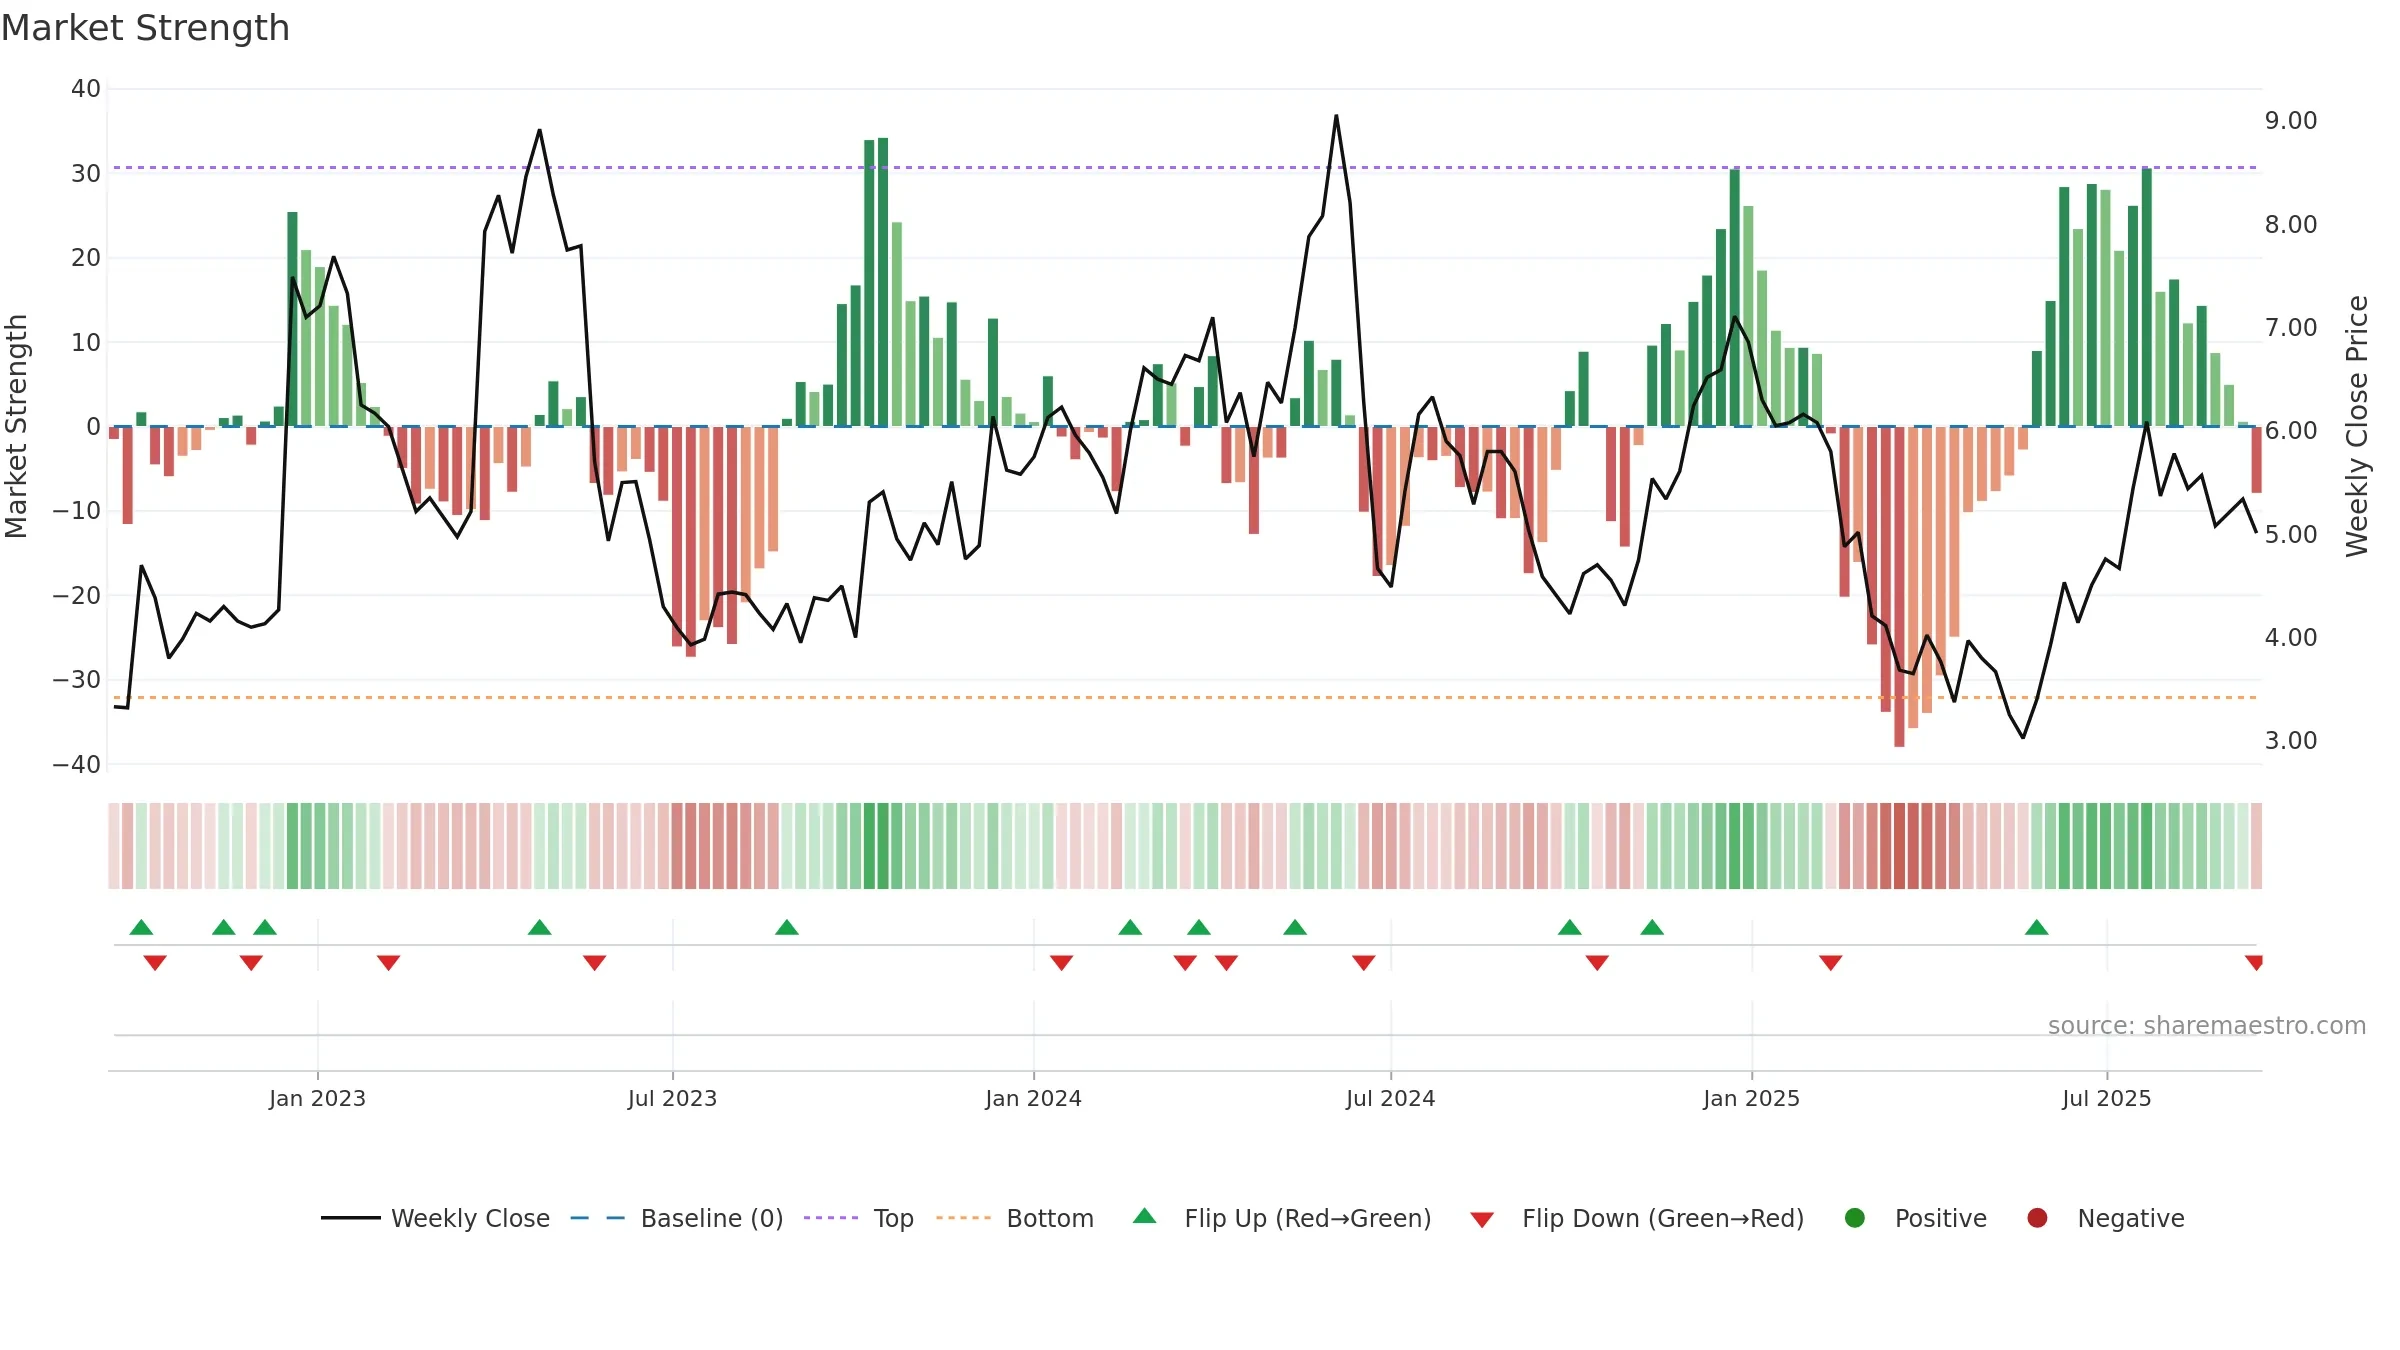
How to read this — Price slope is downward, indicating persistent supply pressure. Elevated weekly volatility increases whipsaw risk. Volume and price are moving in the same direction — a constructive confirmation. Distance to baseline is narrowing — reverting closer to its fair-value track.
Down-slope argues for patience; rallies can fade sooner unless participation improves.
Gauge maps the trend signal to a 0–100 scale.
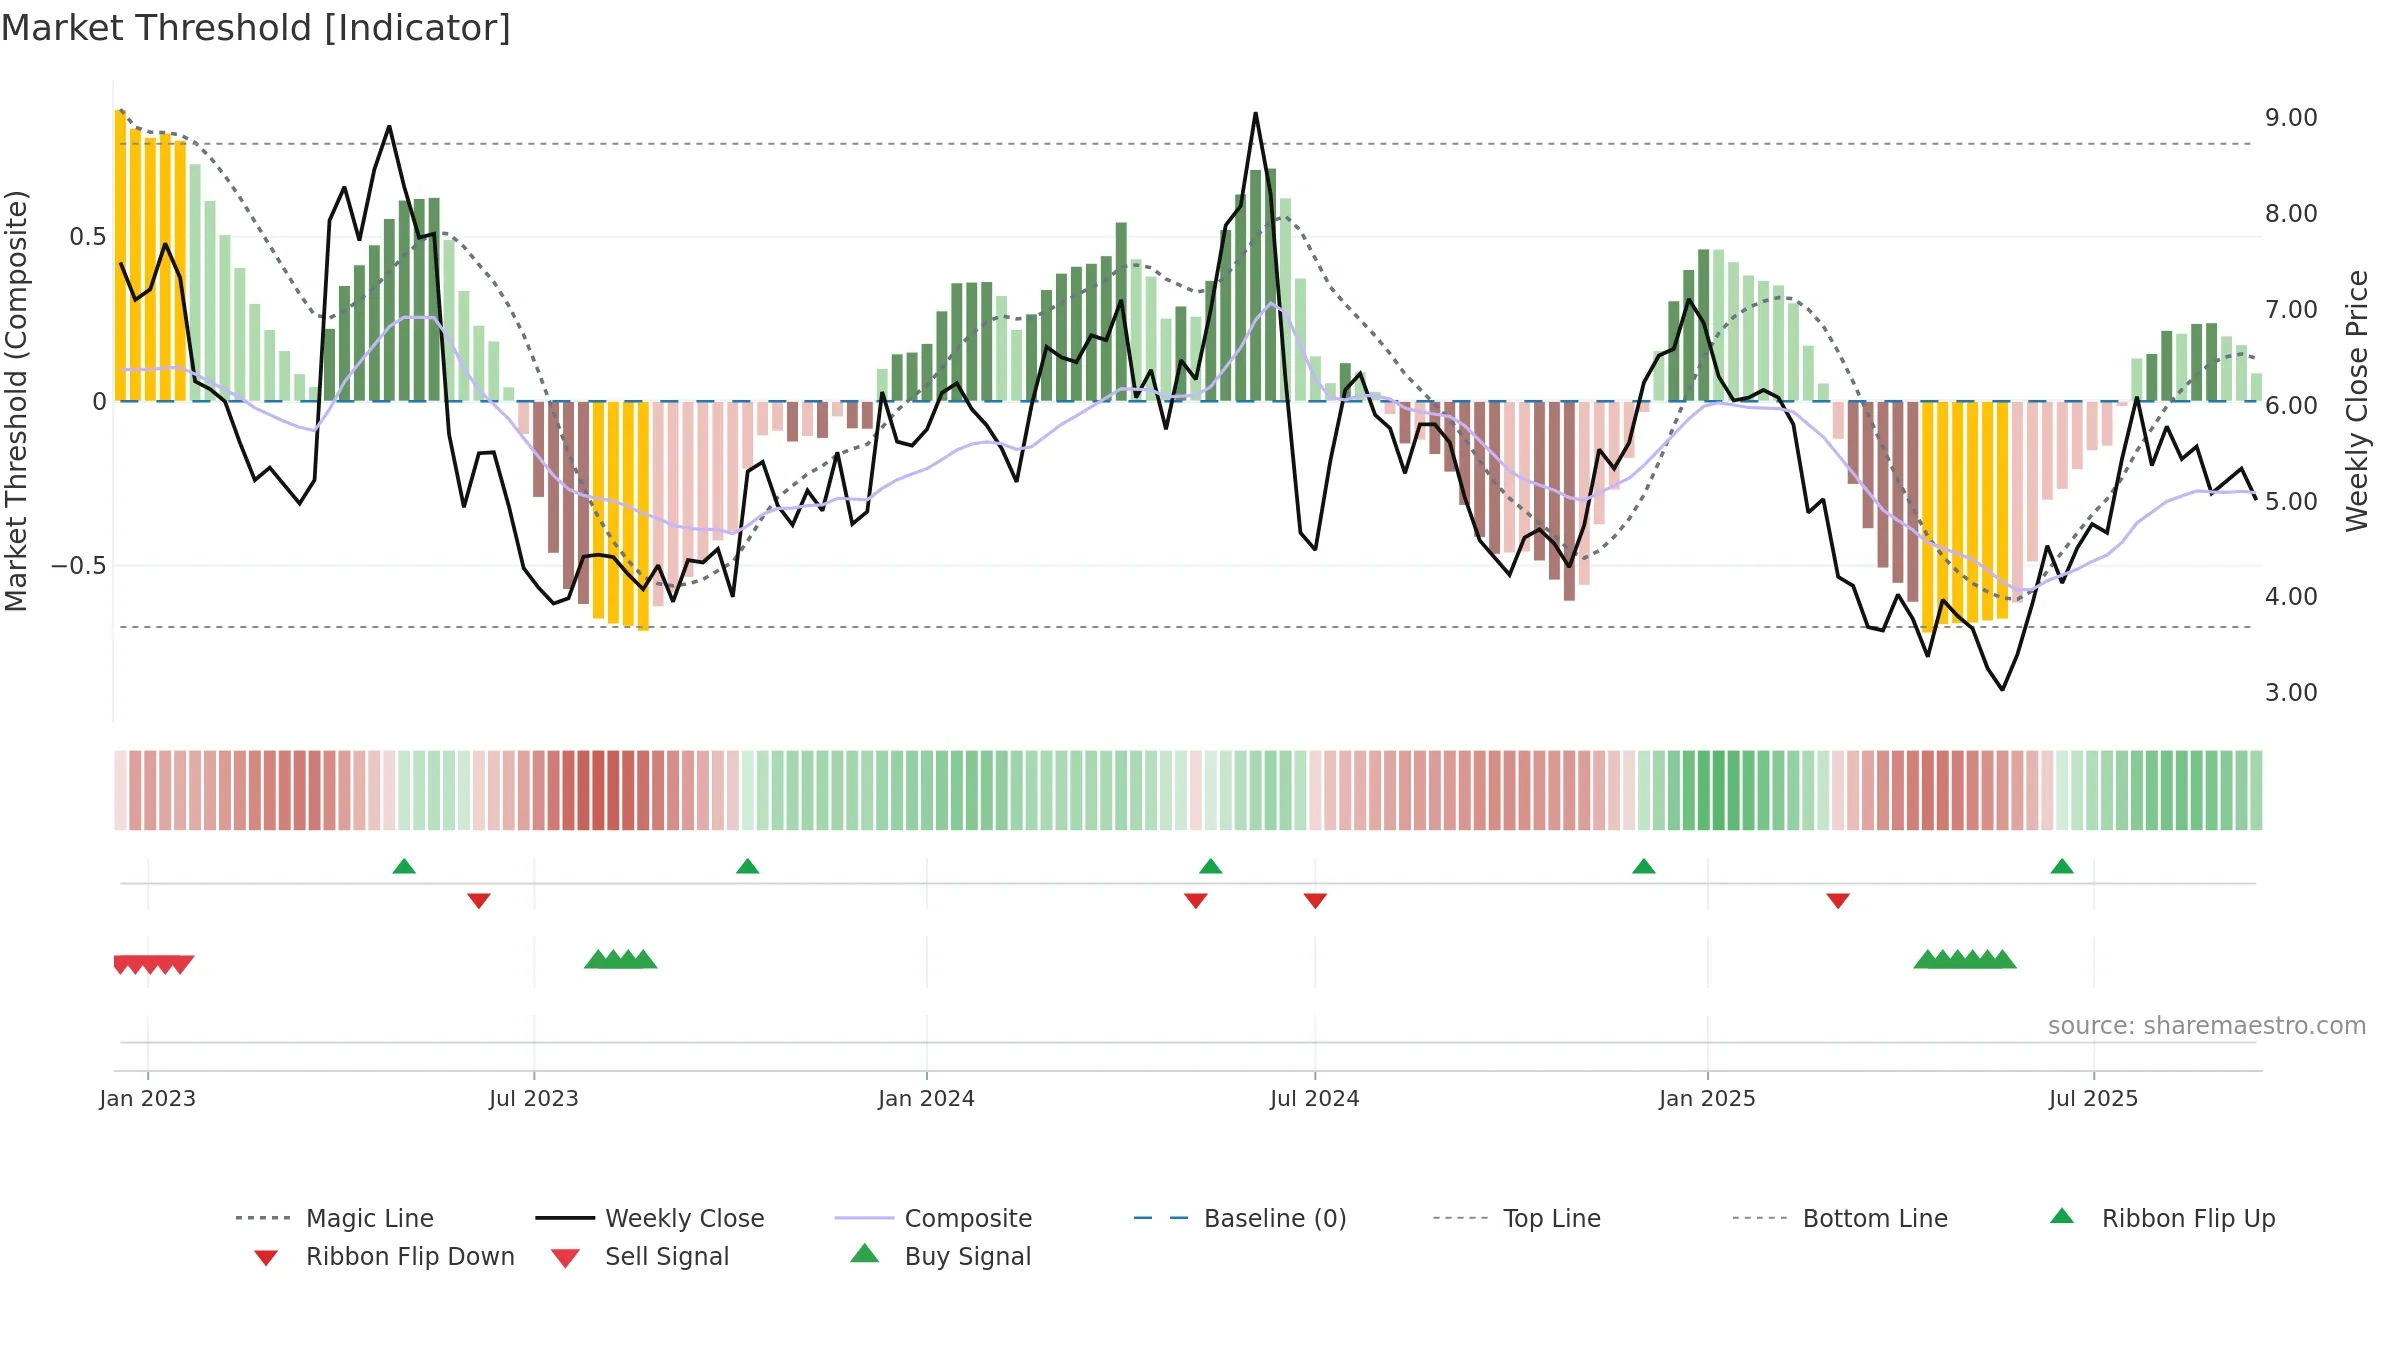
How to read this — Range-bound conditions; conviction is limited until a break or acceleration emerges.
Wait for a directional break or improving acceleration.
Price is above fair value; upside may be capped without catalysts.
Conclusion
Neutral setup. ★★★☆☆ confidence. Price window: -6. Trend: Range / Neutral; gauge 71. In combination, liquidity confirms the move.
- Momentum is bullish and rising
- Liquidity confirms the price trend
- Price is not above key averages
- High return volatility raises whipsaw risk
- Negative multi-week performance
Why: Price window -6.70% over 8w. Close is -13.32% below the prior-window high. Return volatility 5.77%. Volume trend falling. Liquidity convergence with price. Trend state range / neutral. Momentum bullish and rising. Valuation limited upside without catalysts.
Tip: Most metrics include a hover tooltip where they appear in the report.