Cosmo Advanced Materials & Technology Co., Ltd.
005070 KRX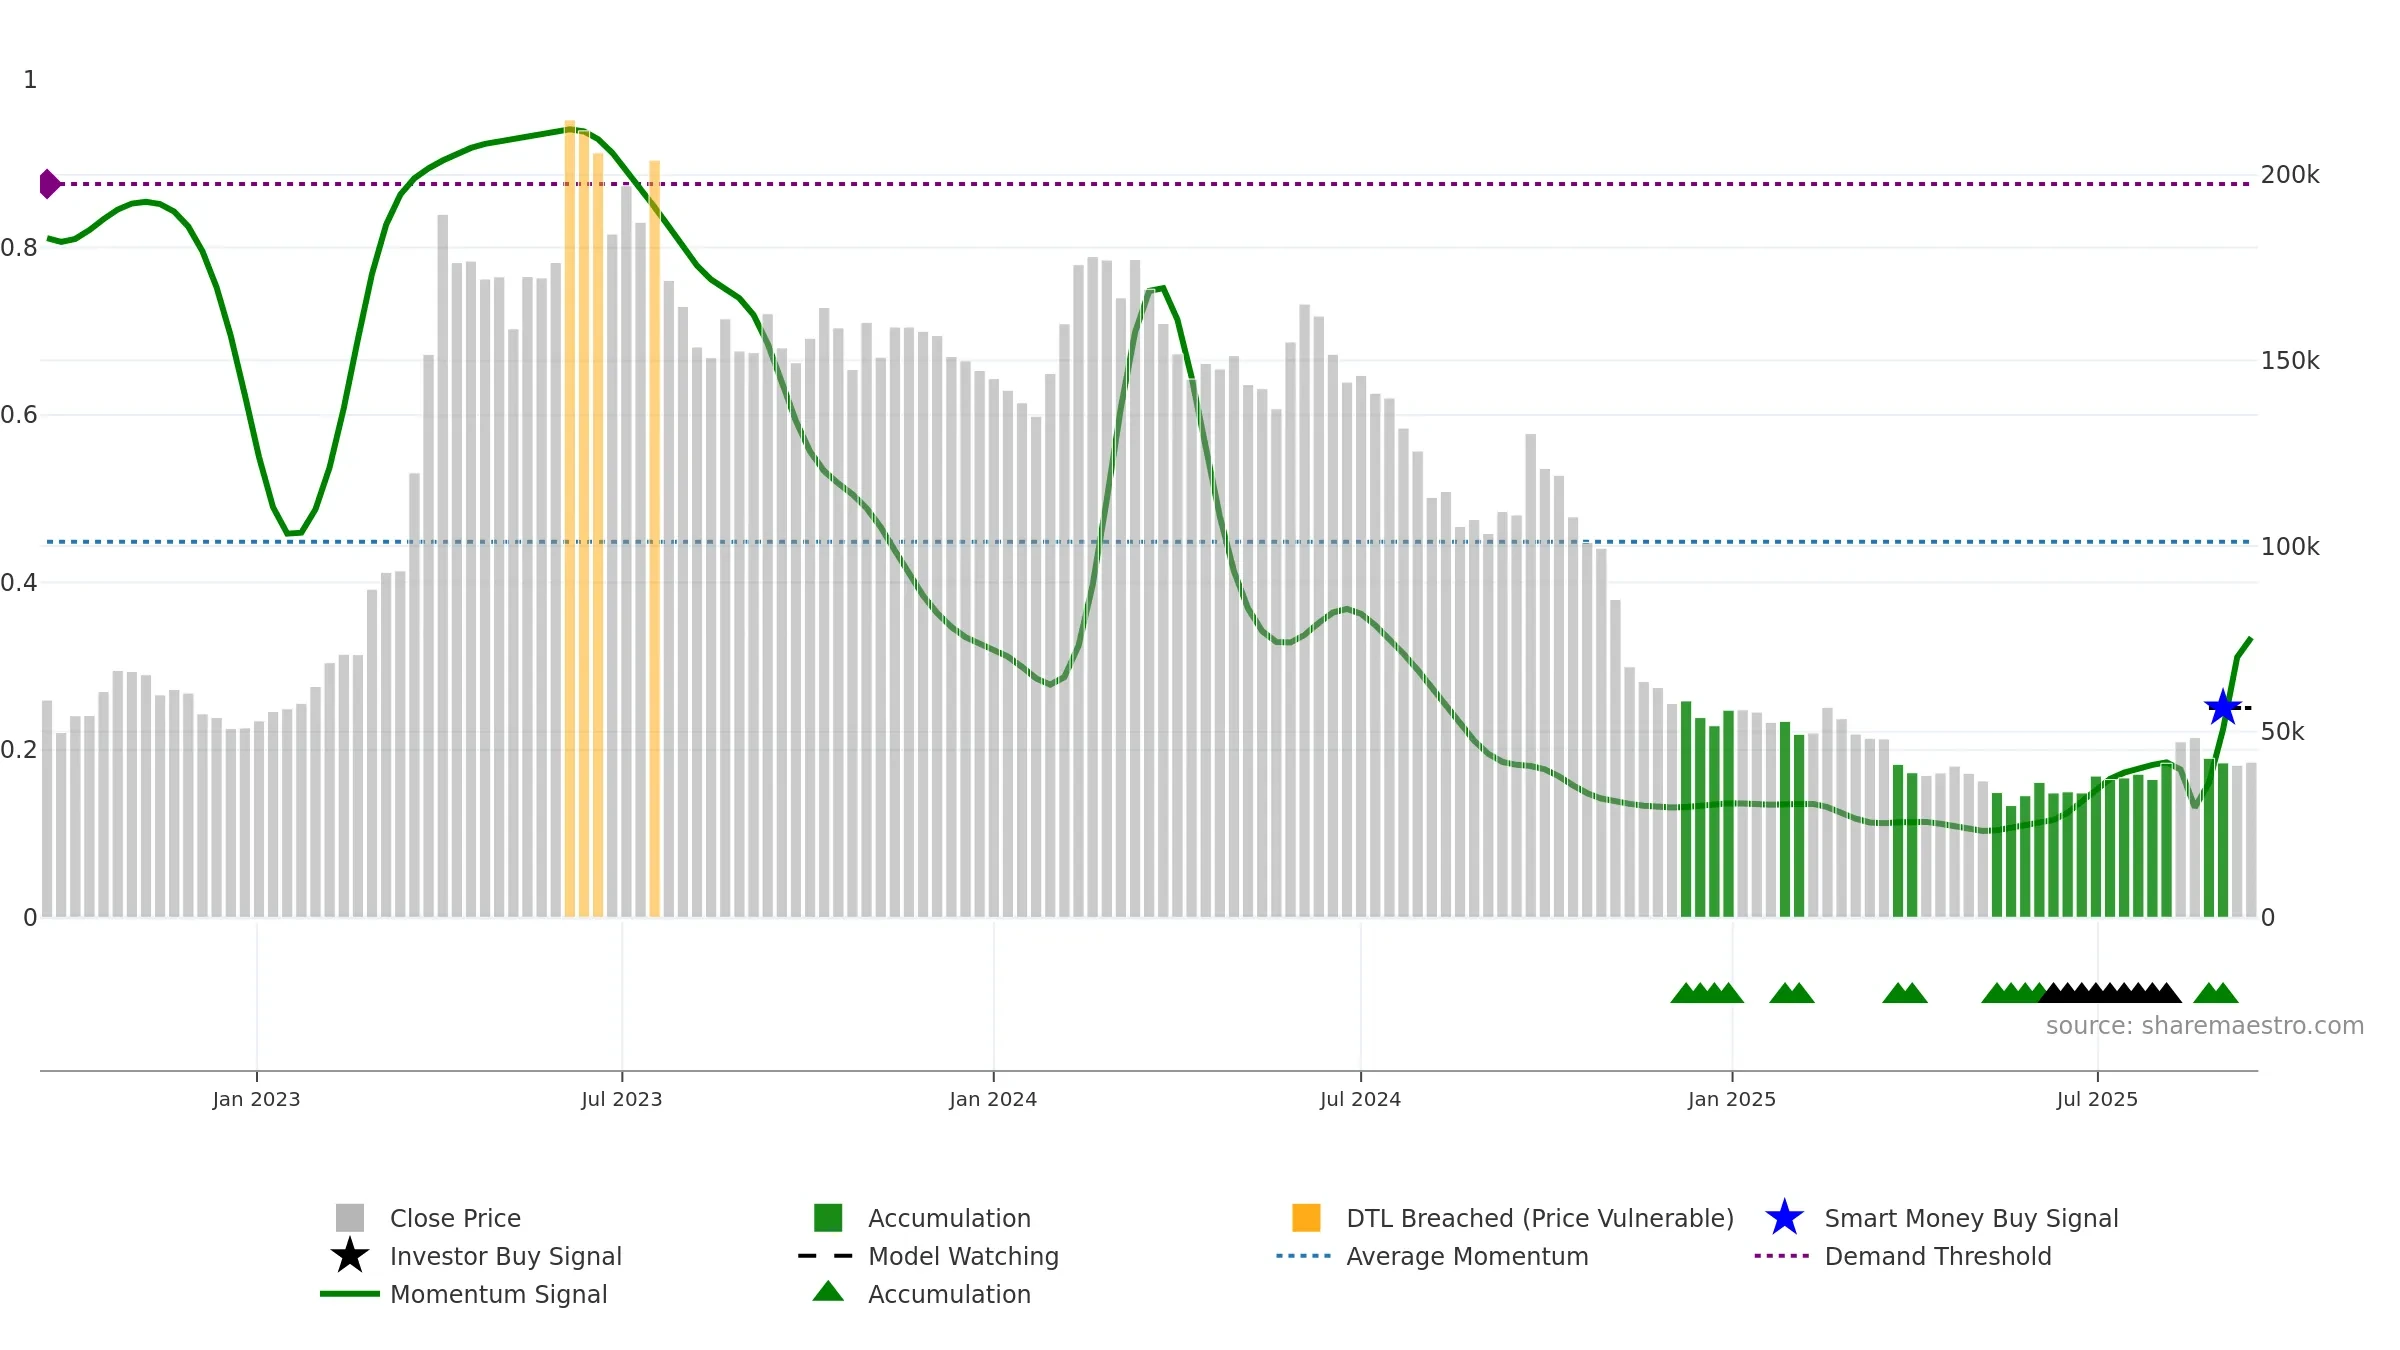
Weekly Report
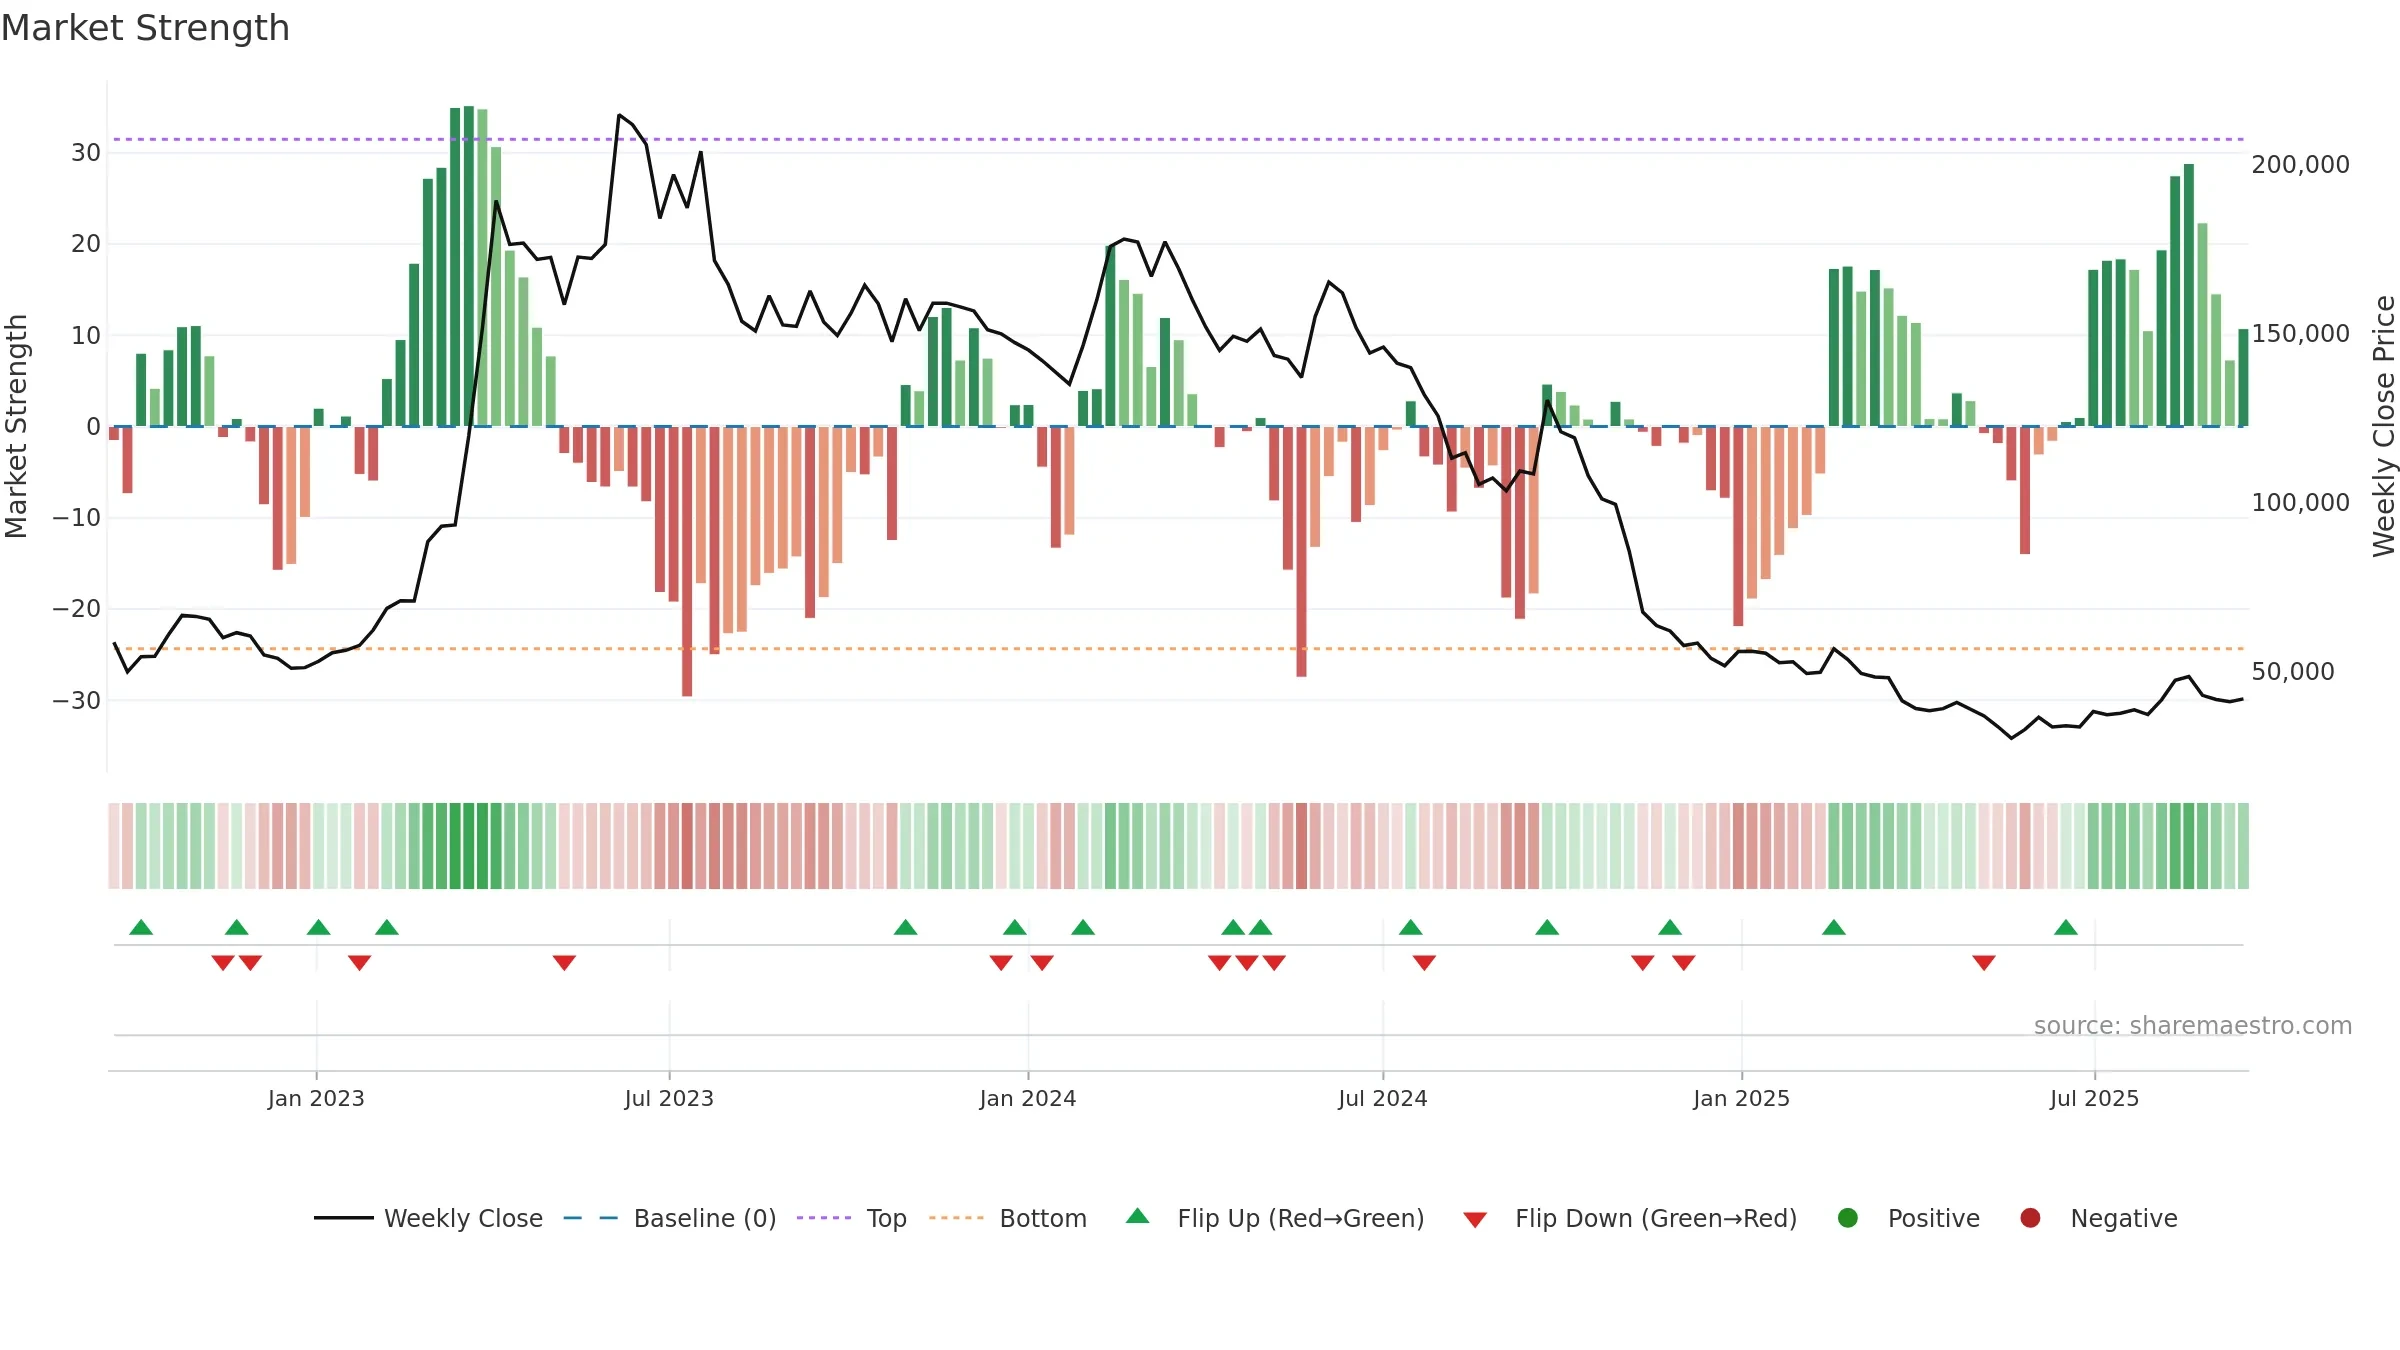
Cosmo Advanced Materials & Technology Co., Ltd. closed at 41800.0000 (-1.53% WoW) . Data window ends Mon, 15 Sep 2025.
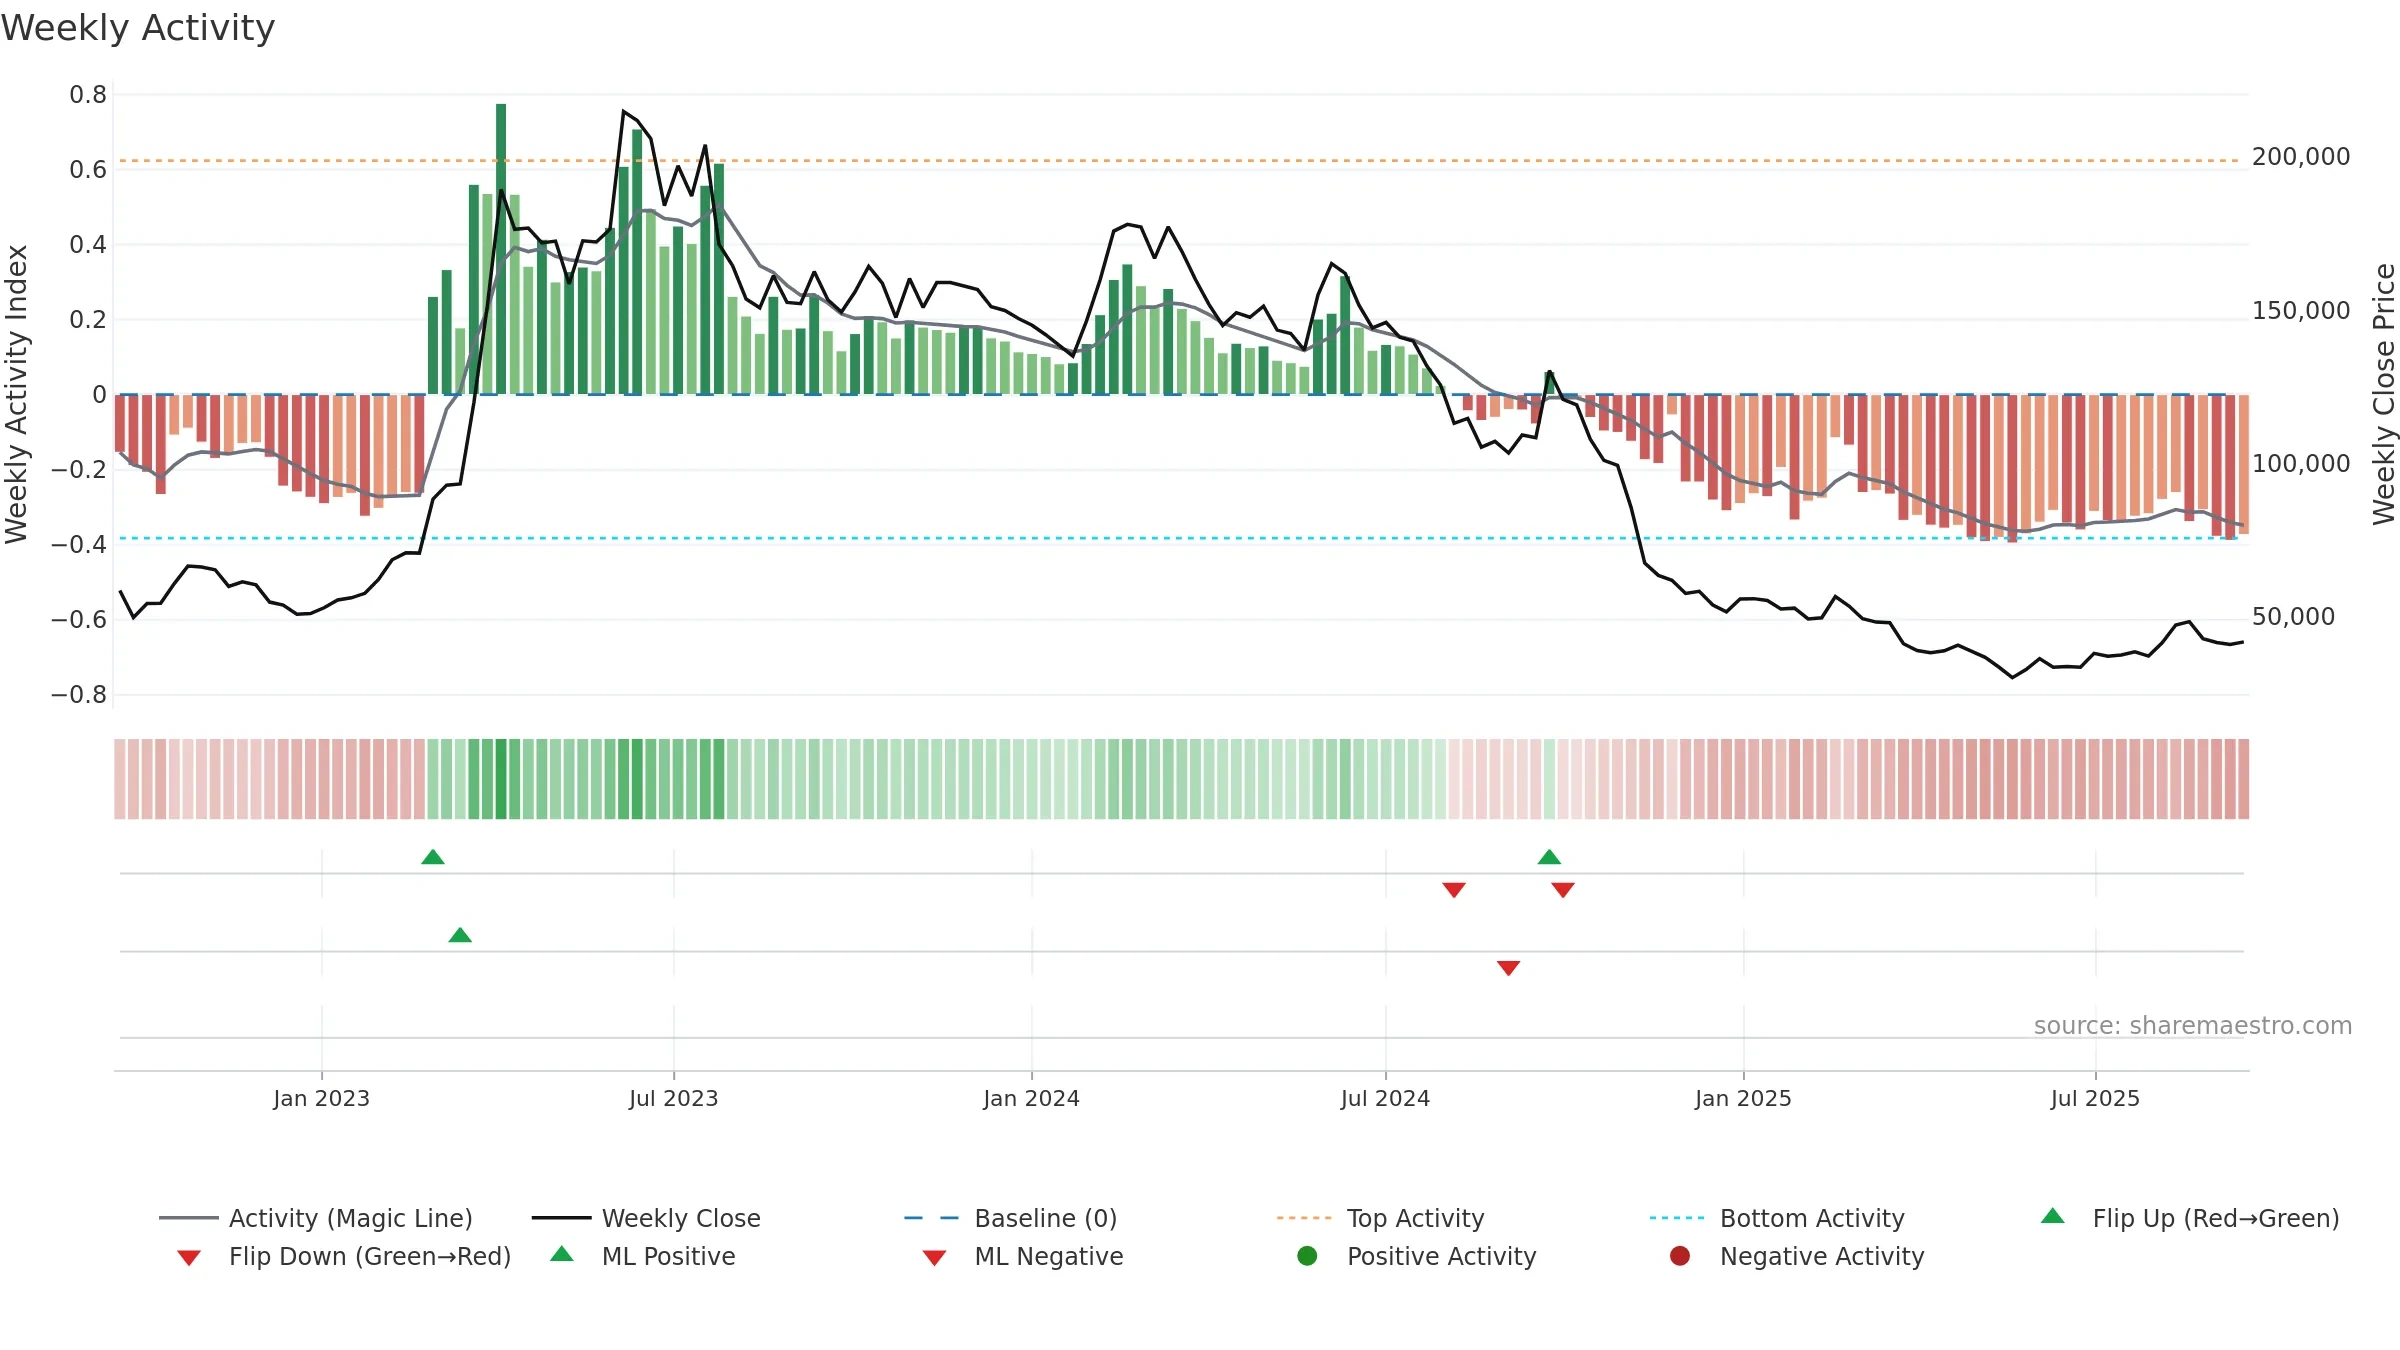
How to read this — Price slope is upward, indicating persistent buying over the window. Elevated weekly volatility increases whipsaw risk. Volume trend diverges from price — watch for fatigue or rotation. Returns are positively correlated with volume — strength tends to arrive on higher activity. Distance to baseline is narrowing — reverting closer to its fair-value track. Fresh short-term downside crossover weakens near-term tone.
Up-slope supports buying interest; pullbacks may be contained if activity stays firm. Because liquidity isn’t confirming, prefer evidence of fresh demand before chasing moves.
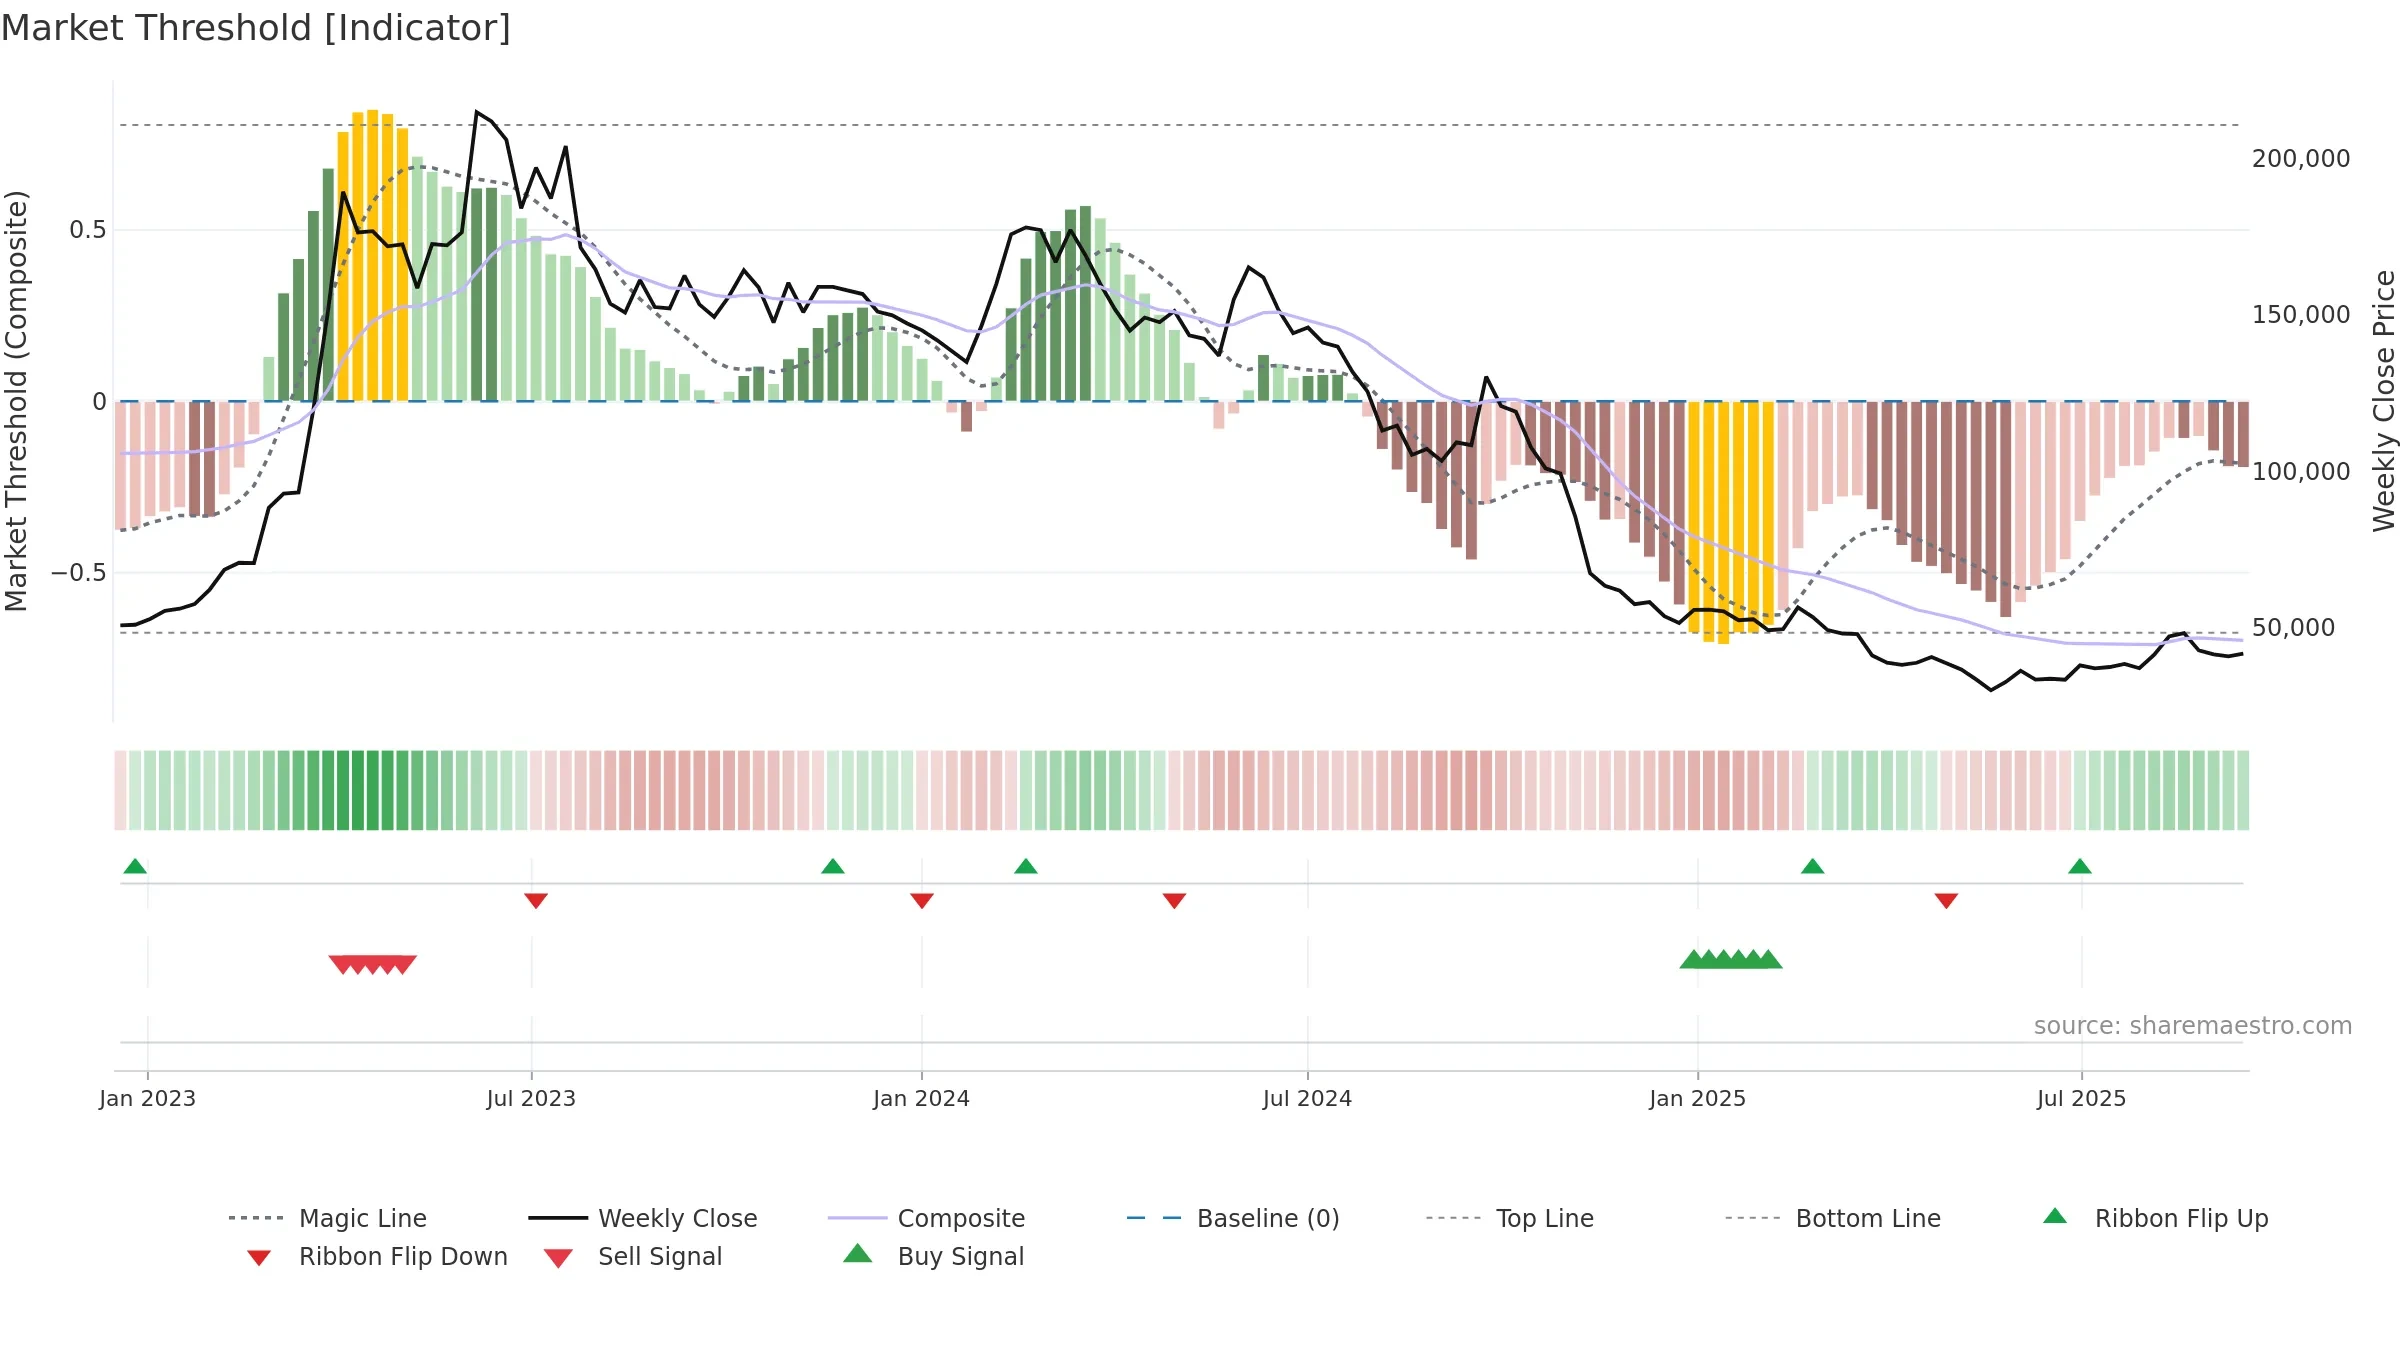
Gauge maps the trend signal to a 0–100 scale.
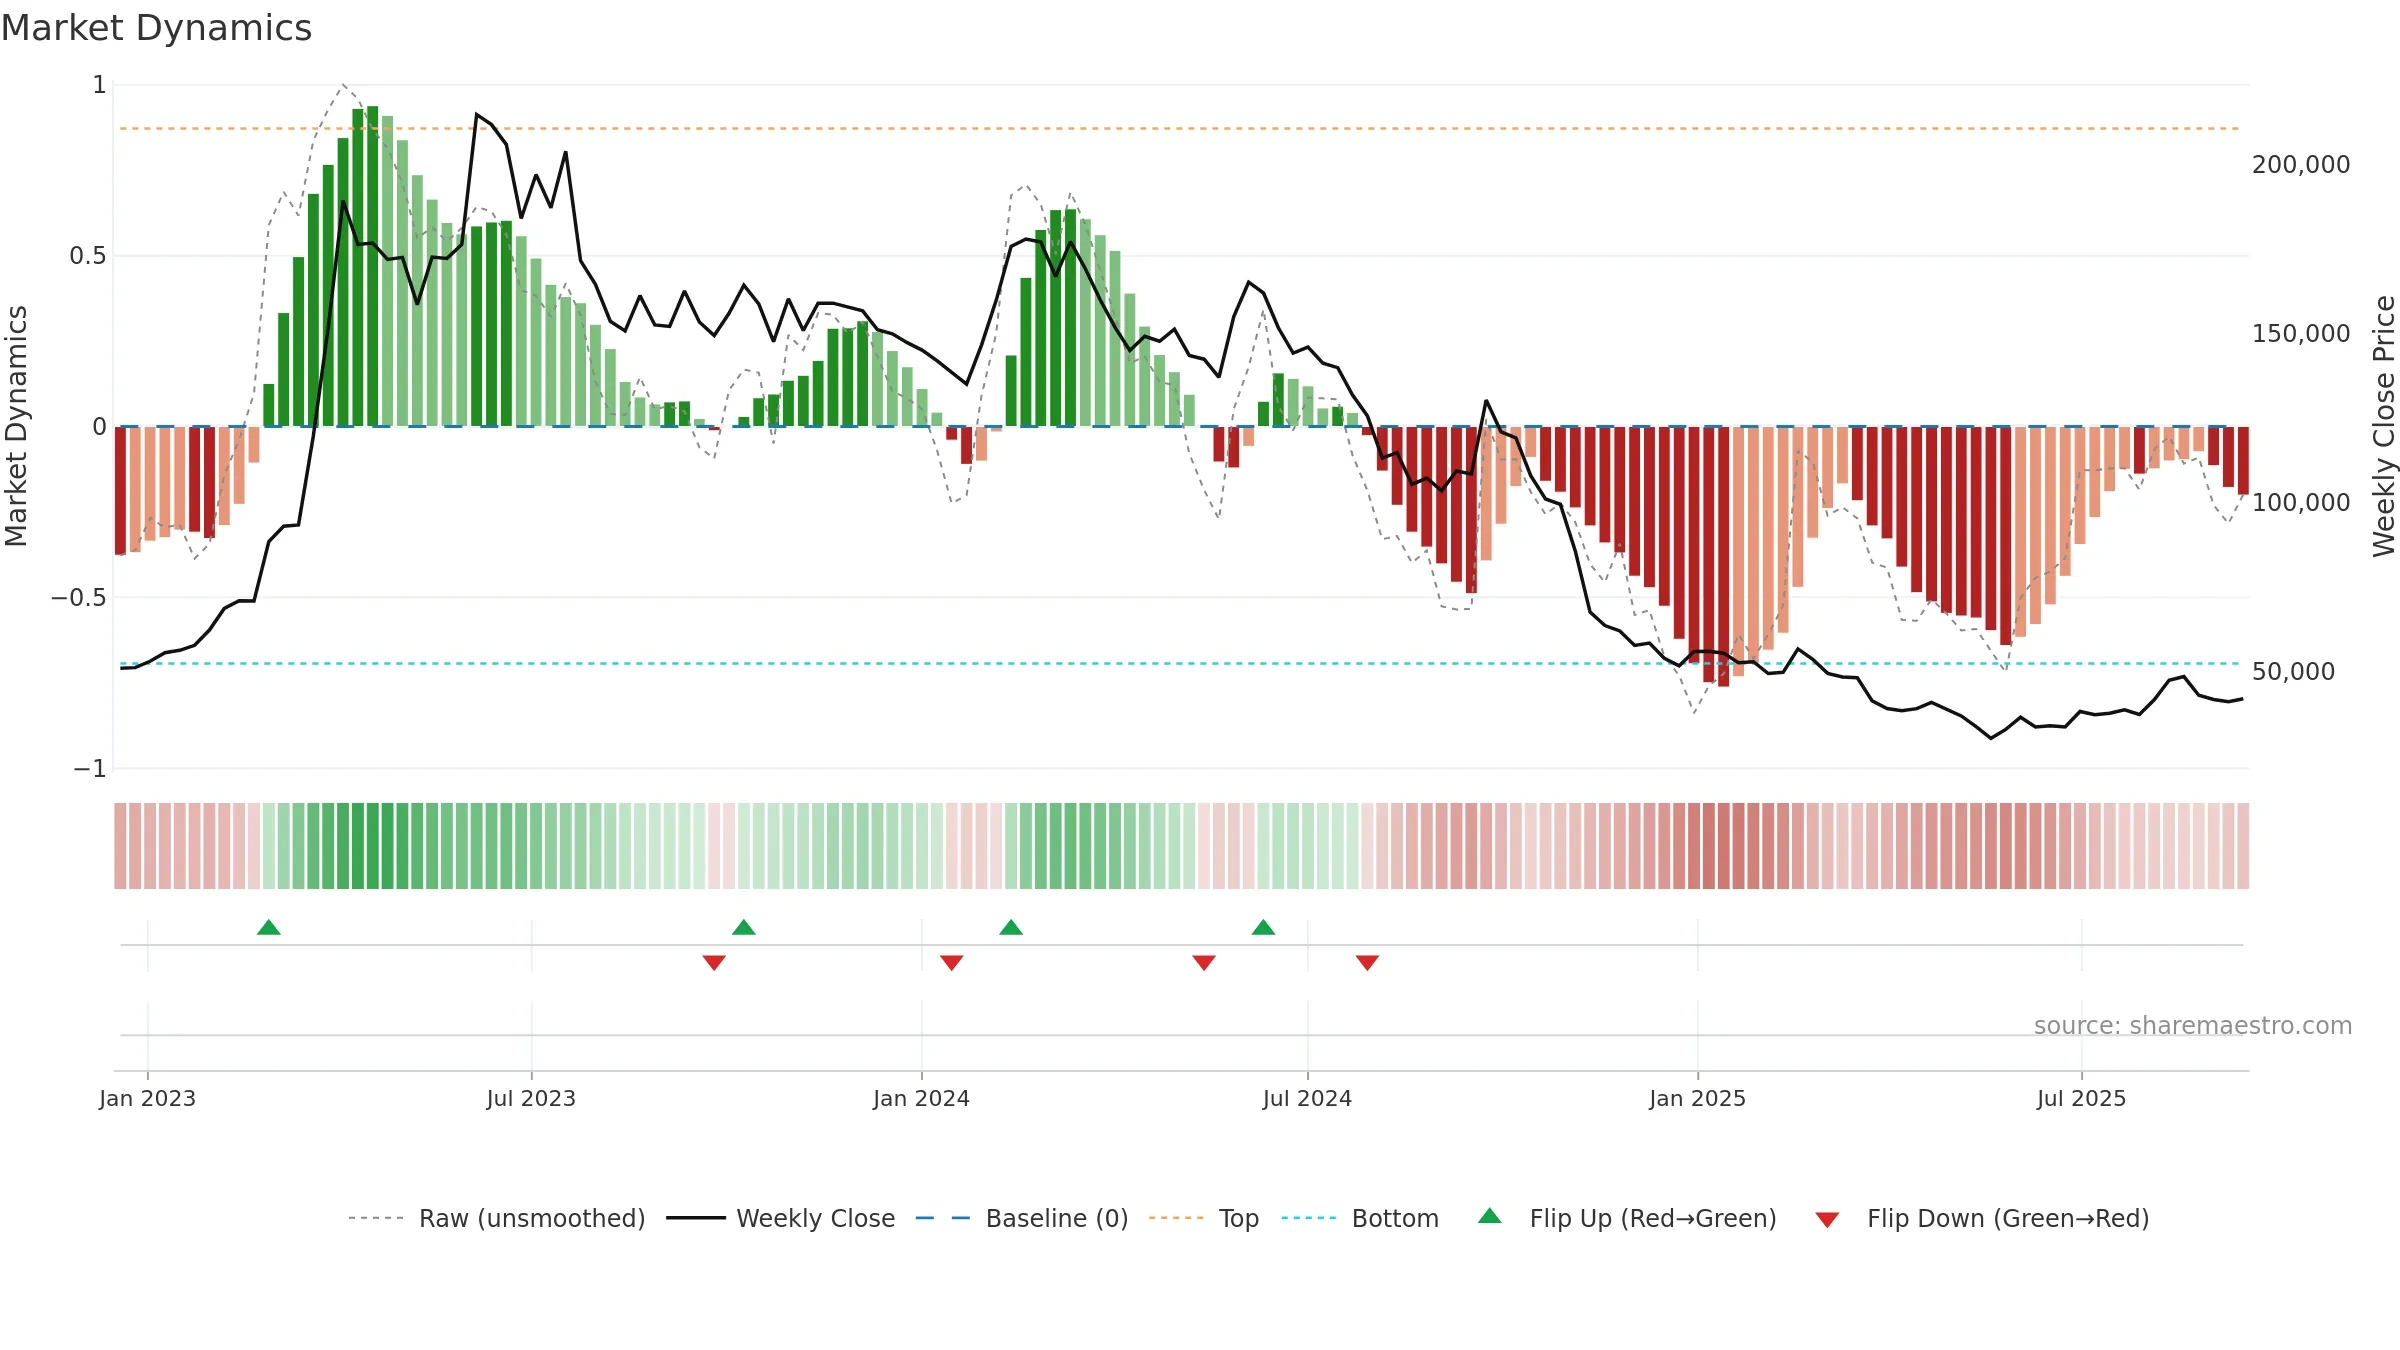
How to read this — Bearish backdrop but short-term momentum is improving; confirmation still needed.
Early improvement — look for a reclaim of 0.50→0.60 to validate.
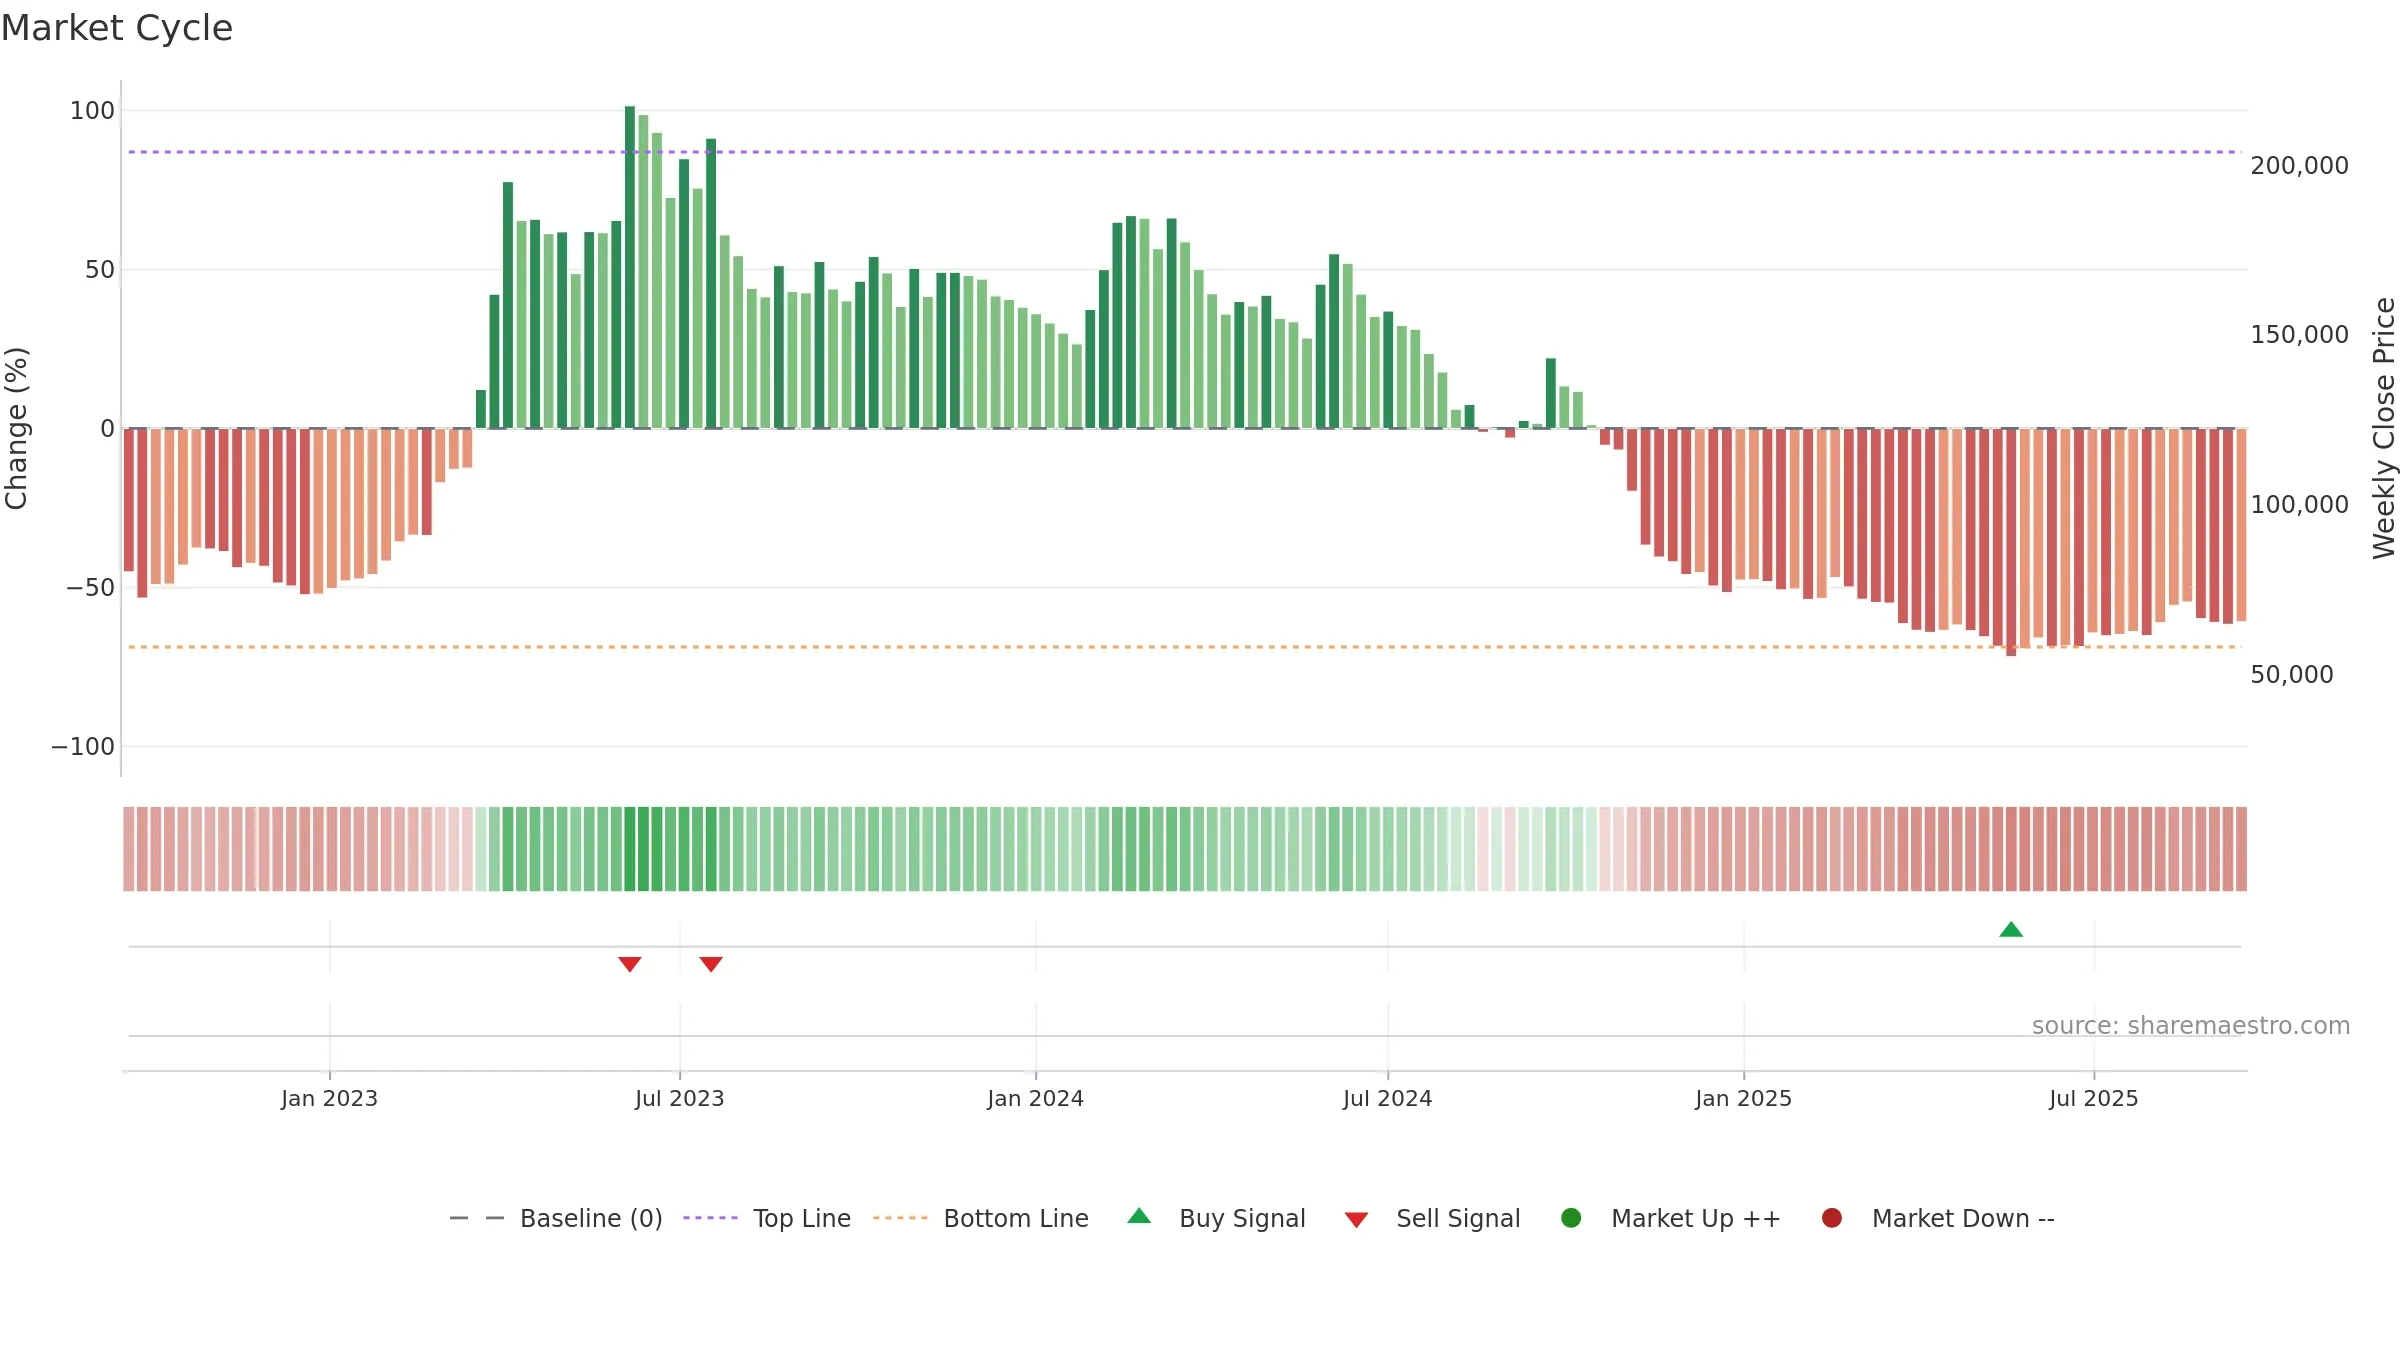
Conclusion
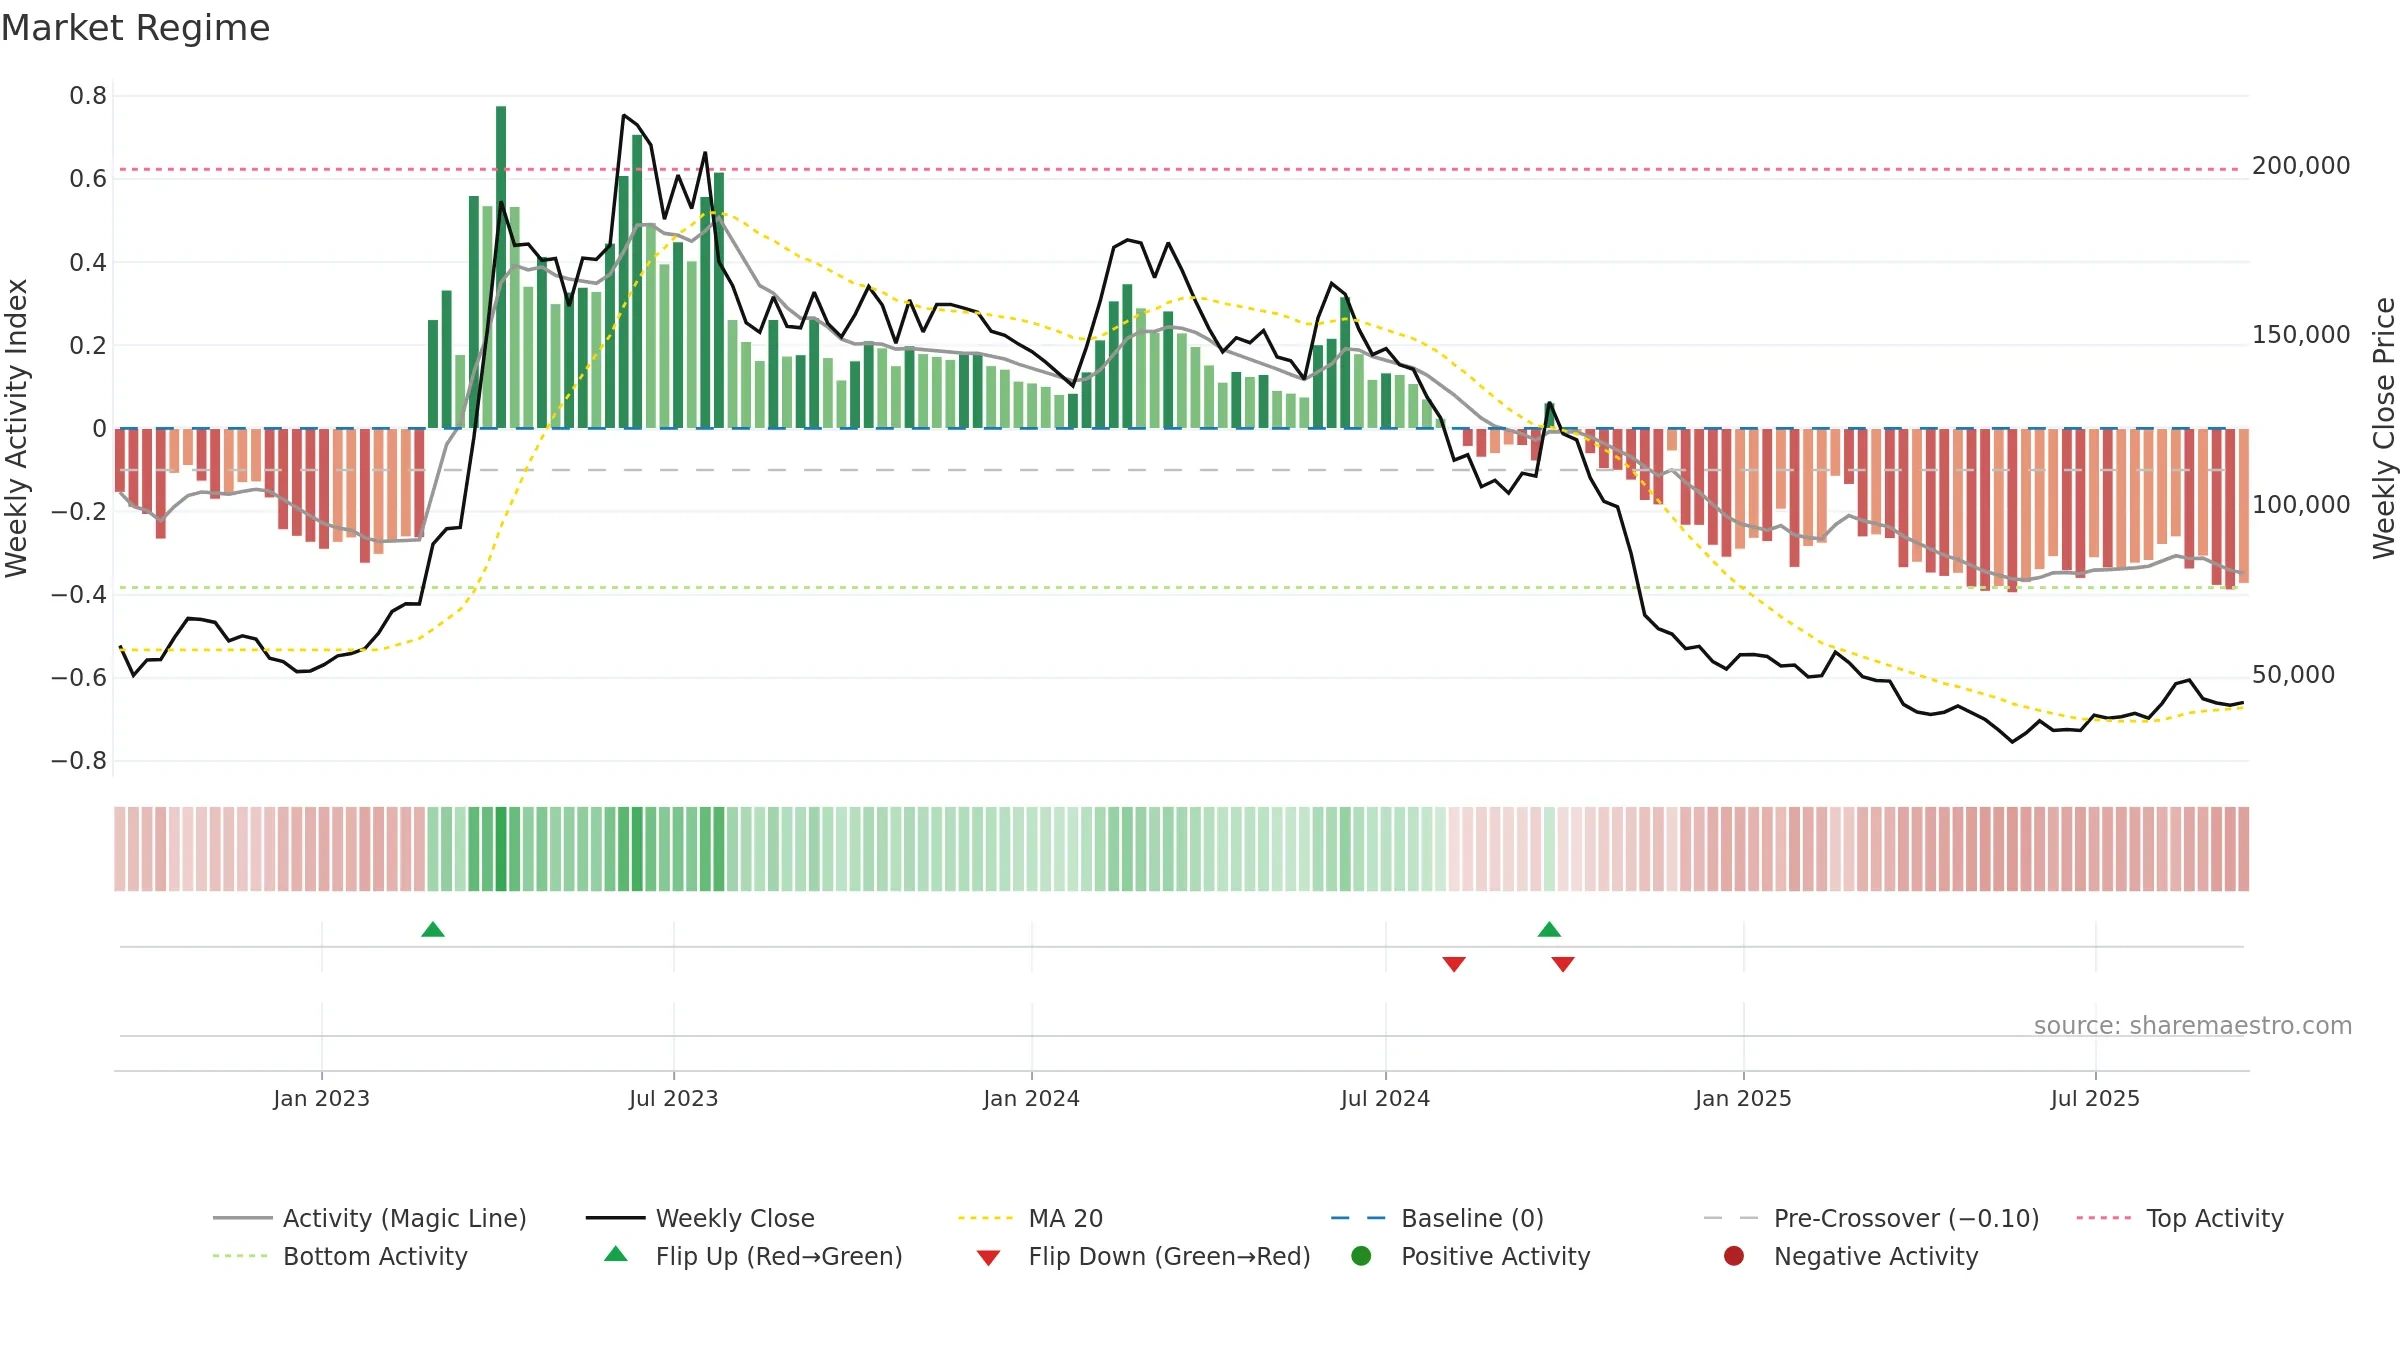
Negative setup. ★★☆☆☆ confidence. Price window: 12. Trend: Bottoming Attempt; gauge 33. In combination, liquidity diverges from price.
- Early improvement from bearish zone (bottoming attempt)
- Solid multi-week performance
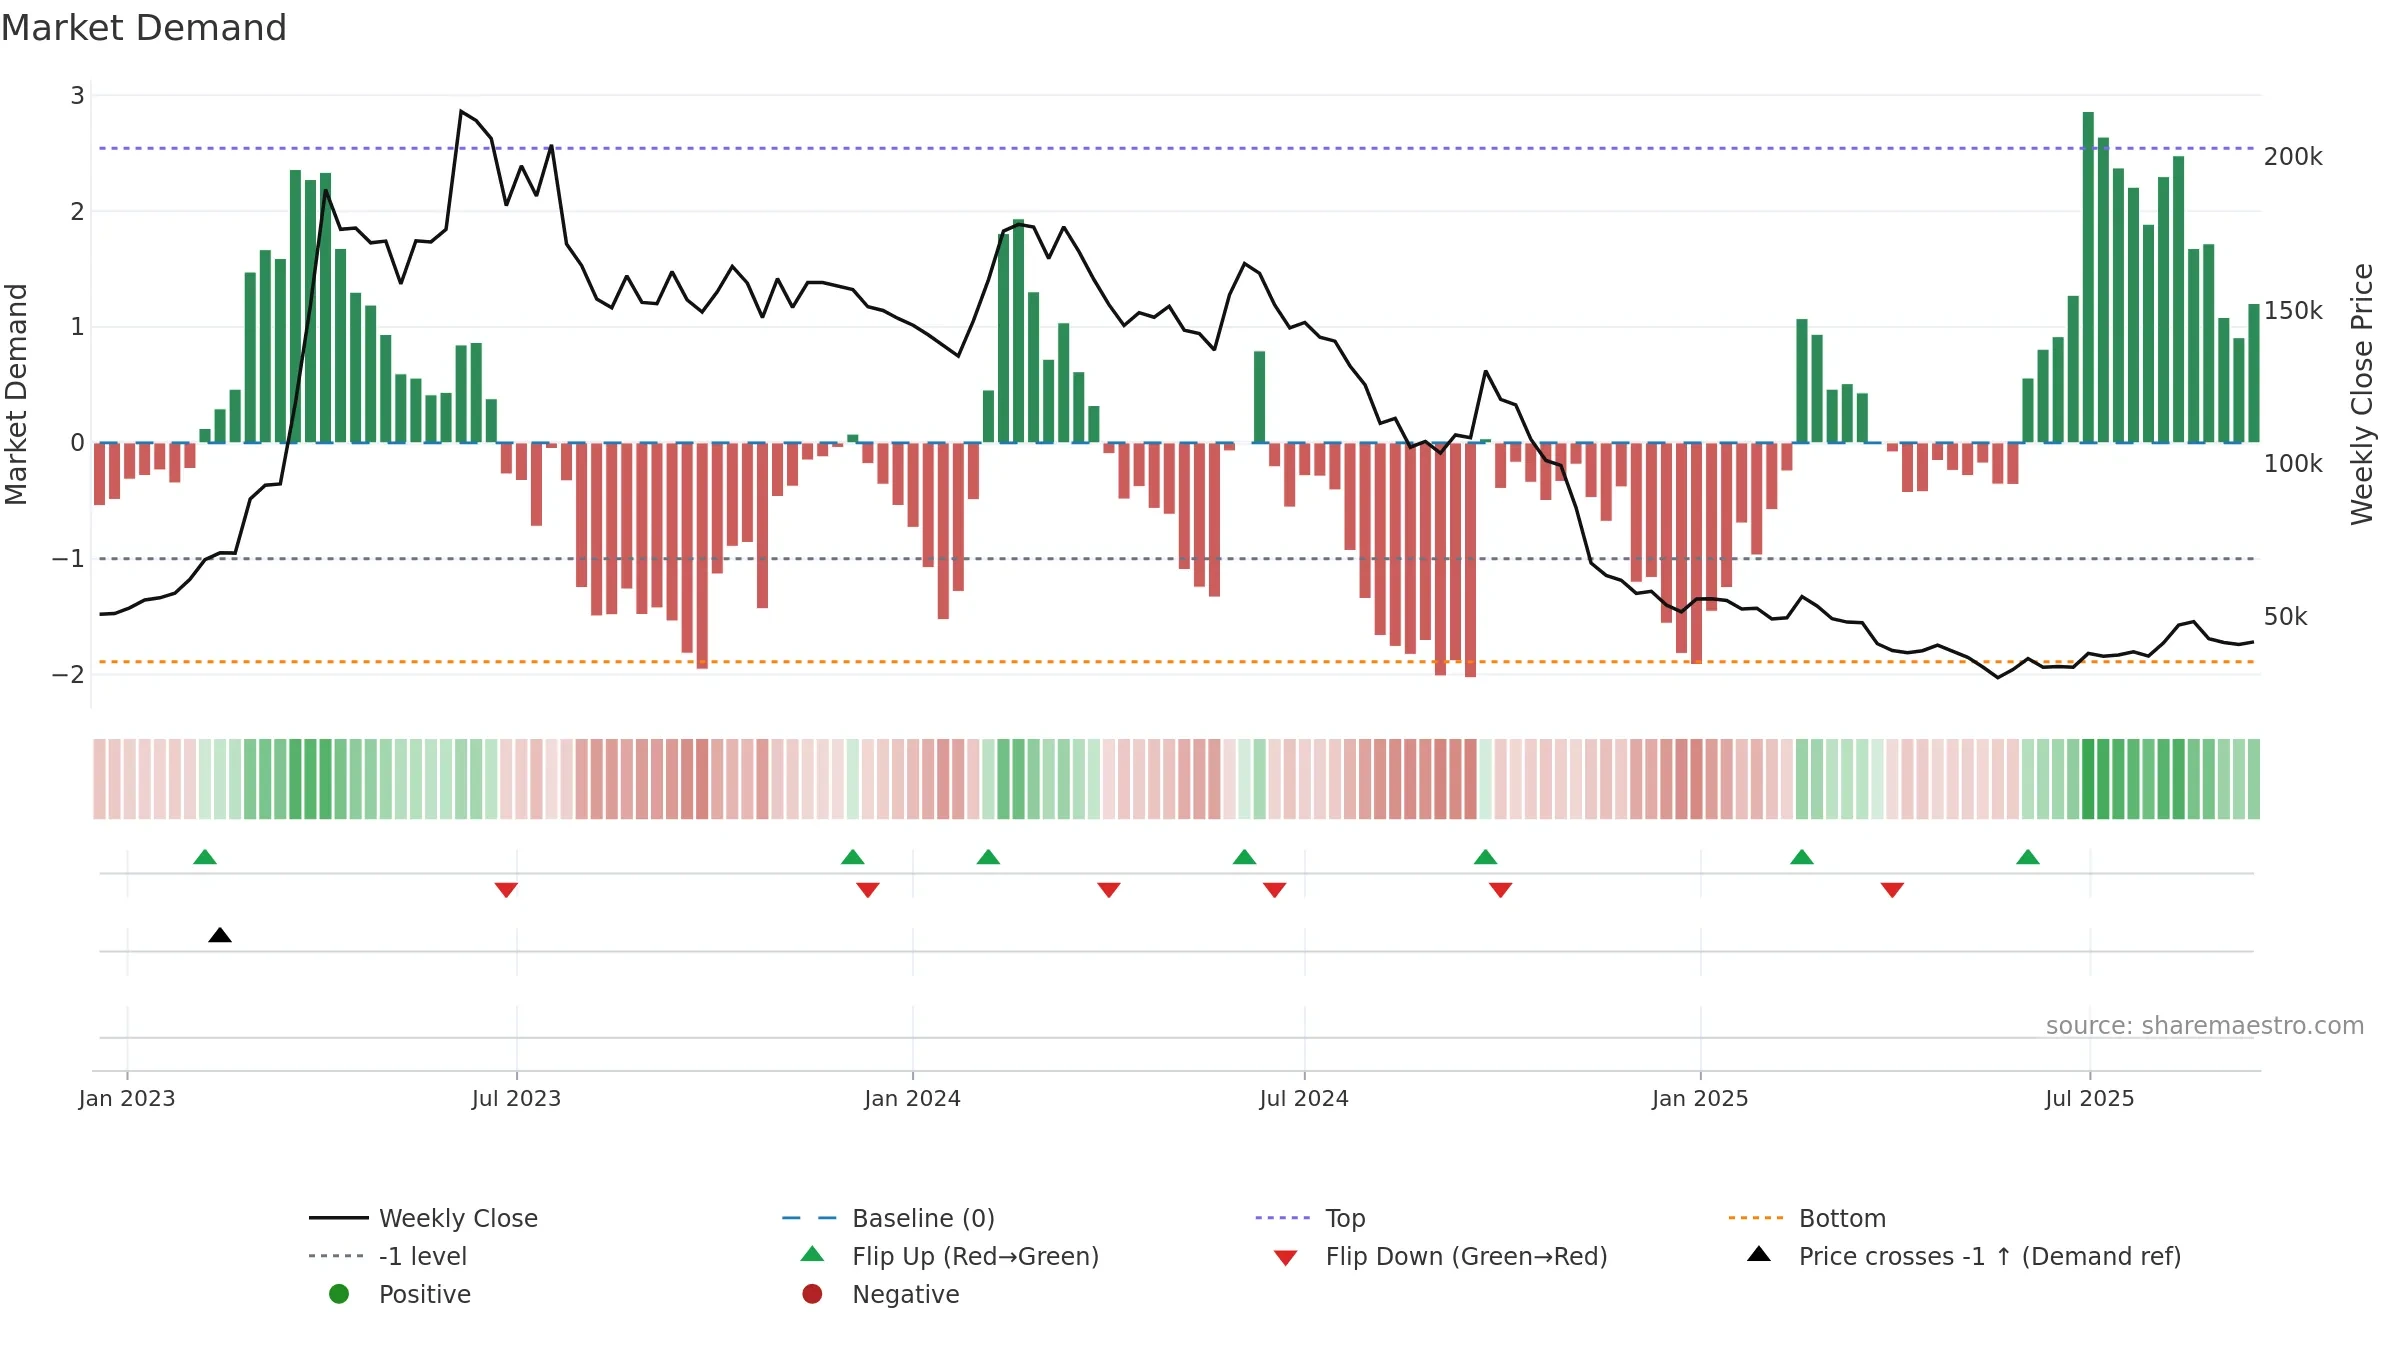
- Buyers step in at depressed levels (accumulation)
- Price is not above key averages
- Liquidity diverges from price
- High return volatility raises whipsaw risk
Why: Price window 12.52% over 8w. Close is -13.64% below the prior-window high. Return volatility 6.95%. Volume trend falling. Liquidity divergence with price. Trend state bottoming attempt. Low-regime (≤0.25) upticks 4/6 (67.0%) • Accumulating. 4–8w crossover bearish. Momentum neutral and rising.
Tip: Most metrics include a hover tooltip where they appear in the report.