Fujian Torch Electron Technology Co., Ltd.
603678 SHA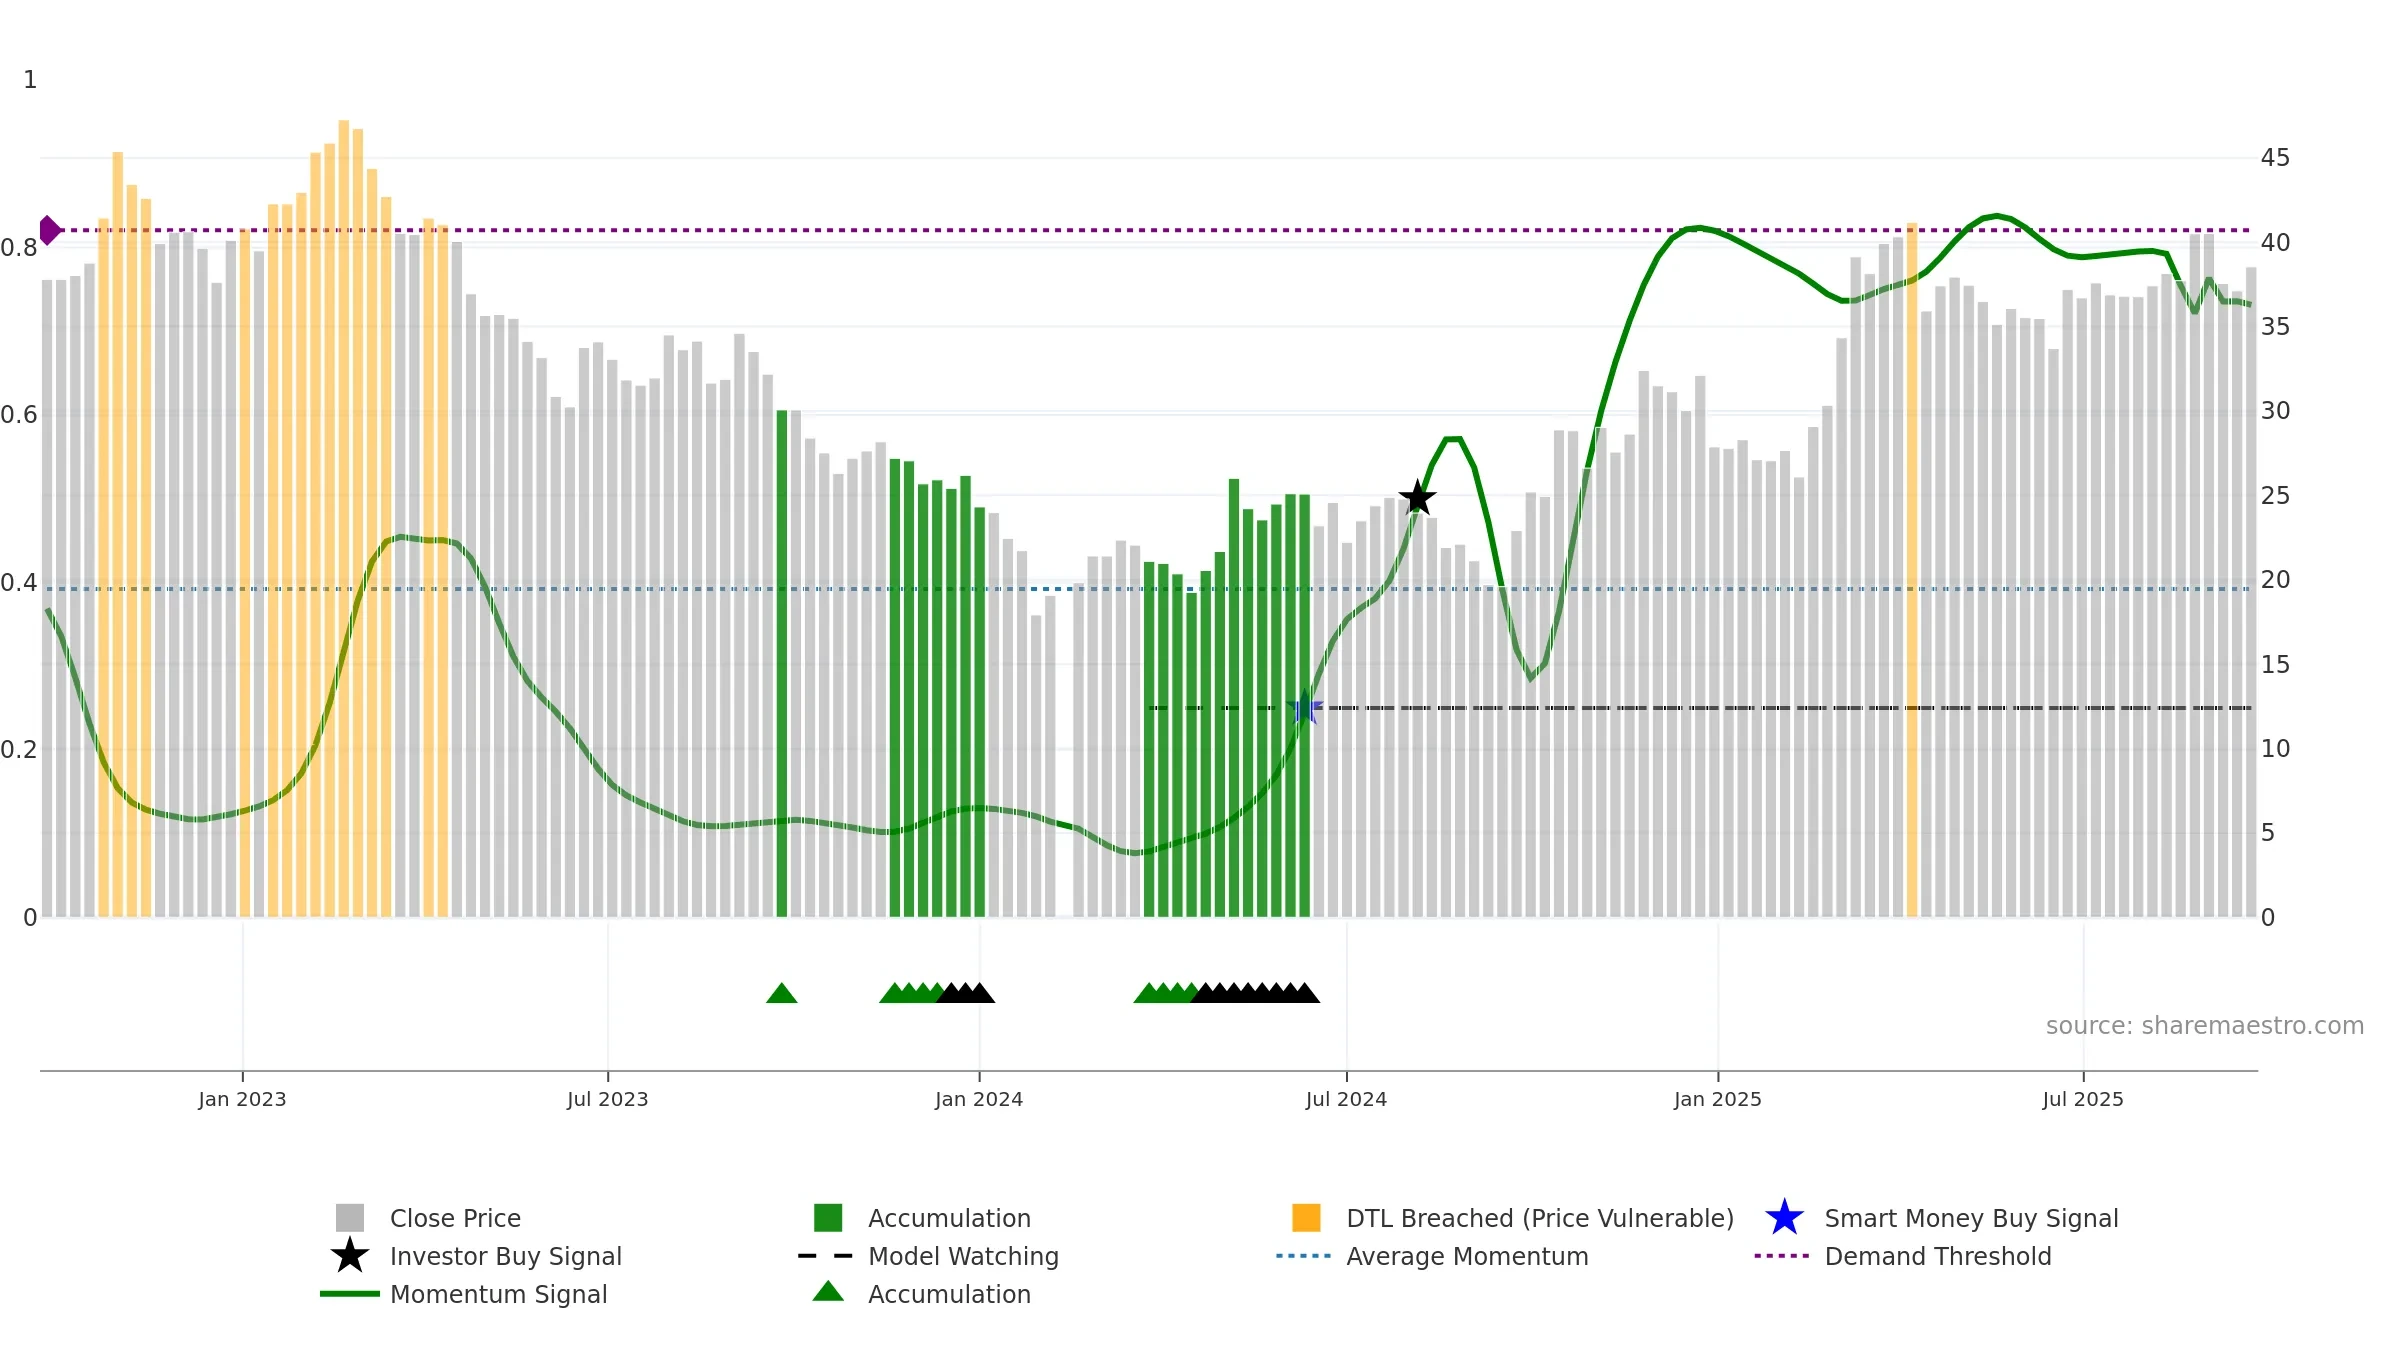
Weekly Summary
Fujian Torch Electron Technology Co., Ltd. closed at 38.5400 (-1.31% WoW) . Data window ends Mon, 22 Sep 2025.
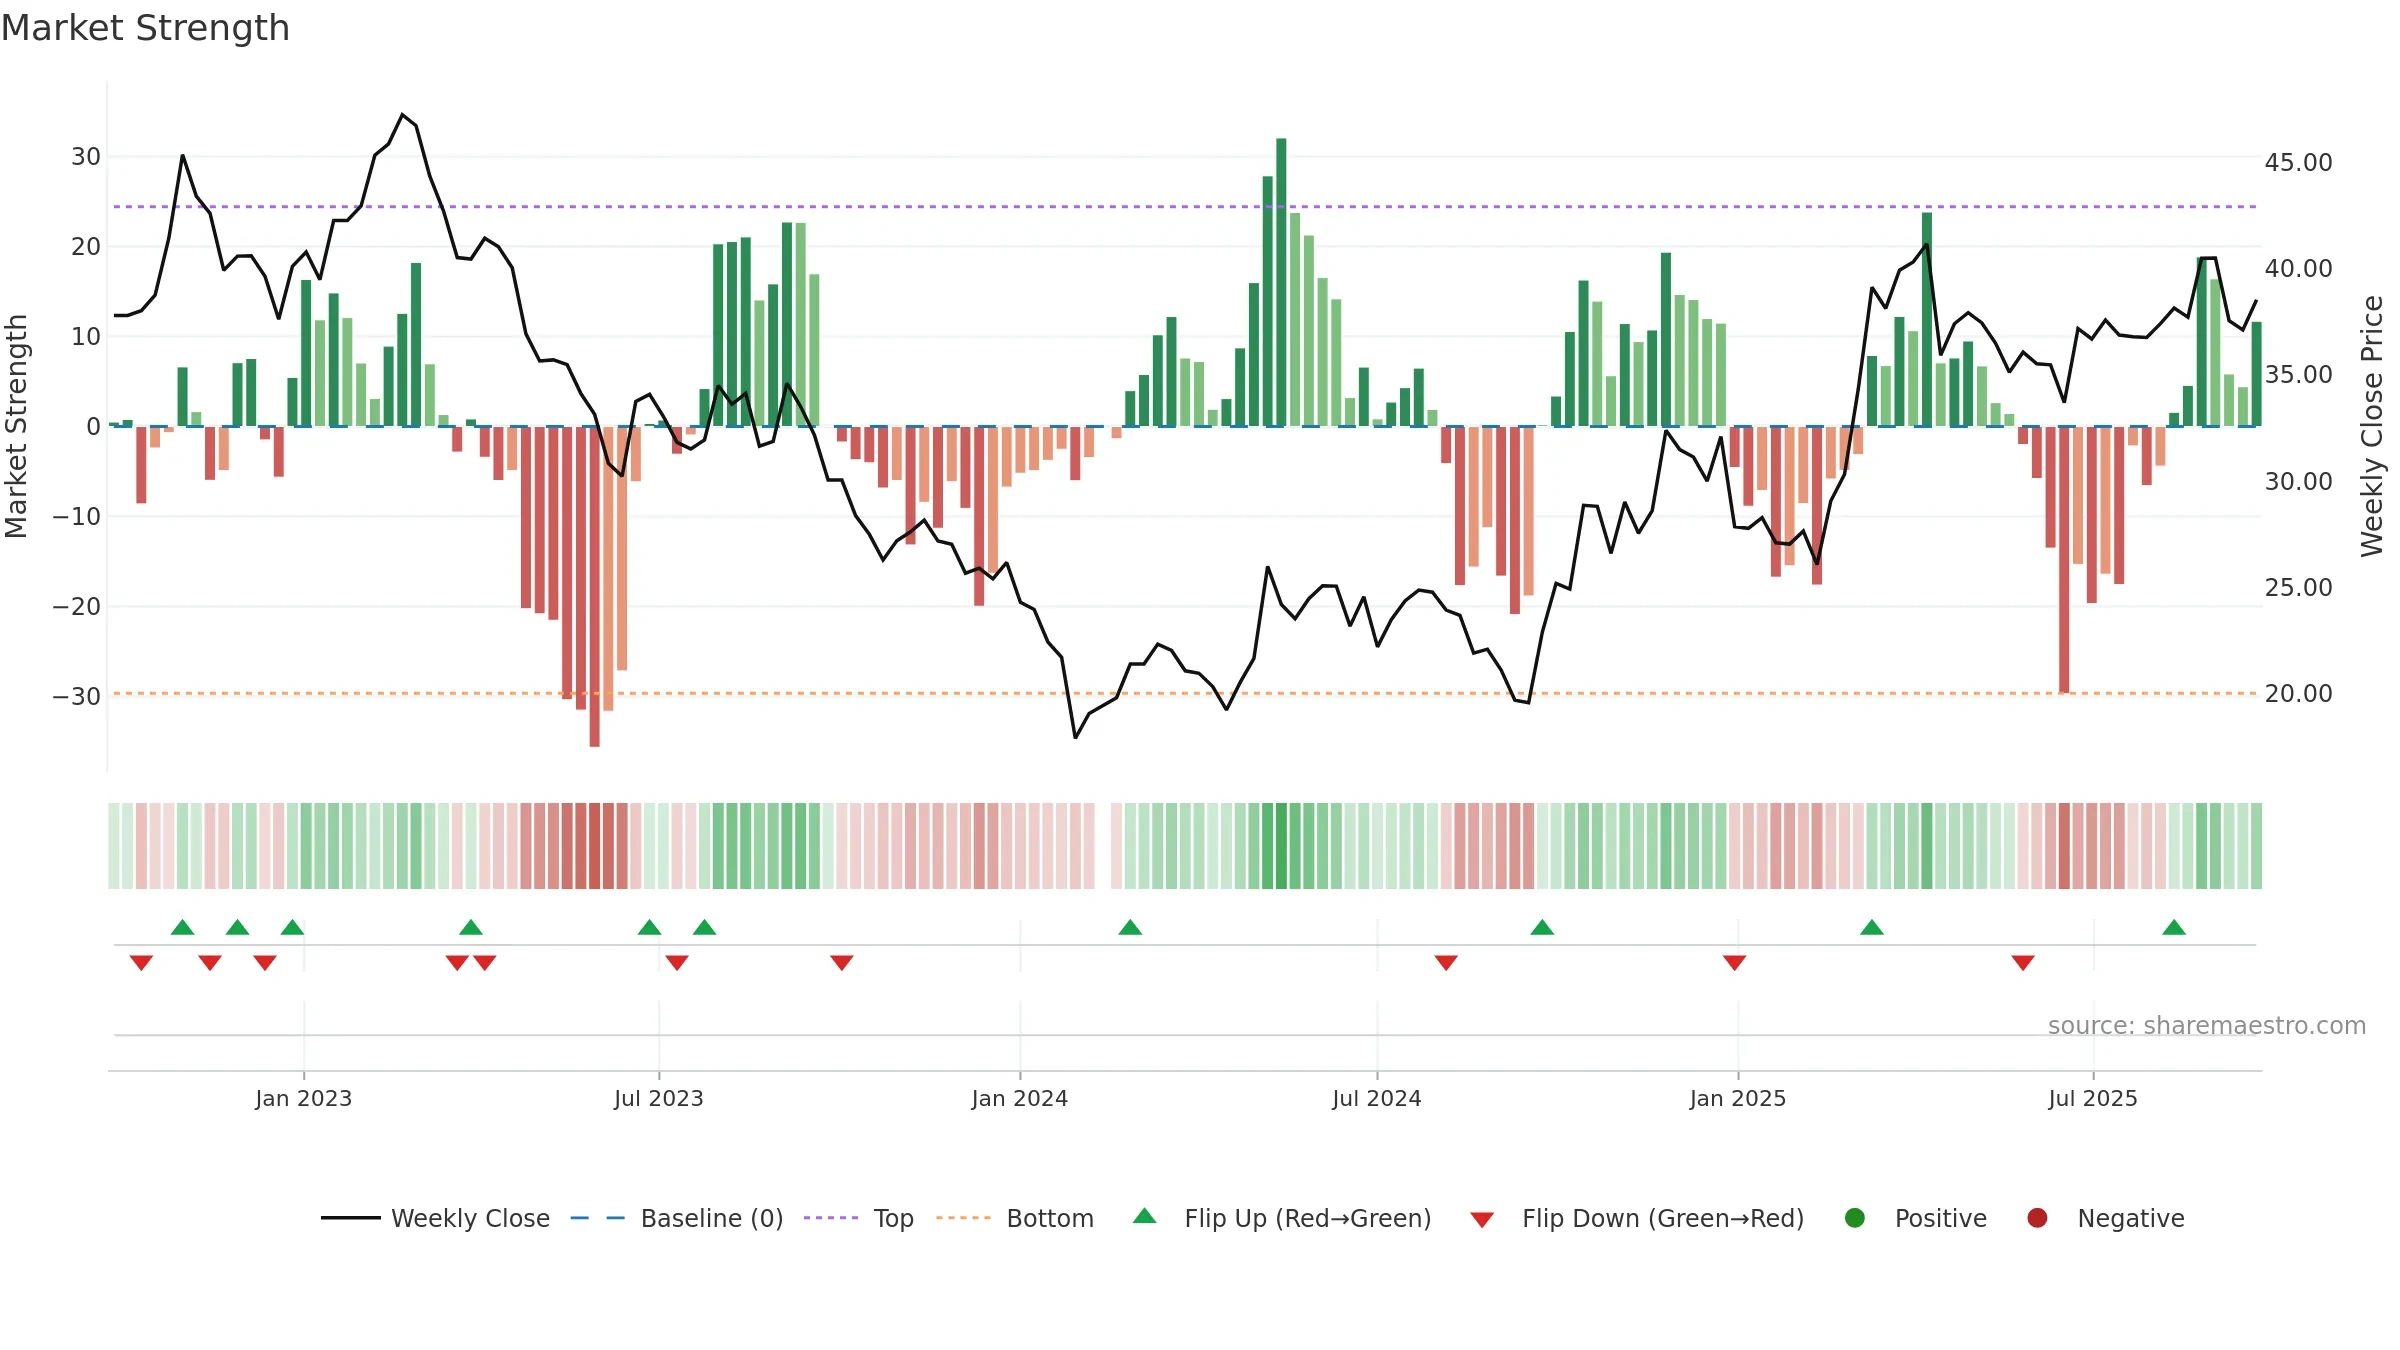
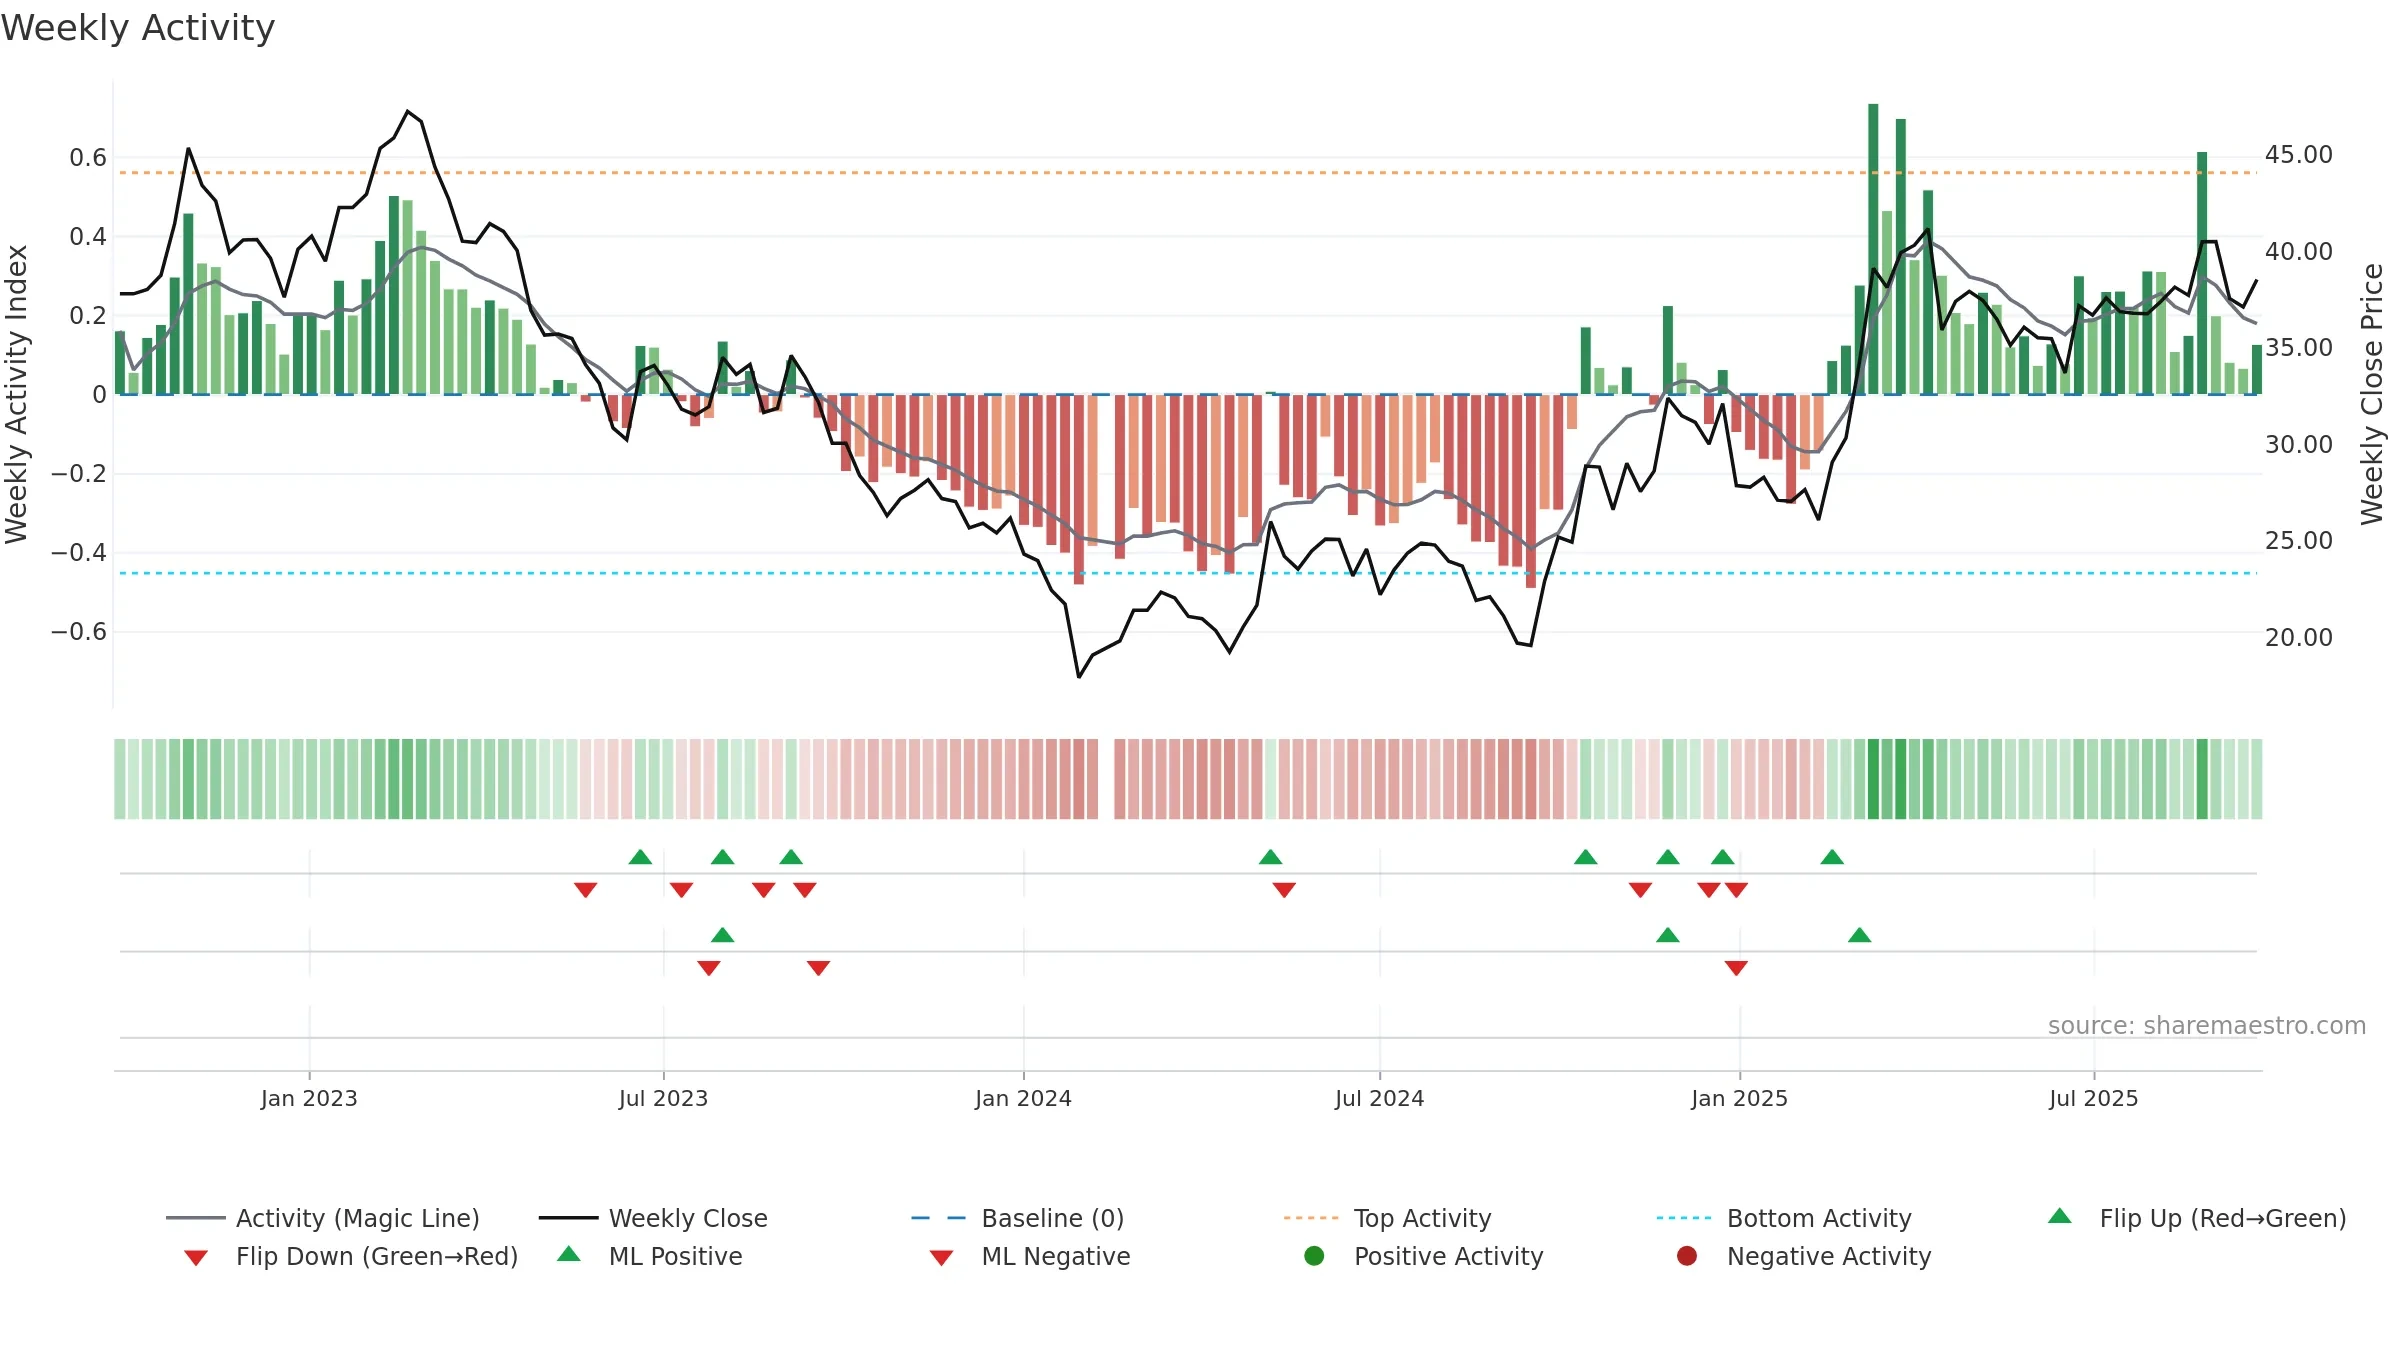
How to read this — Price slope is upward, indicating persistent buying over the window. Low weekly volatility favours steadier follow-through. Volume trend diverges from price — watch for fatigue or rotation. Fresh short-term downside crossover weakens near-term tone. Price holds above key averages, indicating constructive participation.
Up-slope supports buying interest; pullbacks may be contained if activity stays firm. Because liquidity isn’t confirming, prefer evidence of fresh demand before chasing moves.
Gauge maps the trend signal to a 0–100 scale.
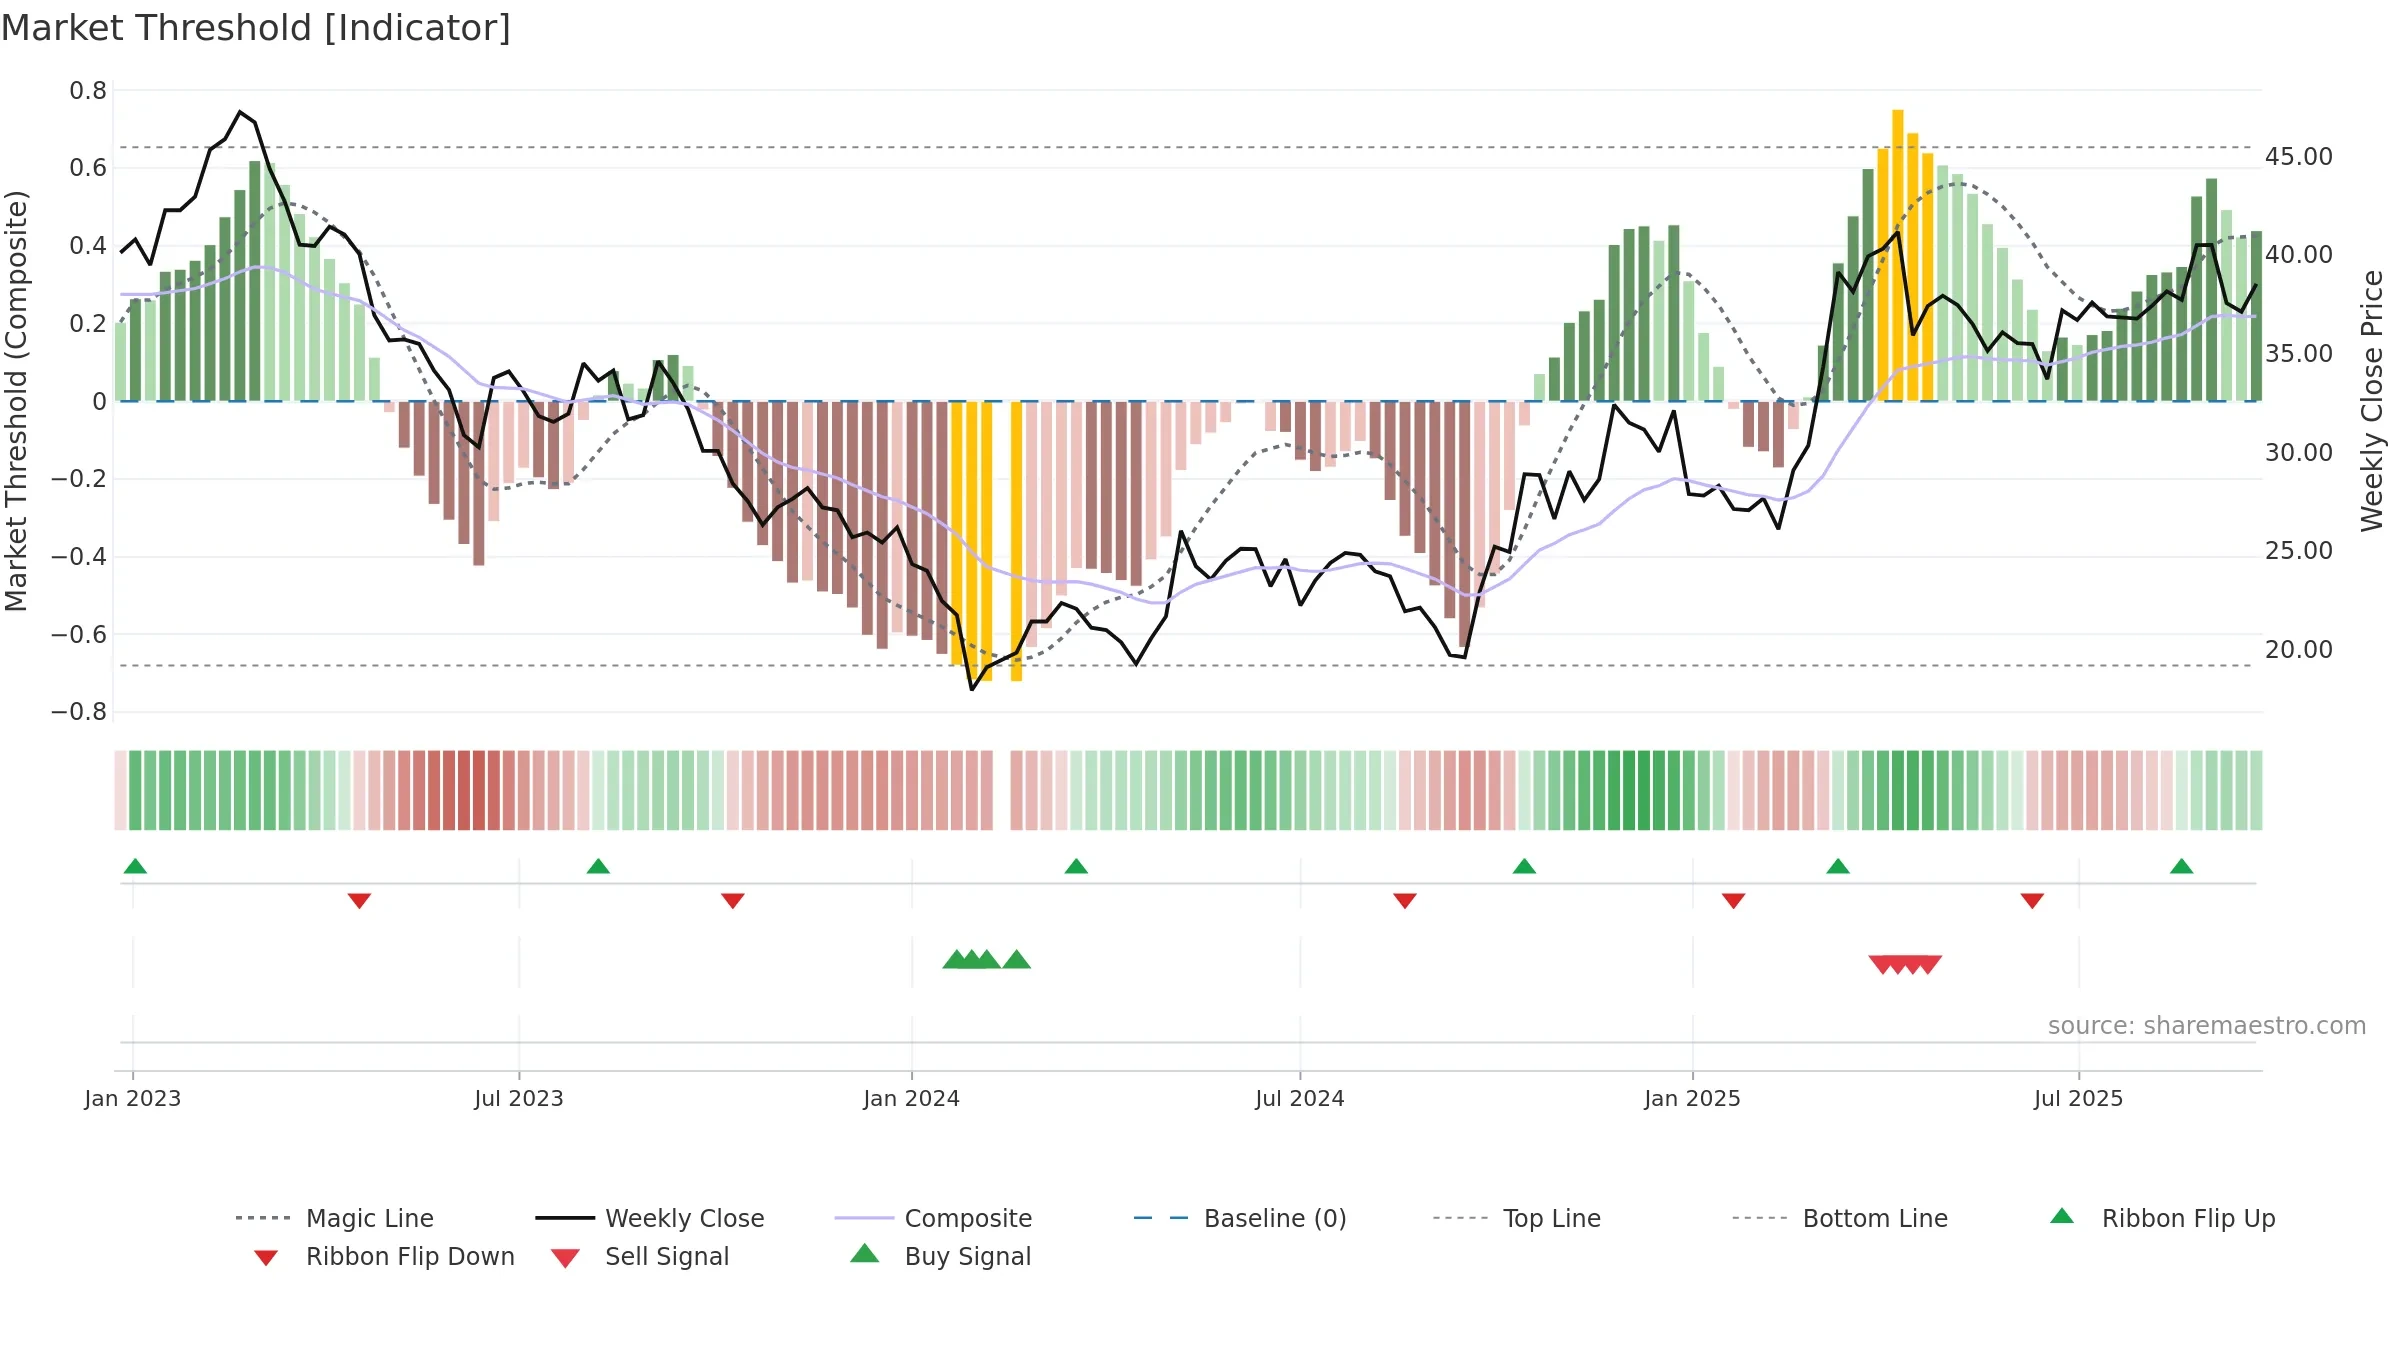
How to read this — Gauge is elevated but momentum is rolling over; topping risk is rising.
Stay alert: protect gains or seek confirmation before adding risk.

Relative strength is Negative
(< 0%, underperforming).
Latest MRS: -7.93% (week ending Fri, 19 Sep 2025).
Slope: Falling over 8w.
Notes:
- Below zero line indicates relative weakness vs benchmark.
- MRS slope falling over ~8 weeks.
Price is below fair value; potential upside if momentum constructive.
Conclusion
Negative setup. ★★☆☆☆ confidence. Trend: Uptrend at Risk · 2.99% over window · vol 1.32% · liquidity divergence · posture above · RS weak
- Price holds above 8–26 week averages
- Low return volatility supports durability
- High level but momentum rolling over (topping risk)
- Momentum is weak/falling
- Liquidity diverges from price
- Mansfield RS: weak & falling
Why: Price window 2.99% over w. Close is -4.86% below the prior-window high. Return volatility 1.32%. Volume trend falling. Liquidity divergence with price. Trend state uptrend at risk. 4–8w crossover bearish. Momentum neutral and falling. Valuation supportive skew.
Tip: Most metrics include a hover tooltip where they appear in the report.