Zhejiang HangKe Technology Incorporated Company
688006 SHA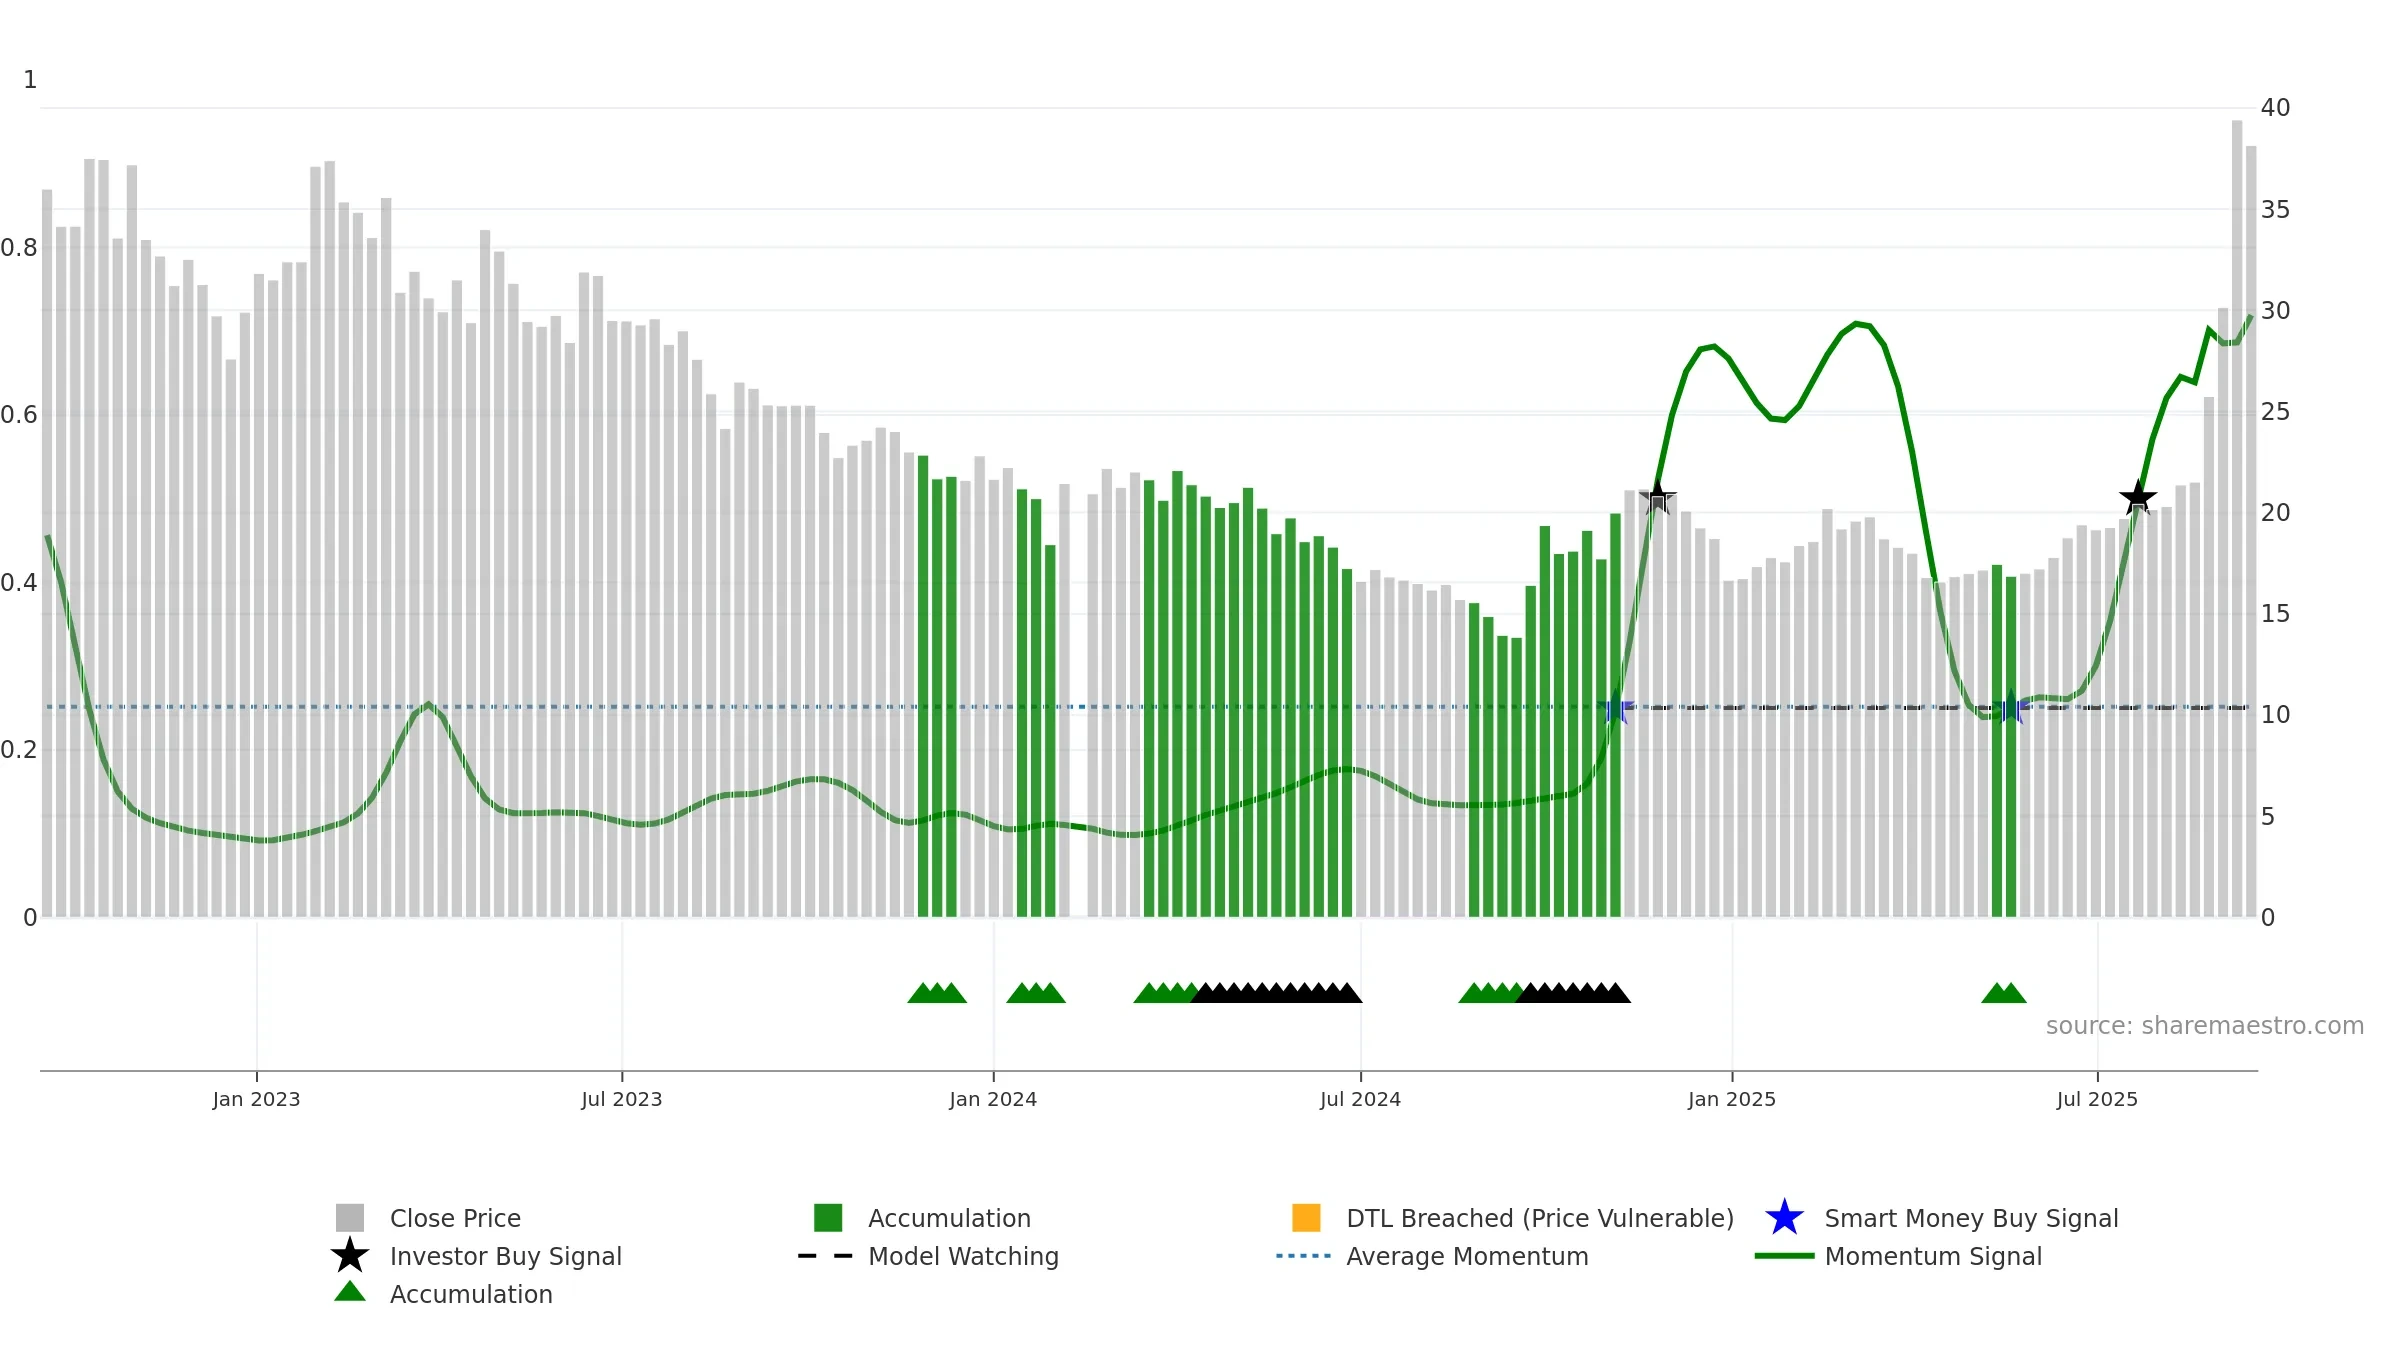
Weekly Report
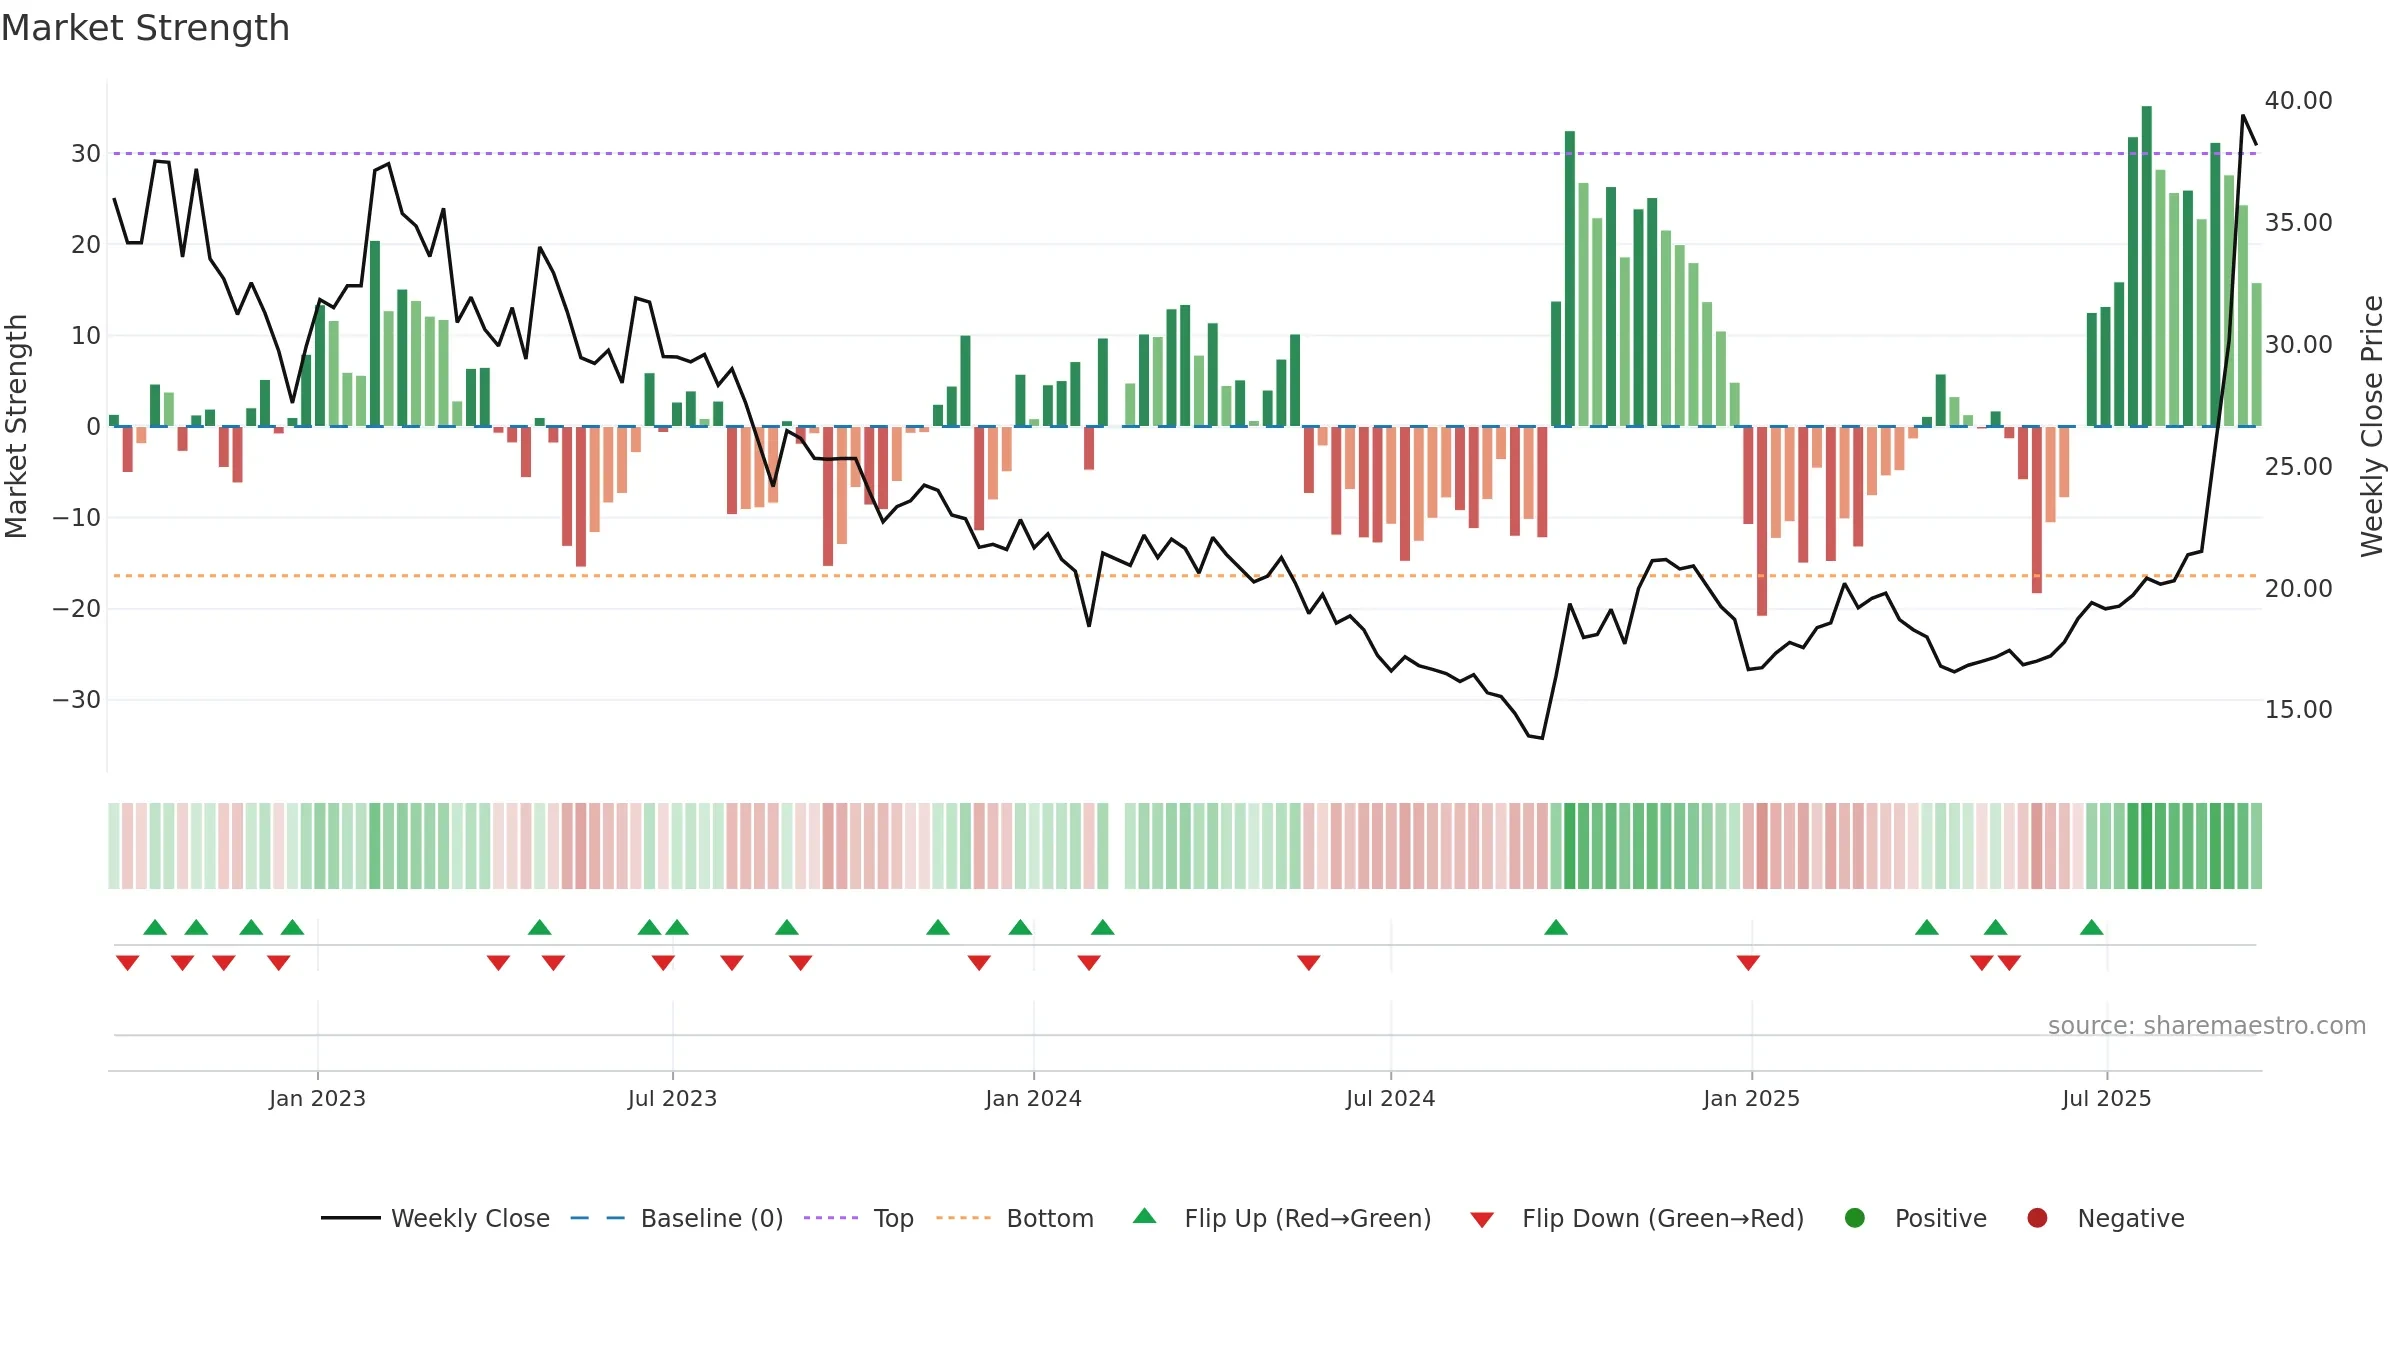
Zhejiang HangKe Technology Incorporated Company closed at 38.1500 (1.38% WoW) . Data window ends Mon, 15 Sep 2025.
How to read this — Price slope is upward, indicating persistent buying over the window. Elevated weekly volatility increases whipsaw risk. Volume and price are moving in the same direction — a constructive confirmation. Returns are positively correlated with volume — strength tends to arrive on higher activity. Constructive MA stack supports the up-drift; pullbacks may find support at the 8–13 week region. Price holds above key averages, indicating constructive participation.
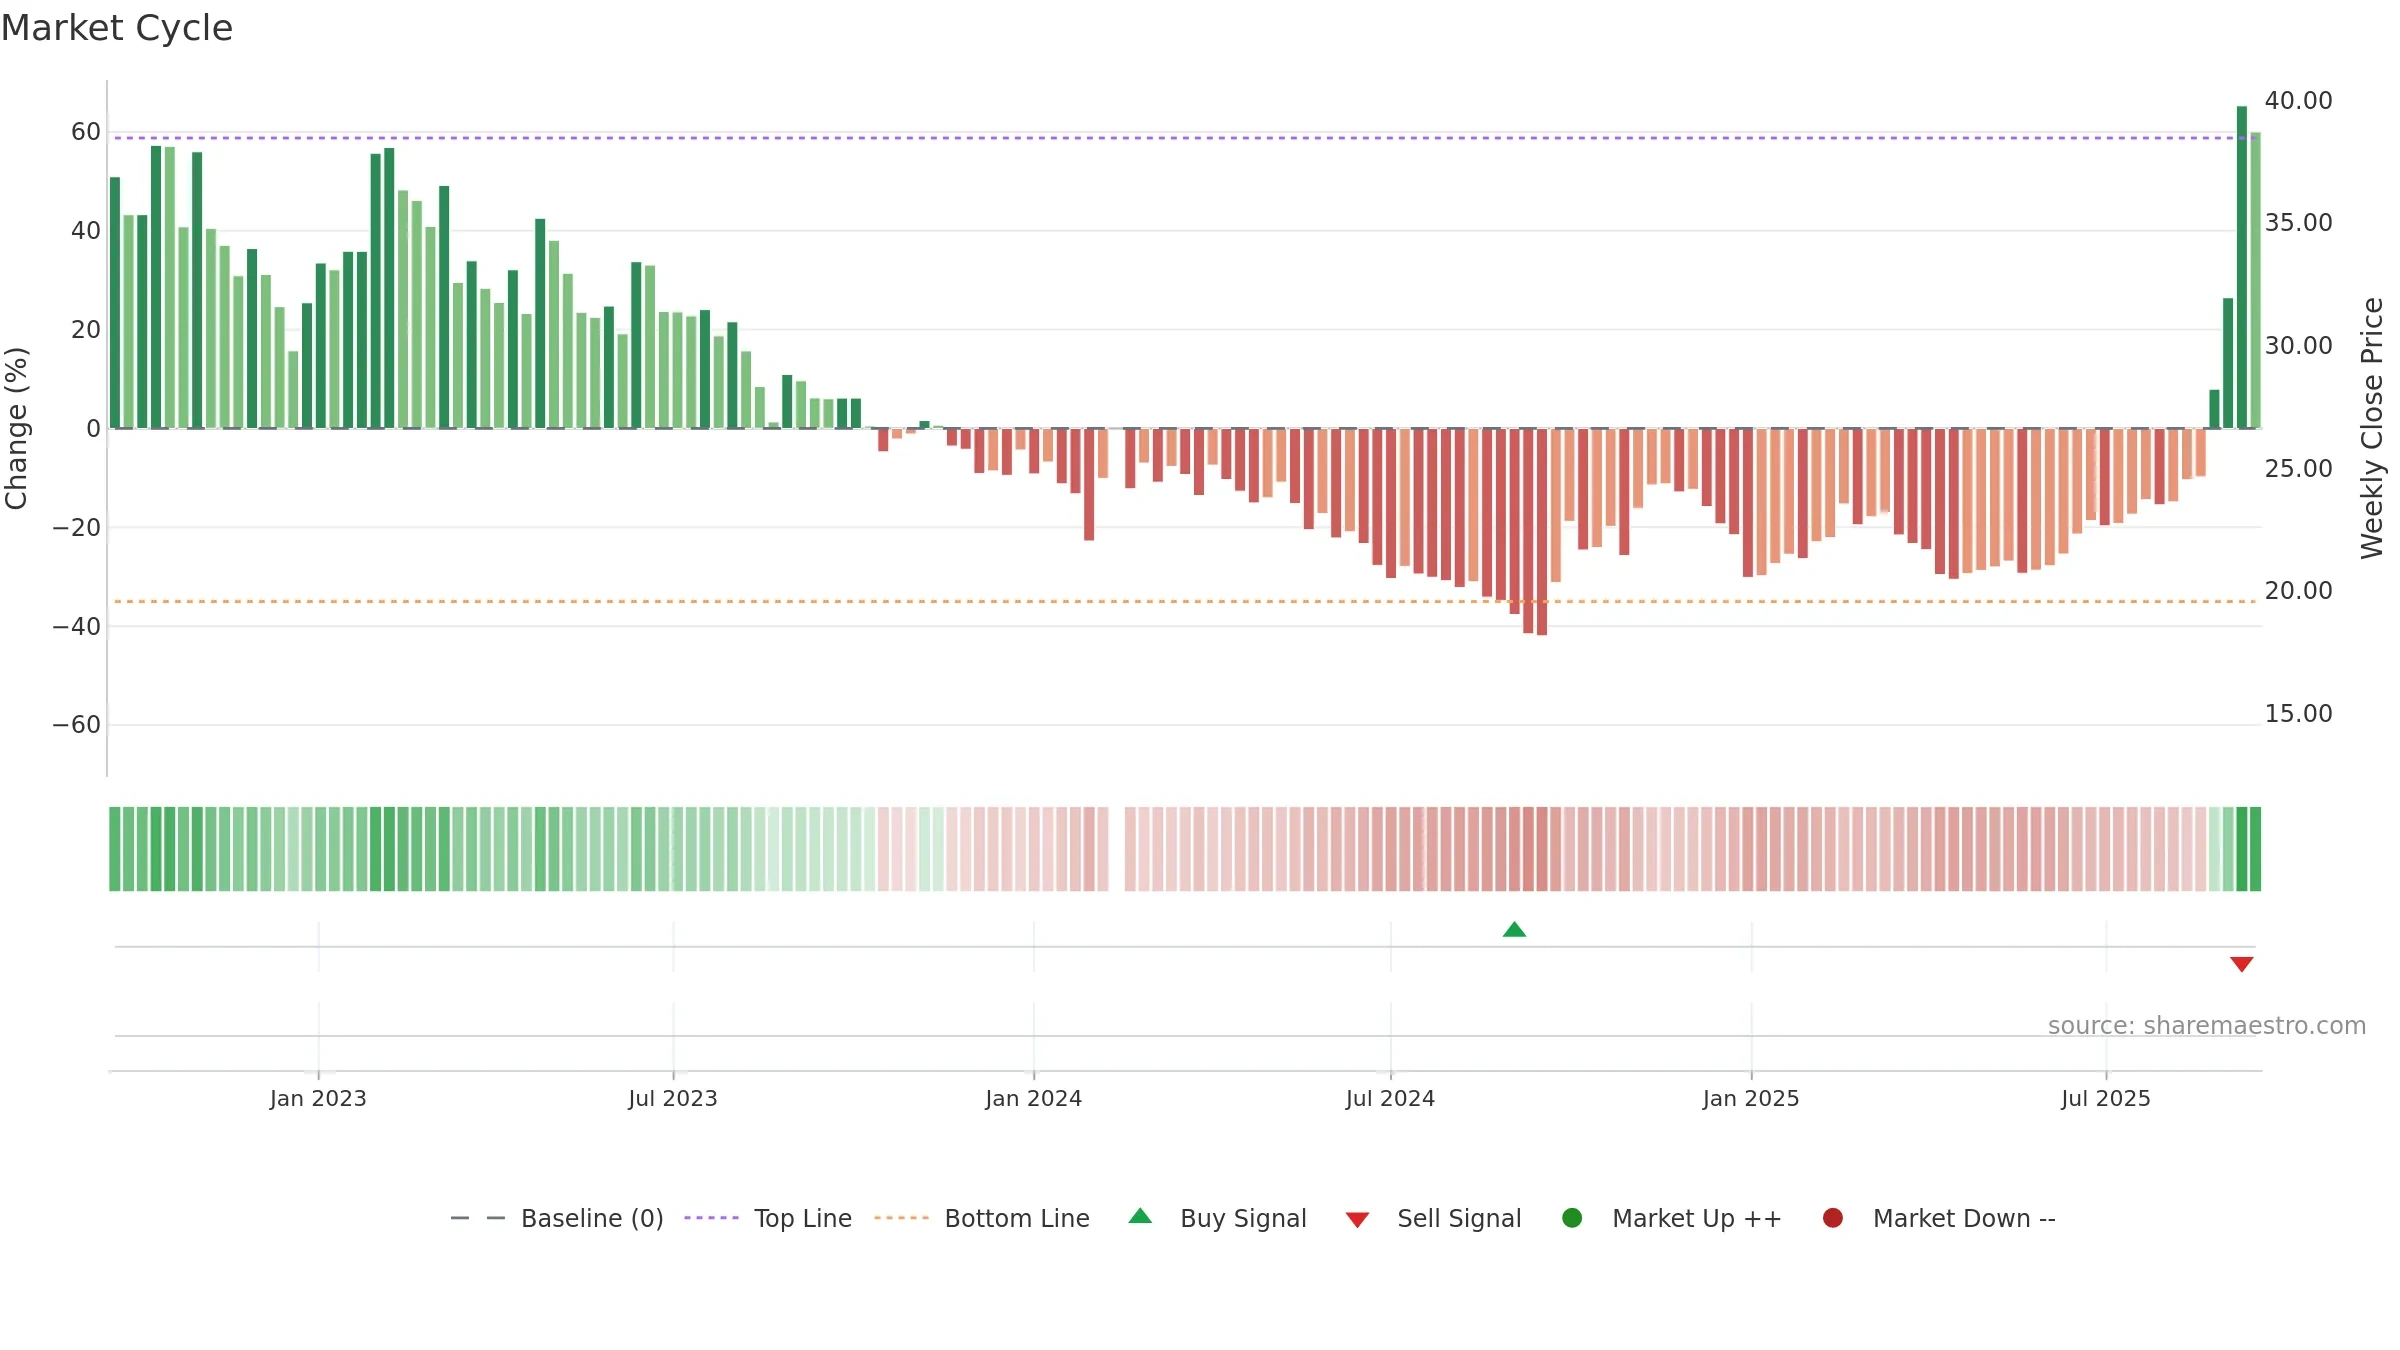
Up-slope supports buying interest; pullbacks may be contained if activity stays firm.
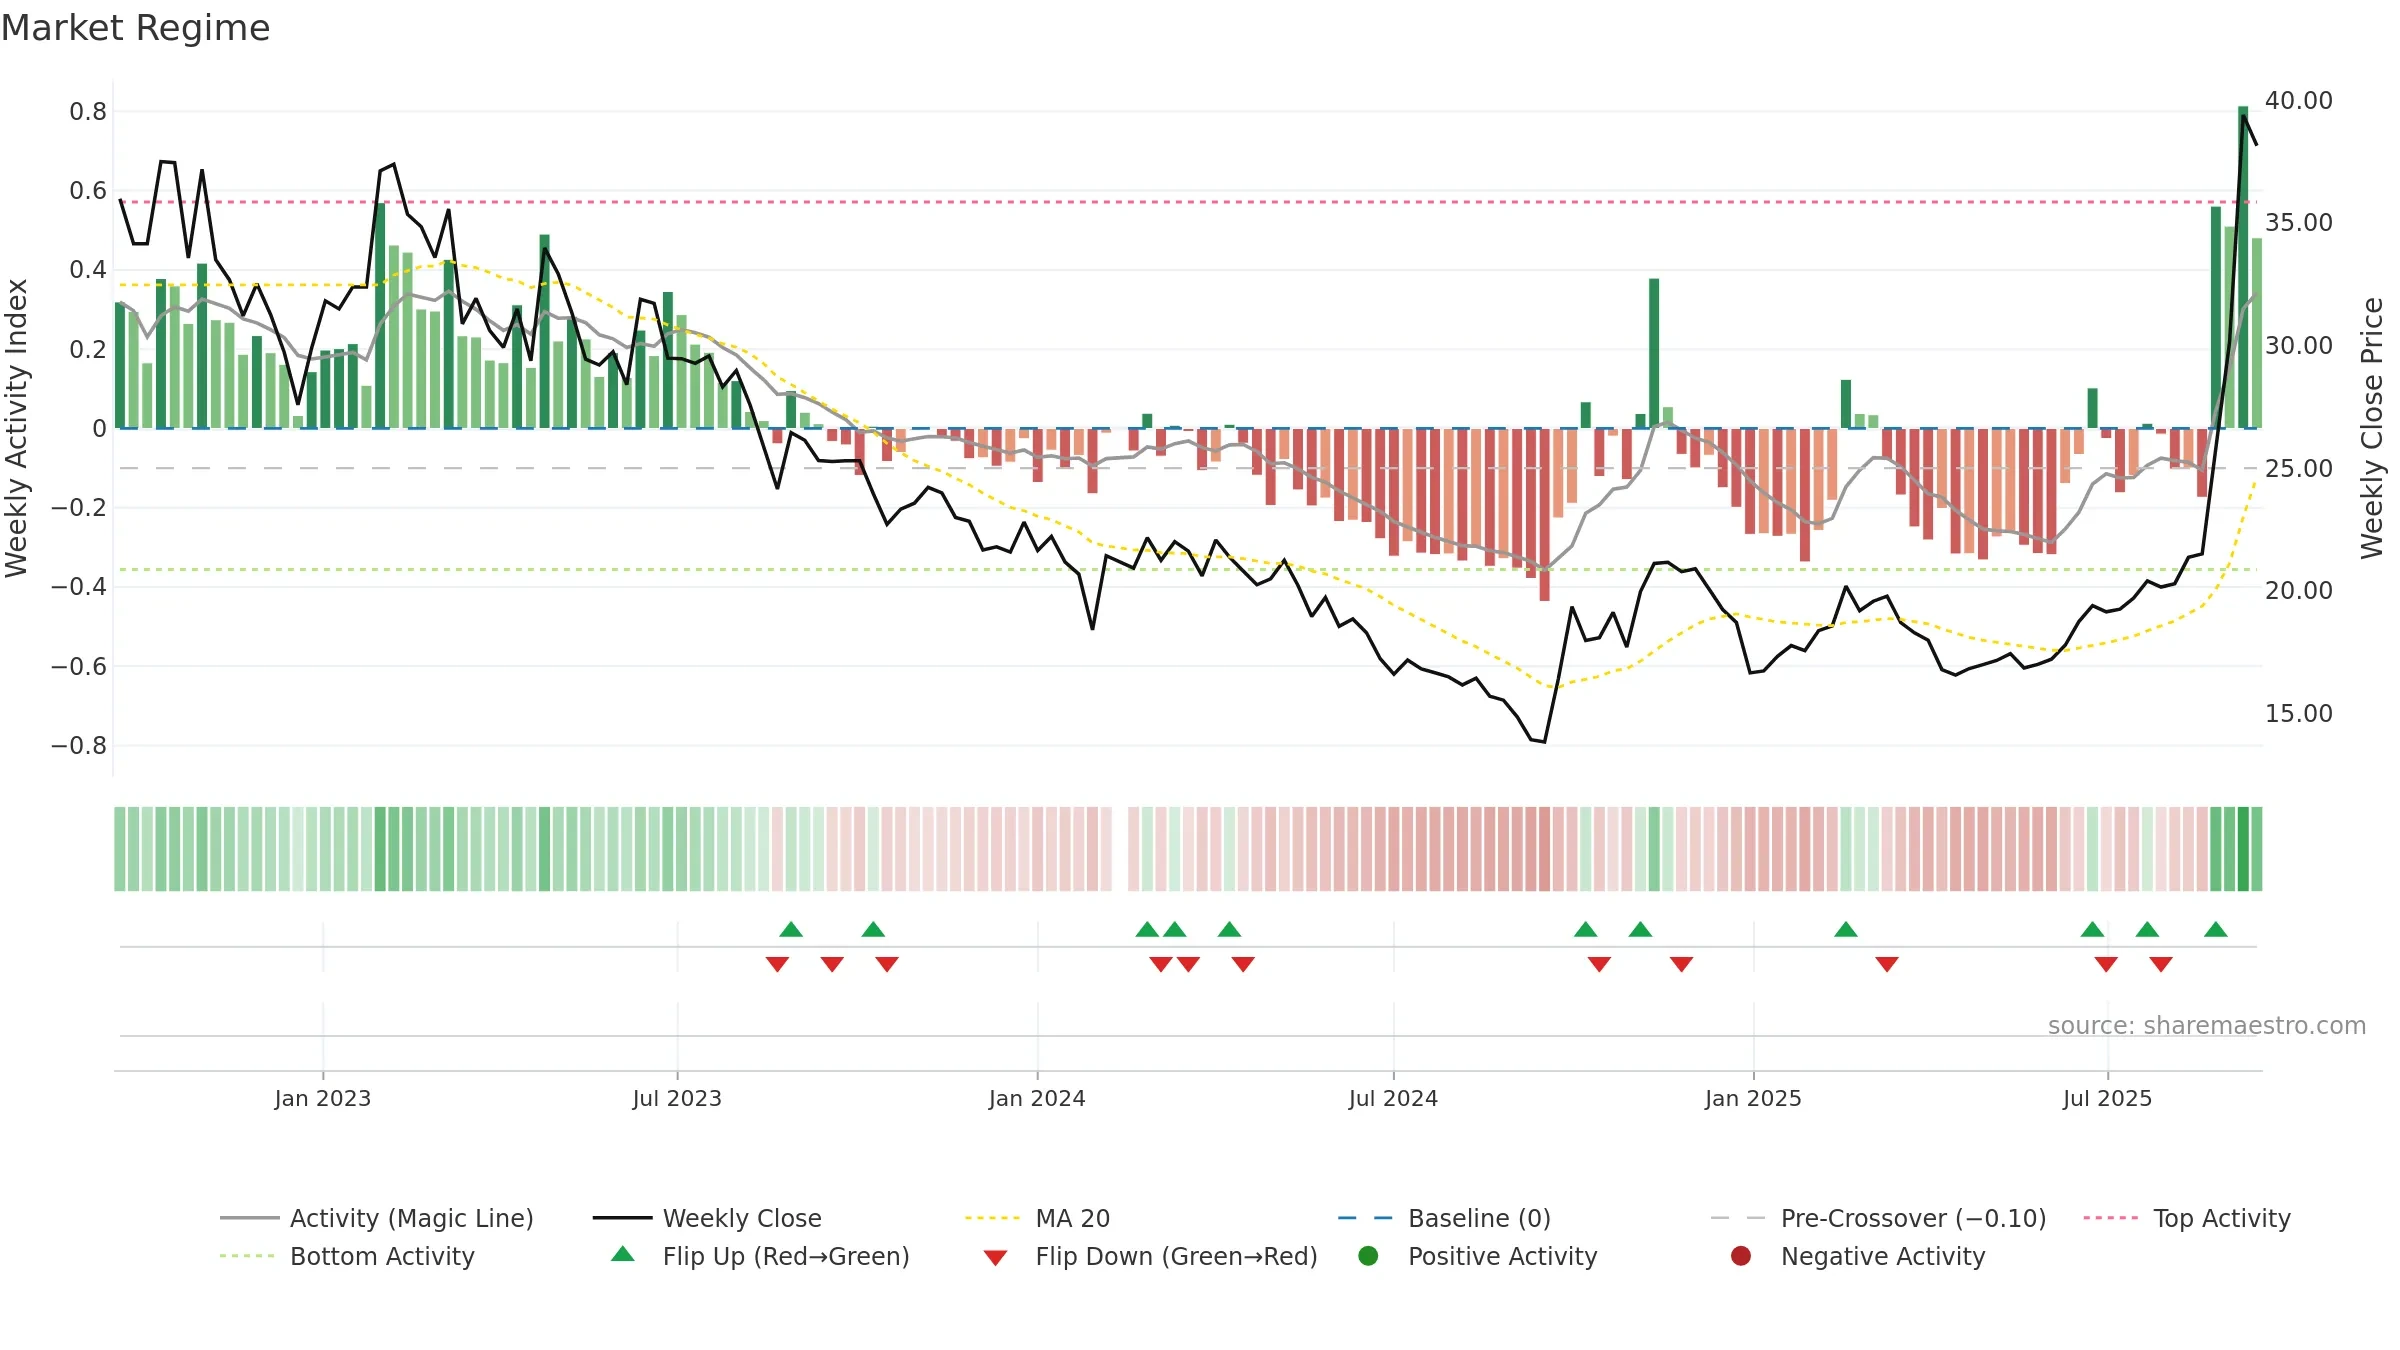
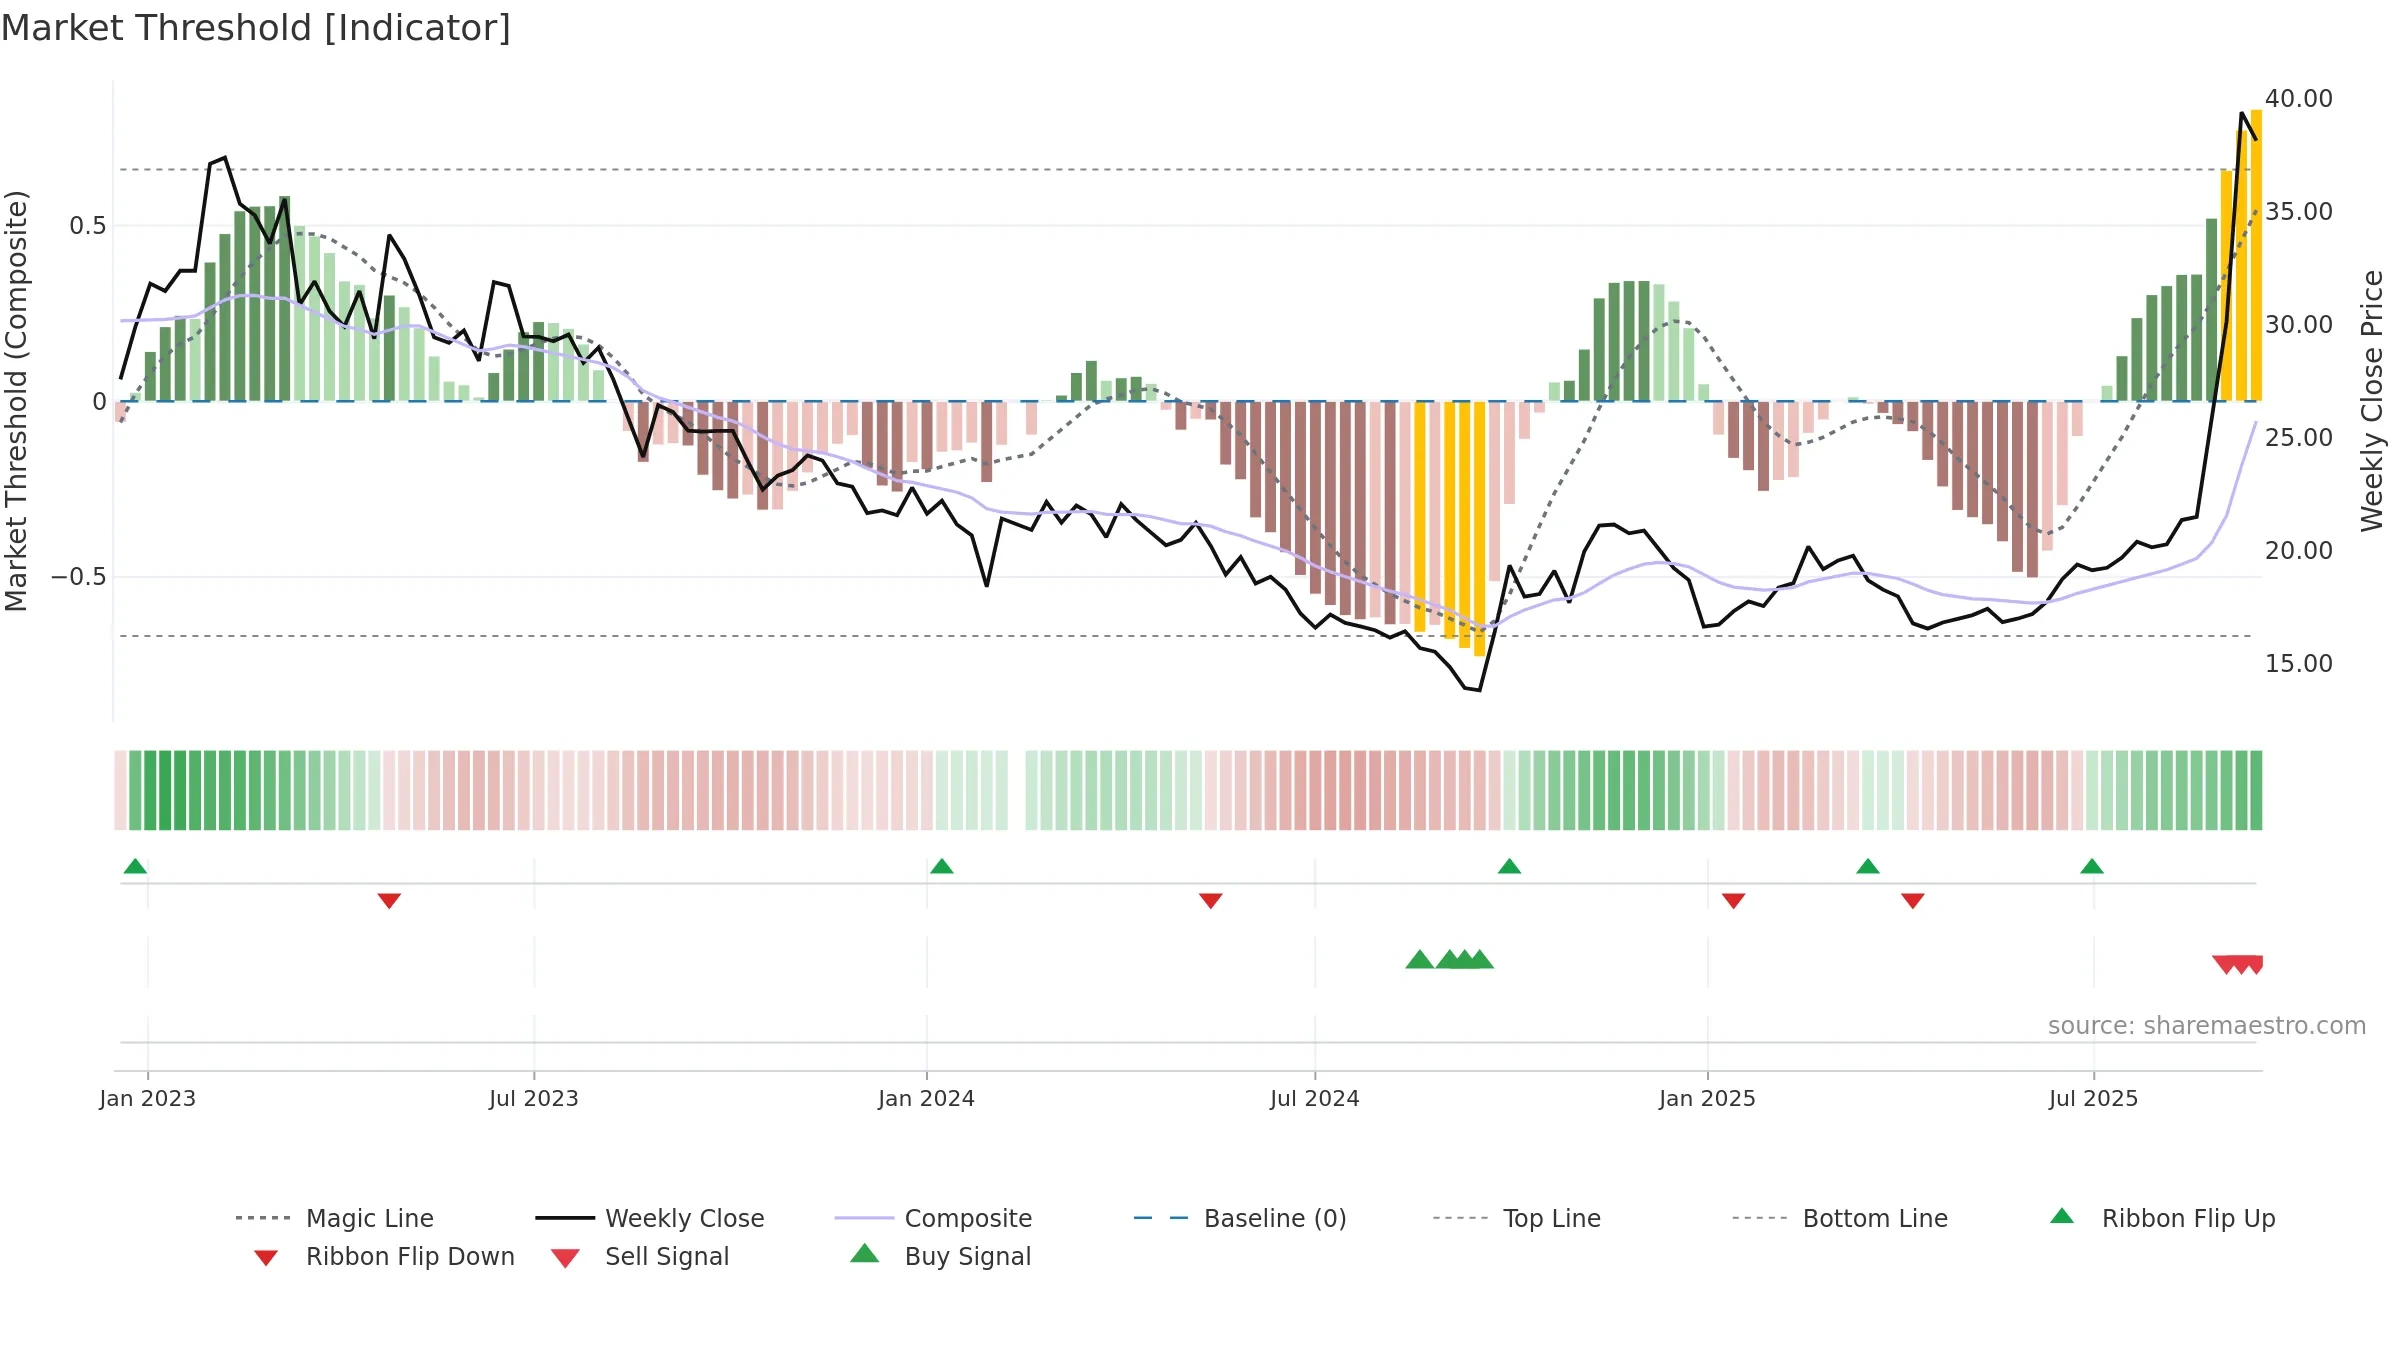
Gauge maps the trend signal to a 0–100 scale.
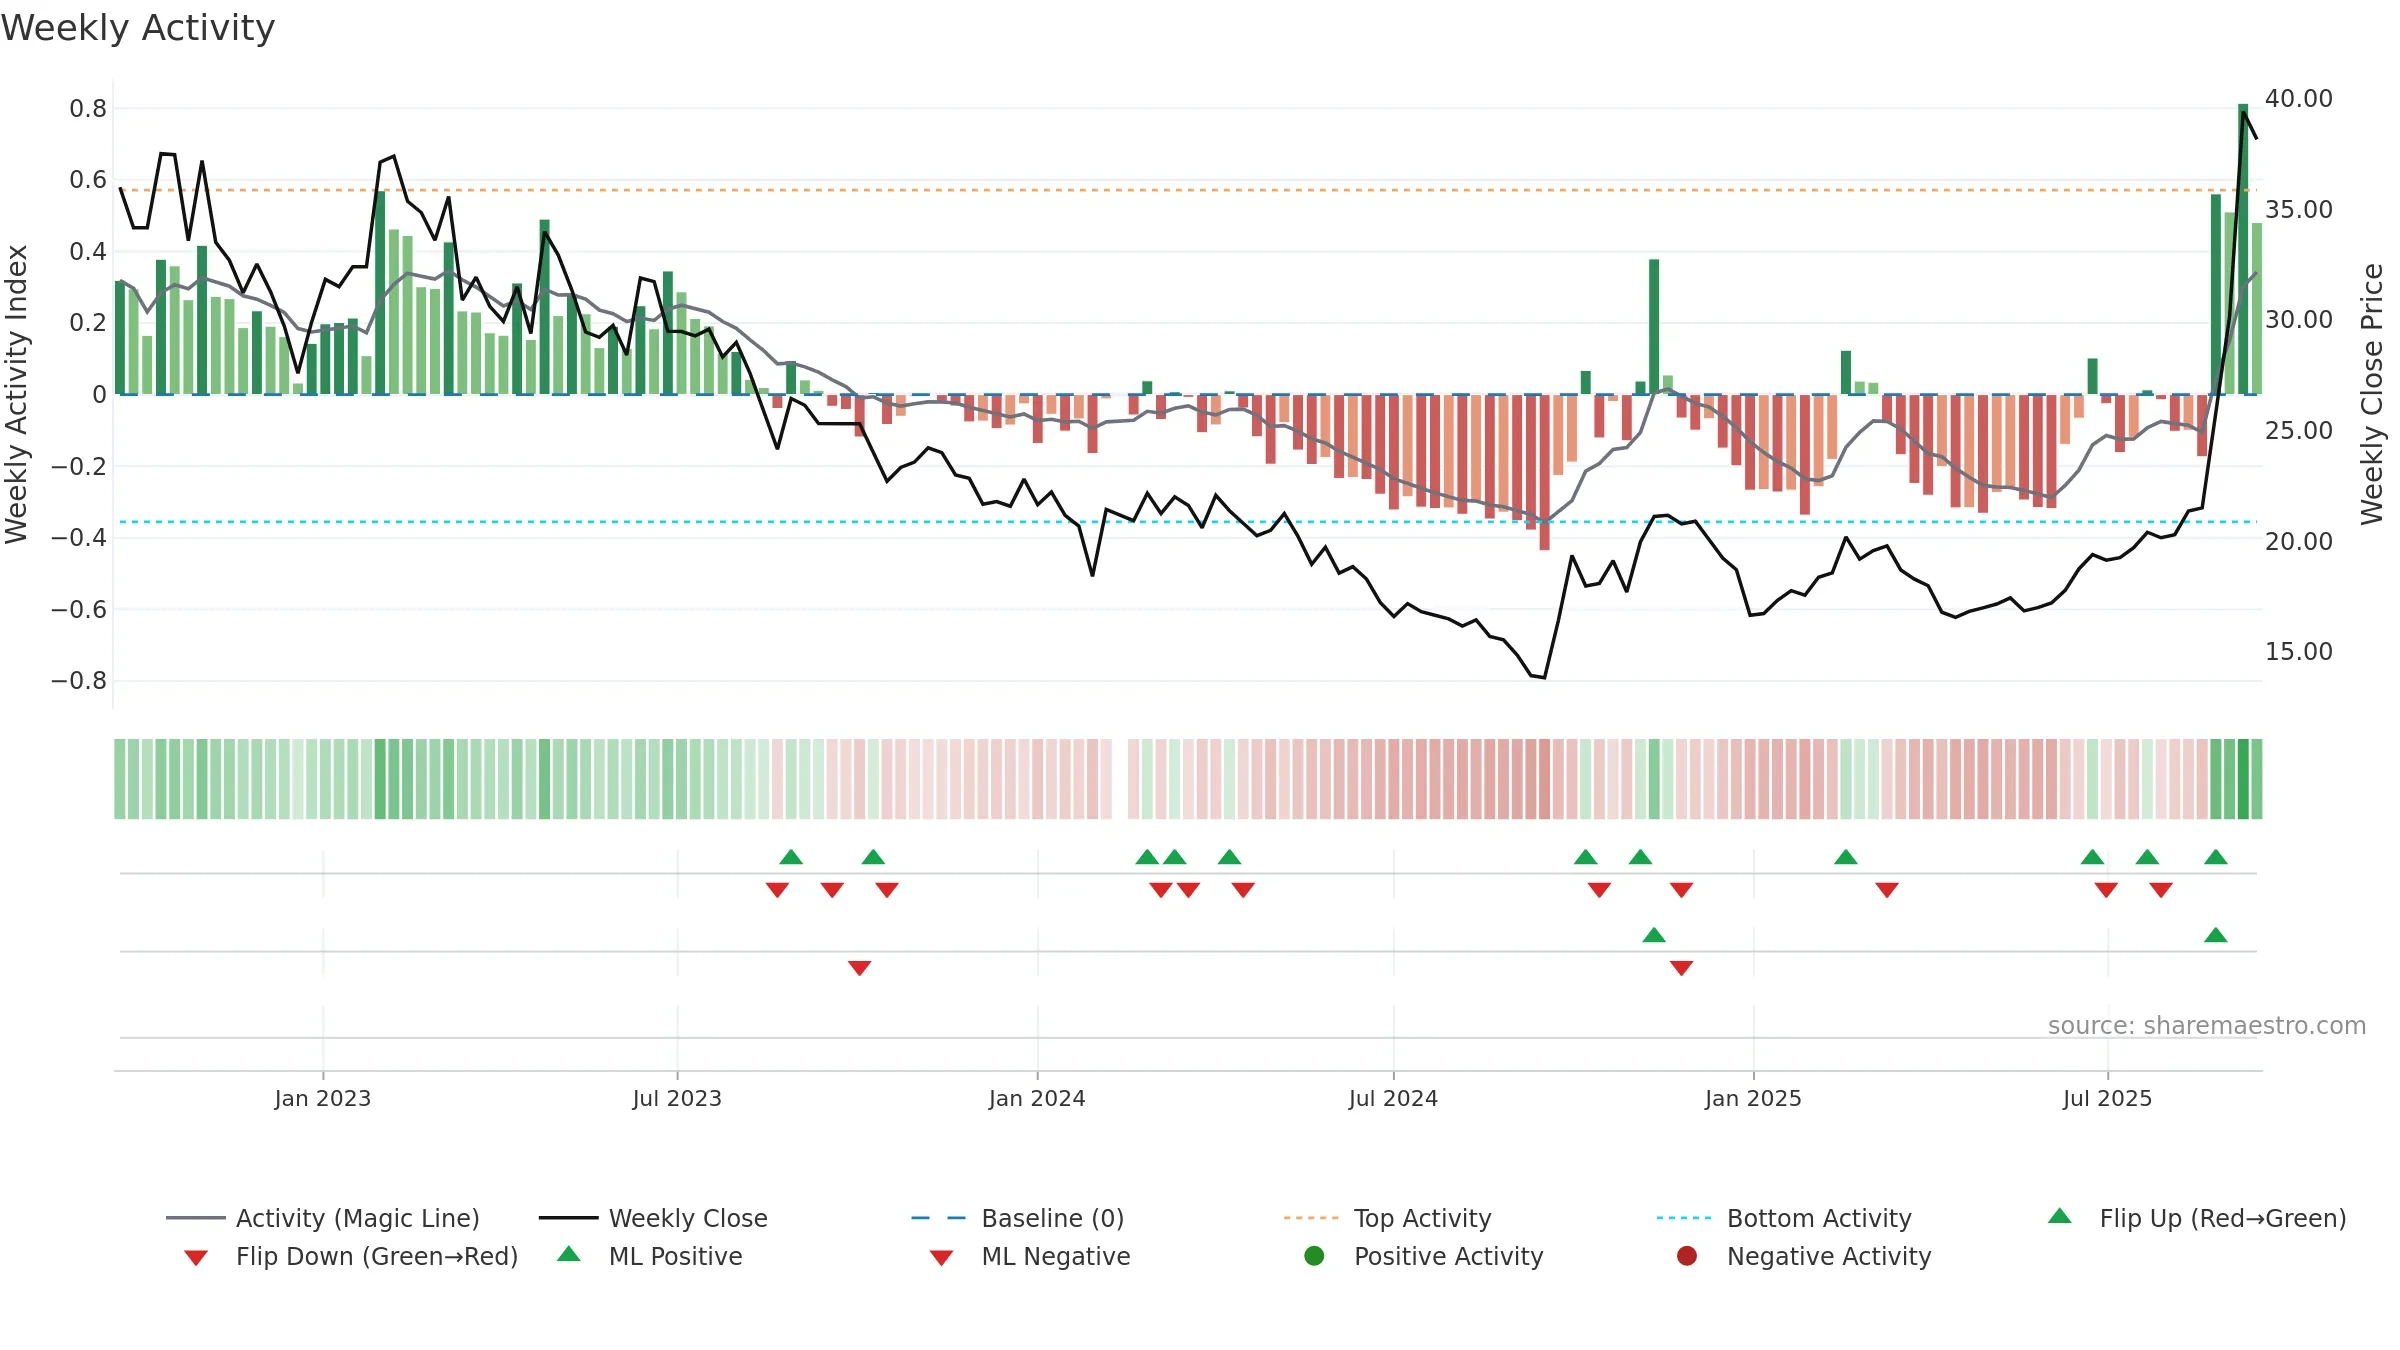
How to read this — Range-bound conditions; conviction is limited until a break or acceleration emerges.
Wait for a directional break or improving acceleration.
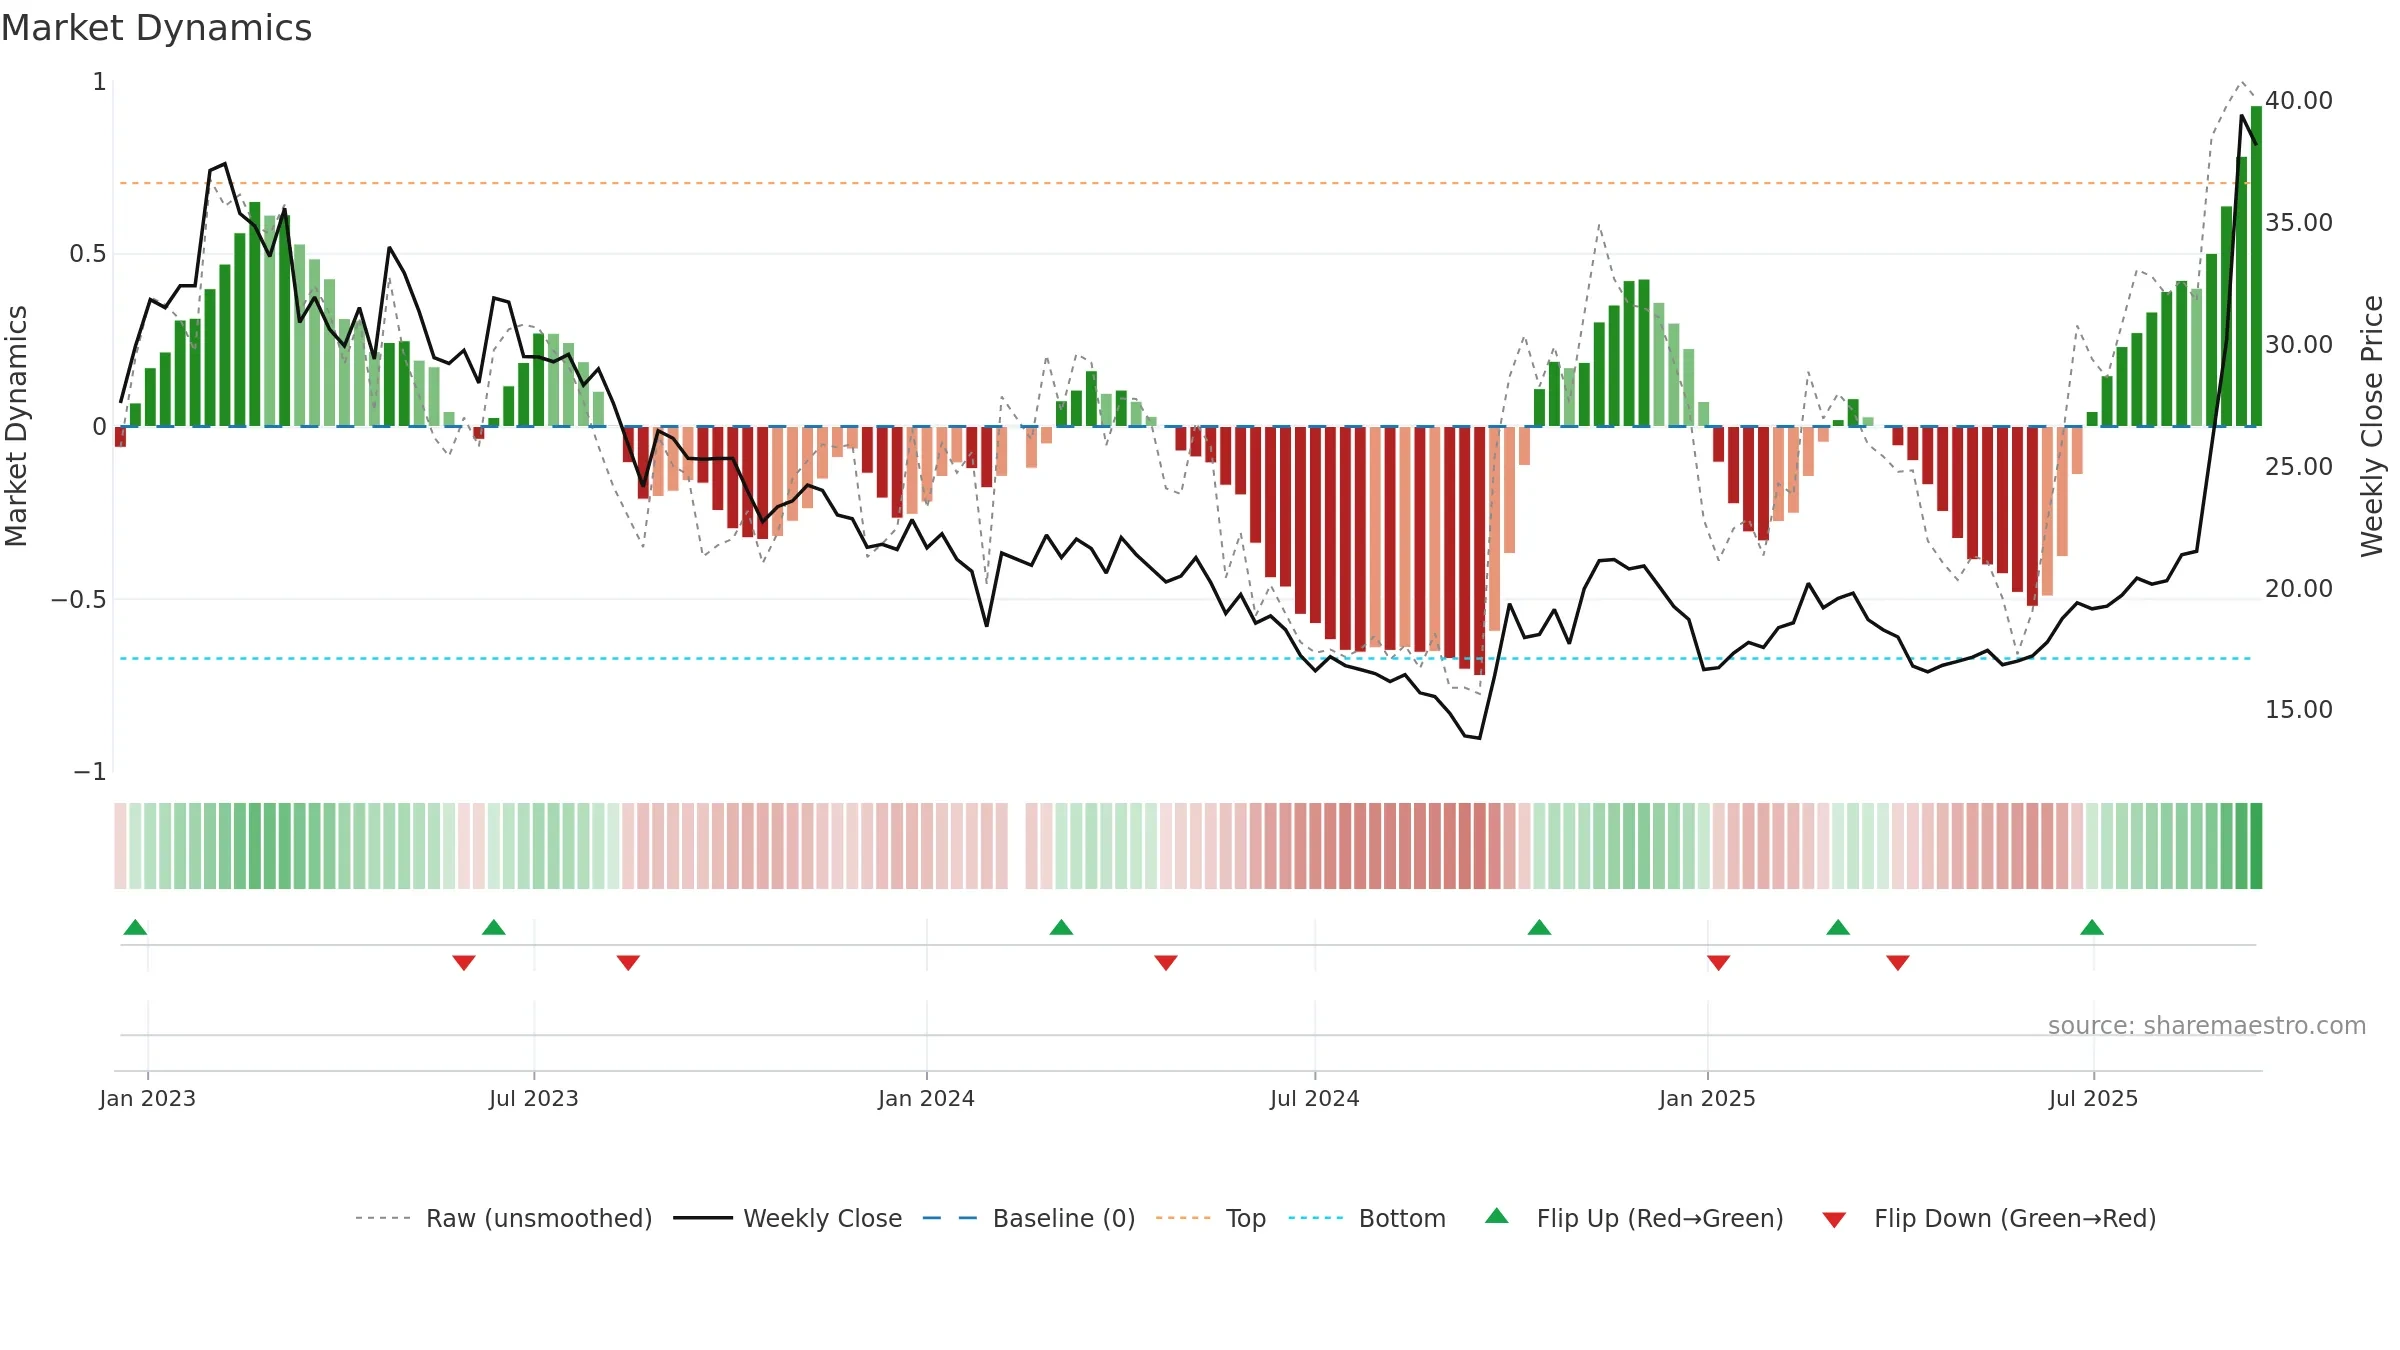
Price is above fair value; upside may be capped without catalysts.
Conclusion
Positive setup. ★★★★☆ confidence. Price window: 89. Trend: Range / Neutral; gauge 71. In combination, liquidity confirms the move.
- Momentum is bullish and rising
- Price holds above 8w & 26w averages
- Constructive moving-average stack
- Liquidity confirms the price trend
- High return volatility raises whipsaw risk
Why: Price window 89.24% over 8w. Close is -3.20% below the prior-window high. Return volatility 5.92%. Volume trend rising. Liquidity convergence with price. Trend state range / neutral. MA stack constructive. Momentum bullish and rising. Valuation limited upside without catalysts.
Tip: Most metrics include a hover tooltip where they appear in the report.