Wuhan Xingtu Xinke Electronics Co.,Ltd.
688081 SHA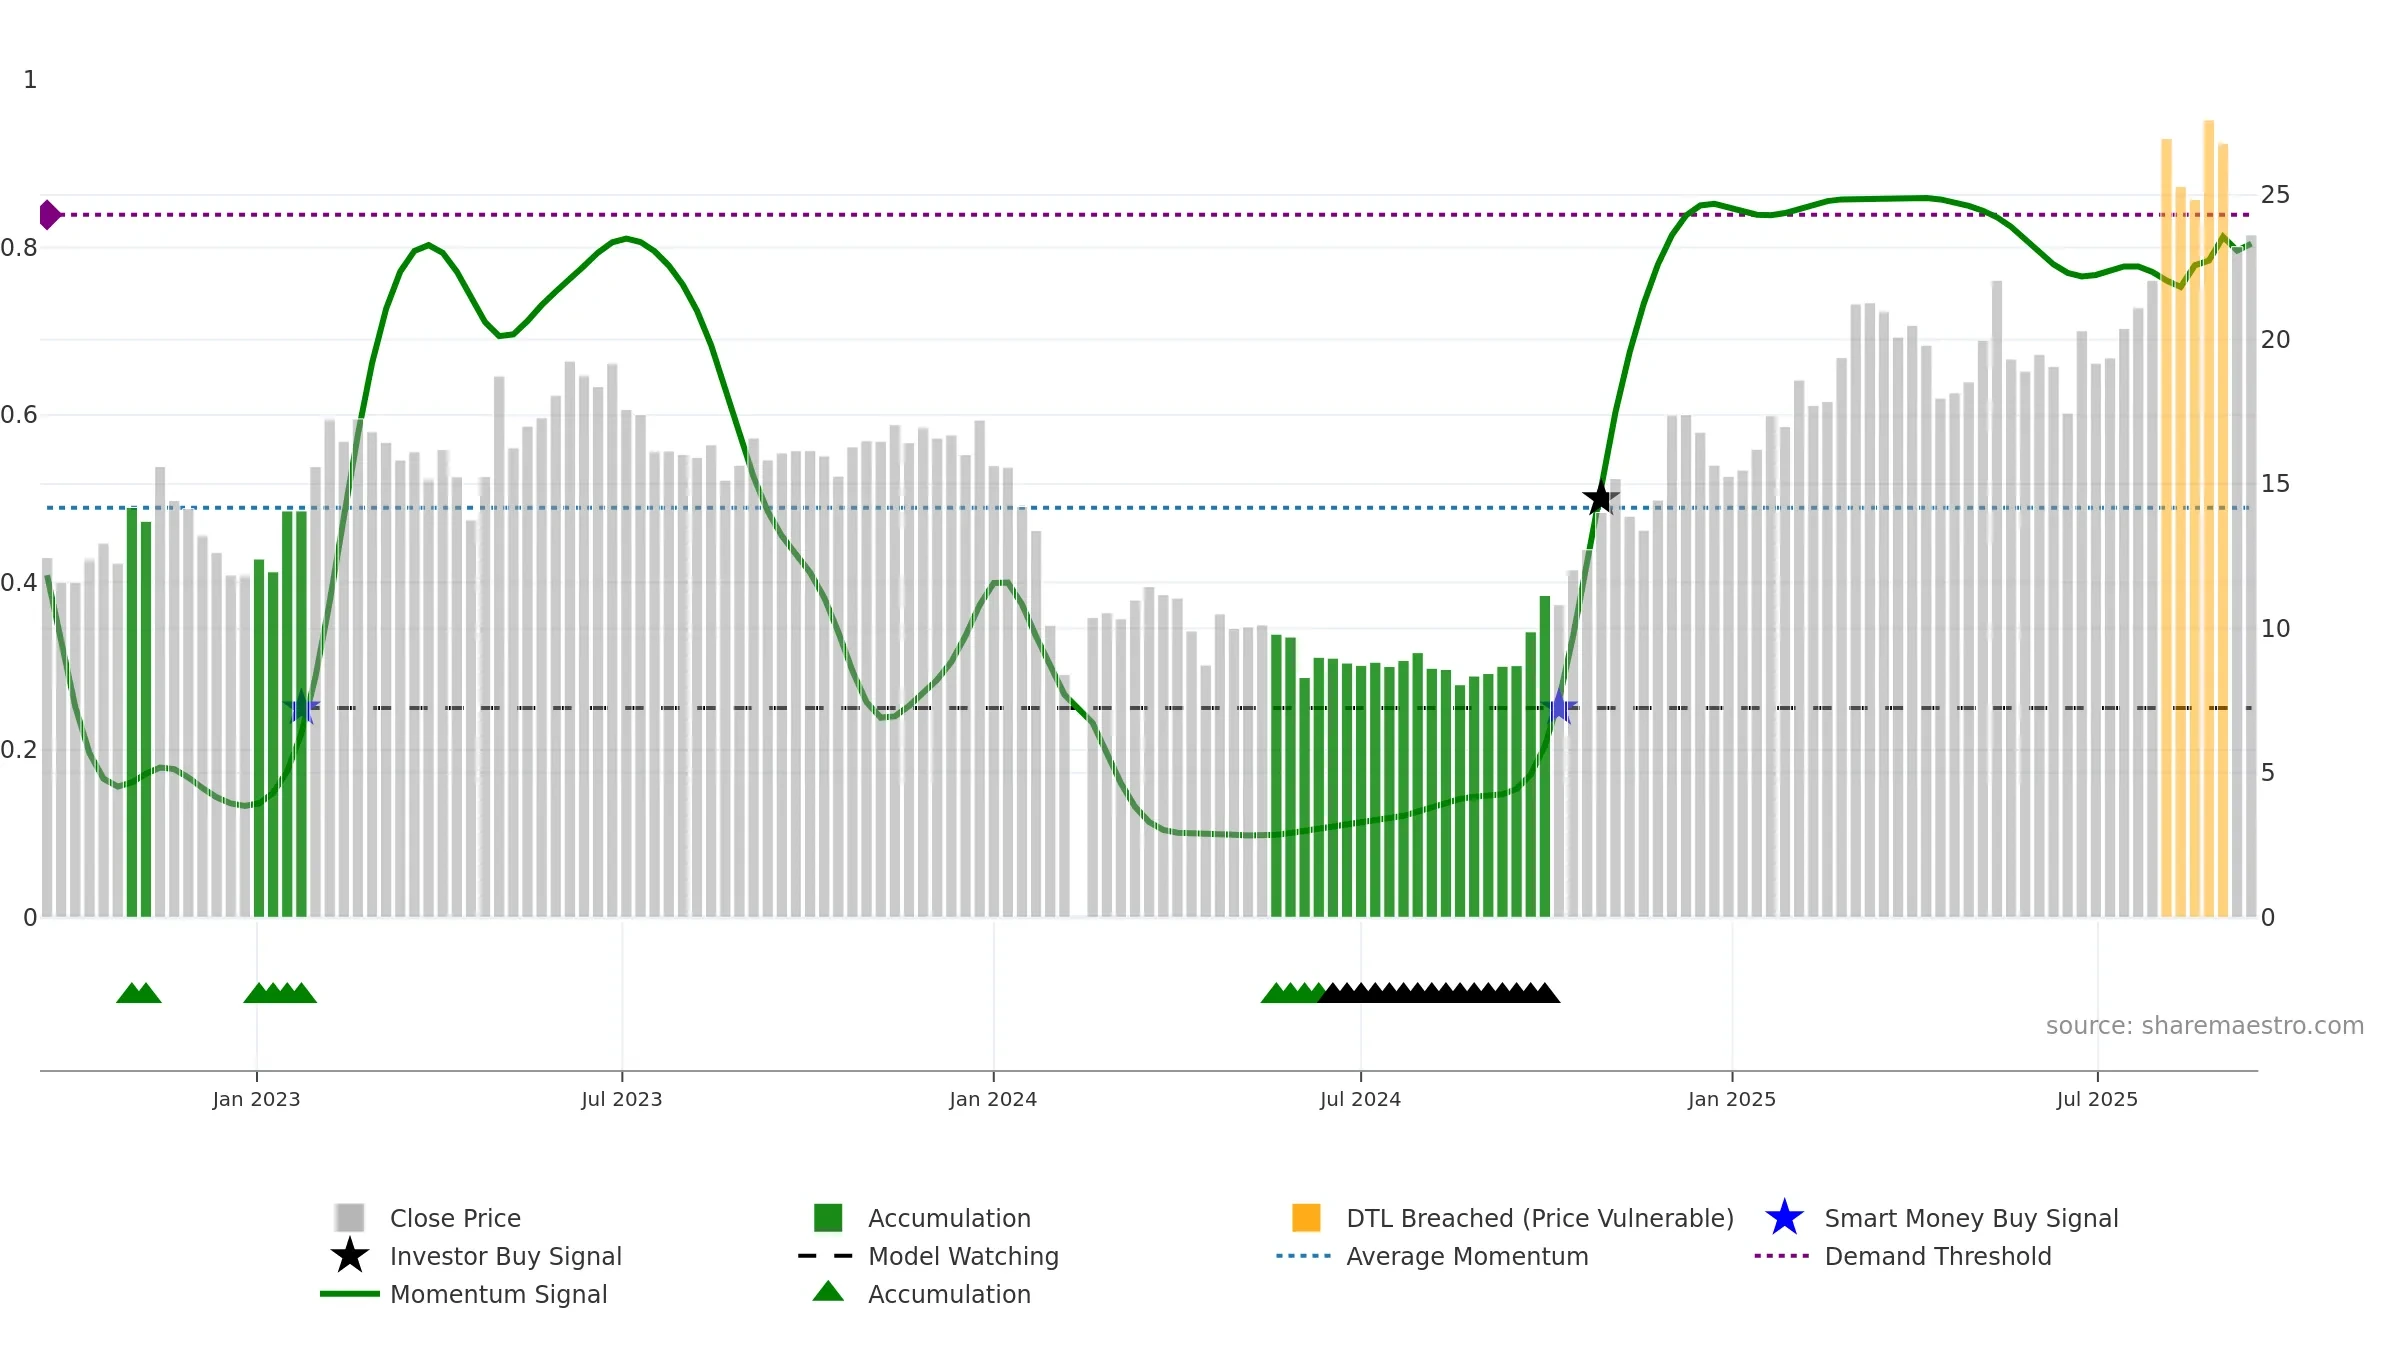
Weekly Report
Wuhan Xingtu Xinke Electronics Co.,Ltd. closed at 23.6200 (-1.09% WoW) . Data window ends Mon, 15 Sep 2025.
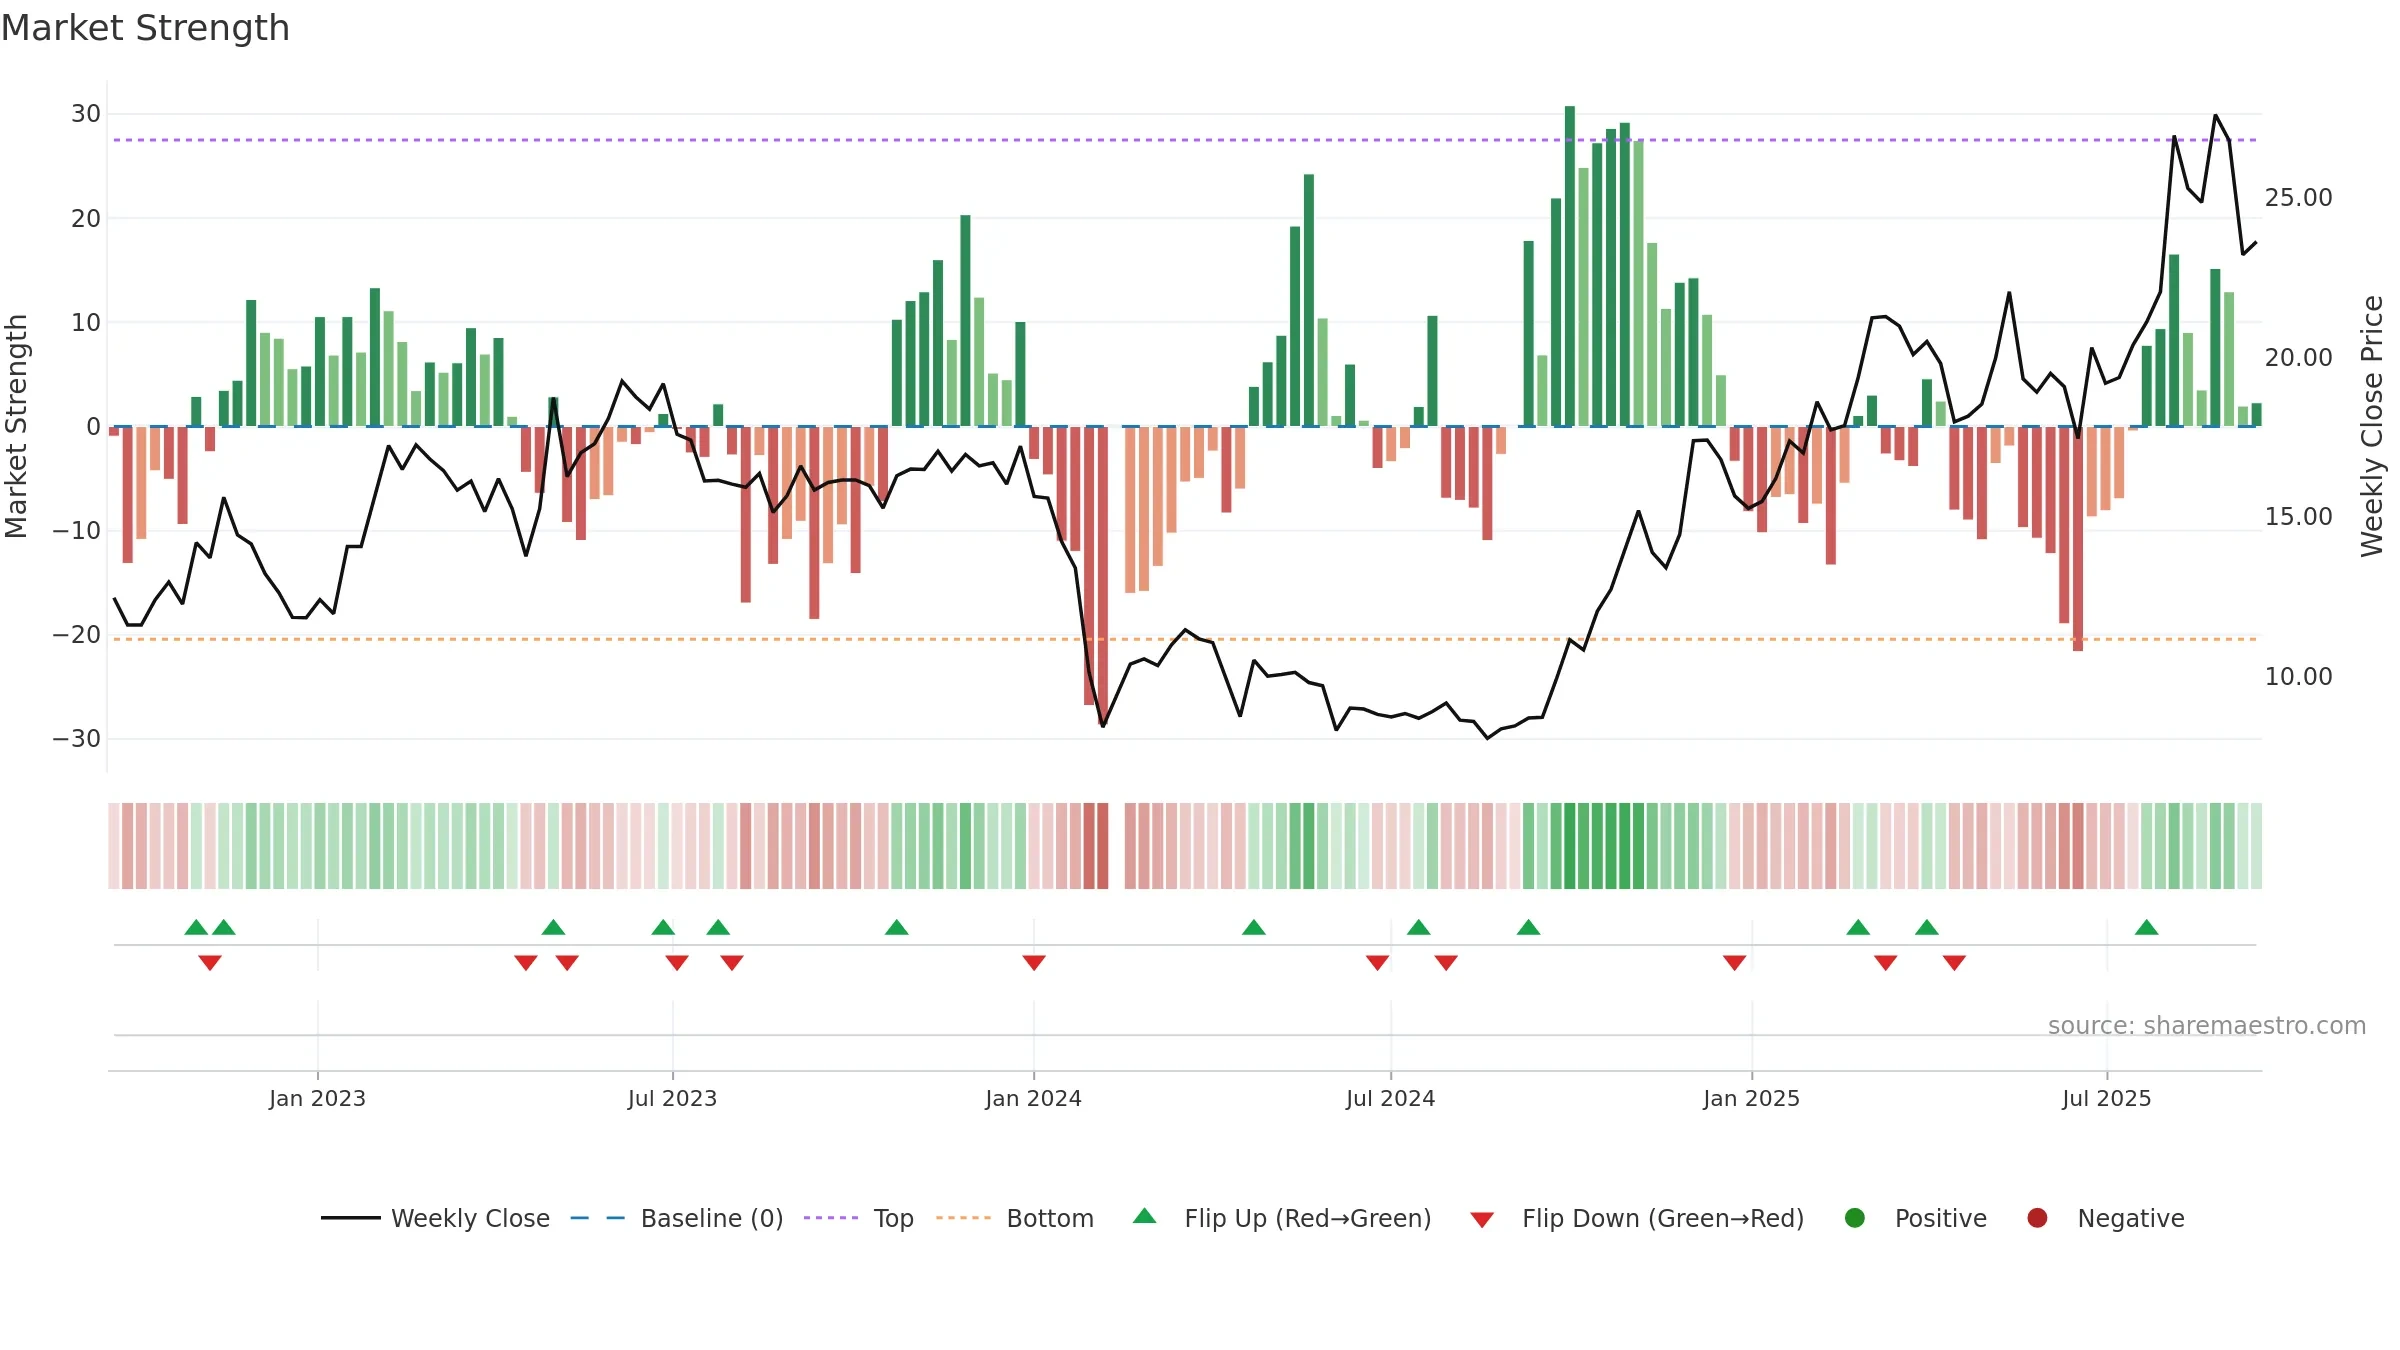
How to read this — Price slope is downward, indicating persistent supply pressure. Elevated weekly volatility increases whipsaw risk. Volume and price are moving in the same direction — a constructive confirmation. Returns are positively correlated with volume — strength tends to arrive on higher activity. Constructive MA stack supports the up-drift; pullbacks may find support at the 8–13 week region.
Down-slope argues for patience; rallies can fade sooner unless participation improves.
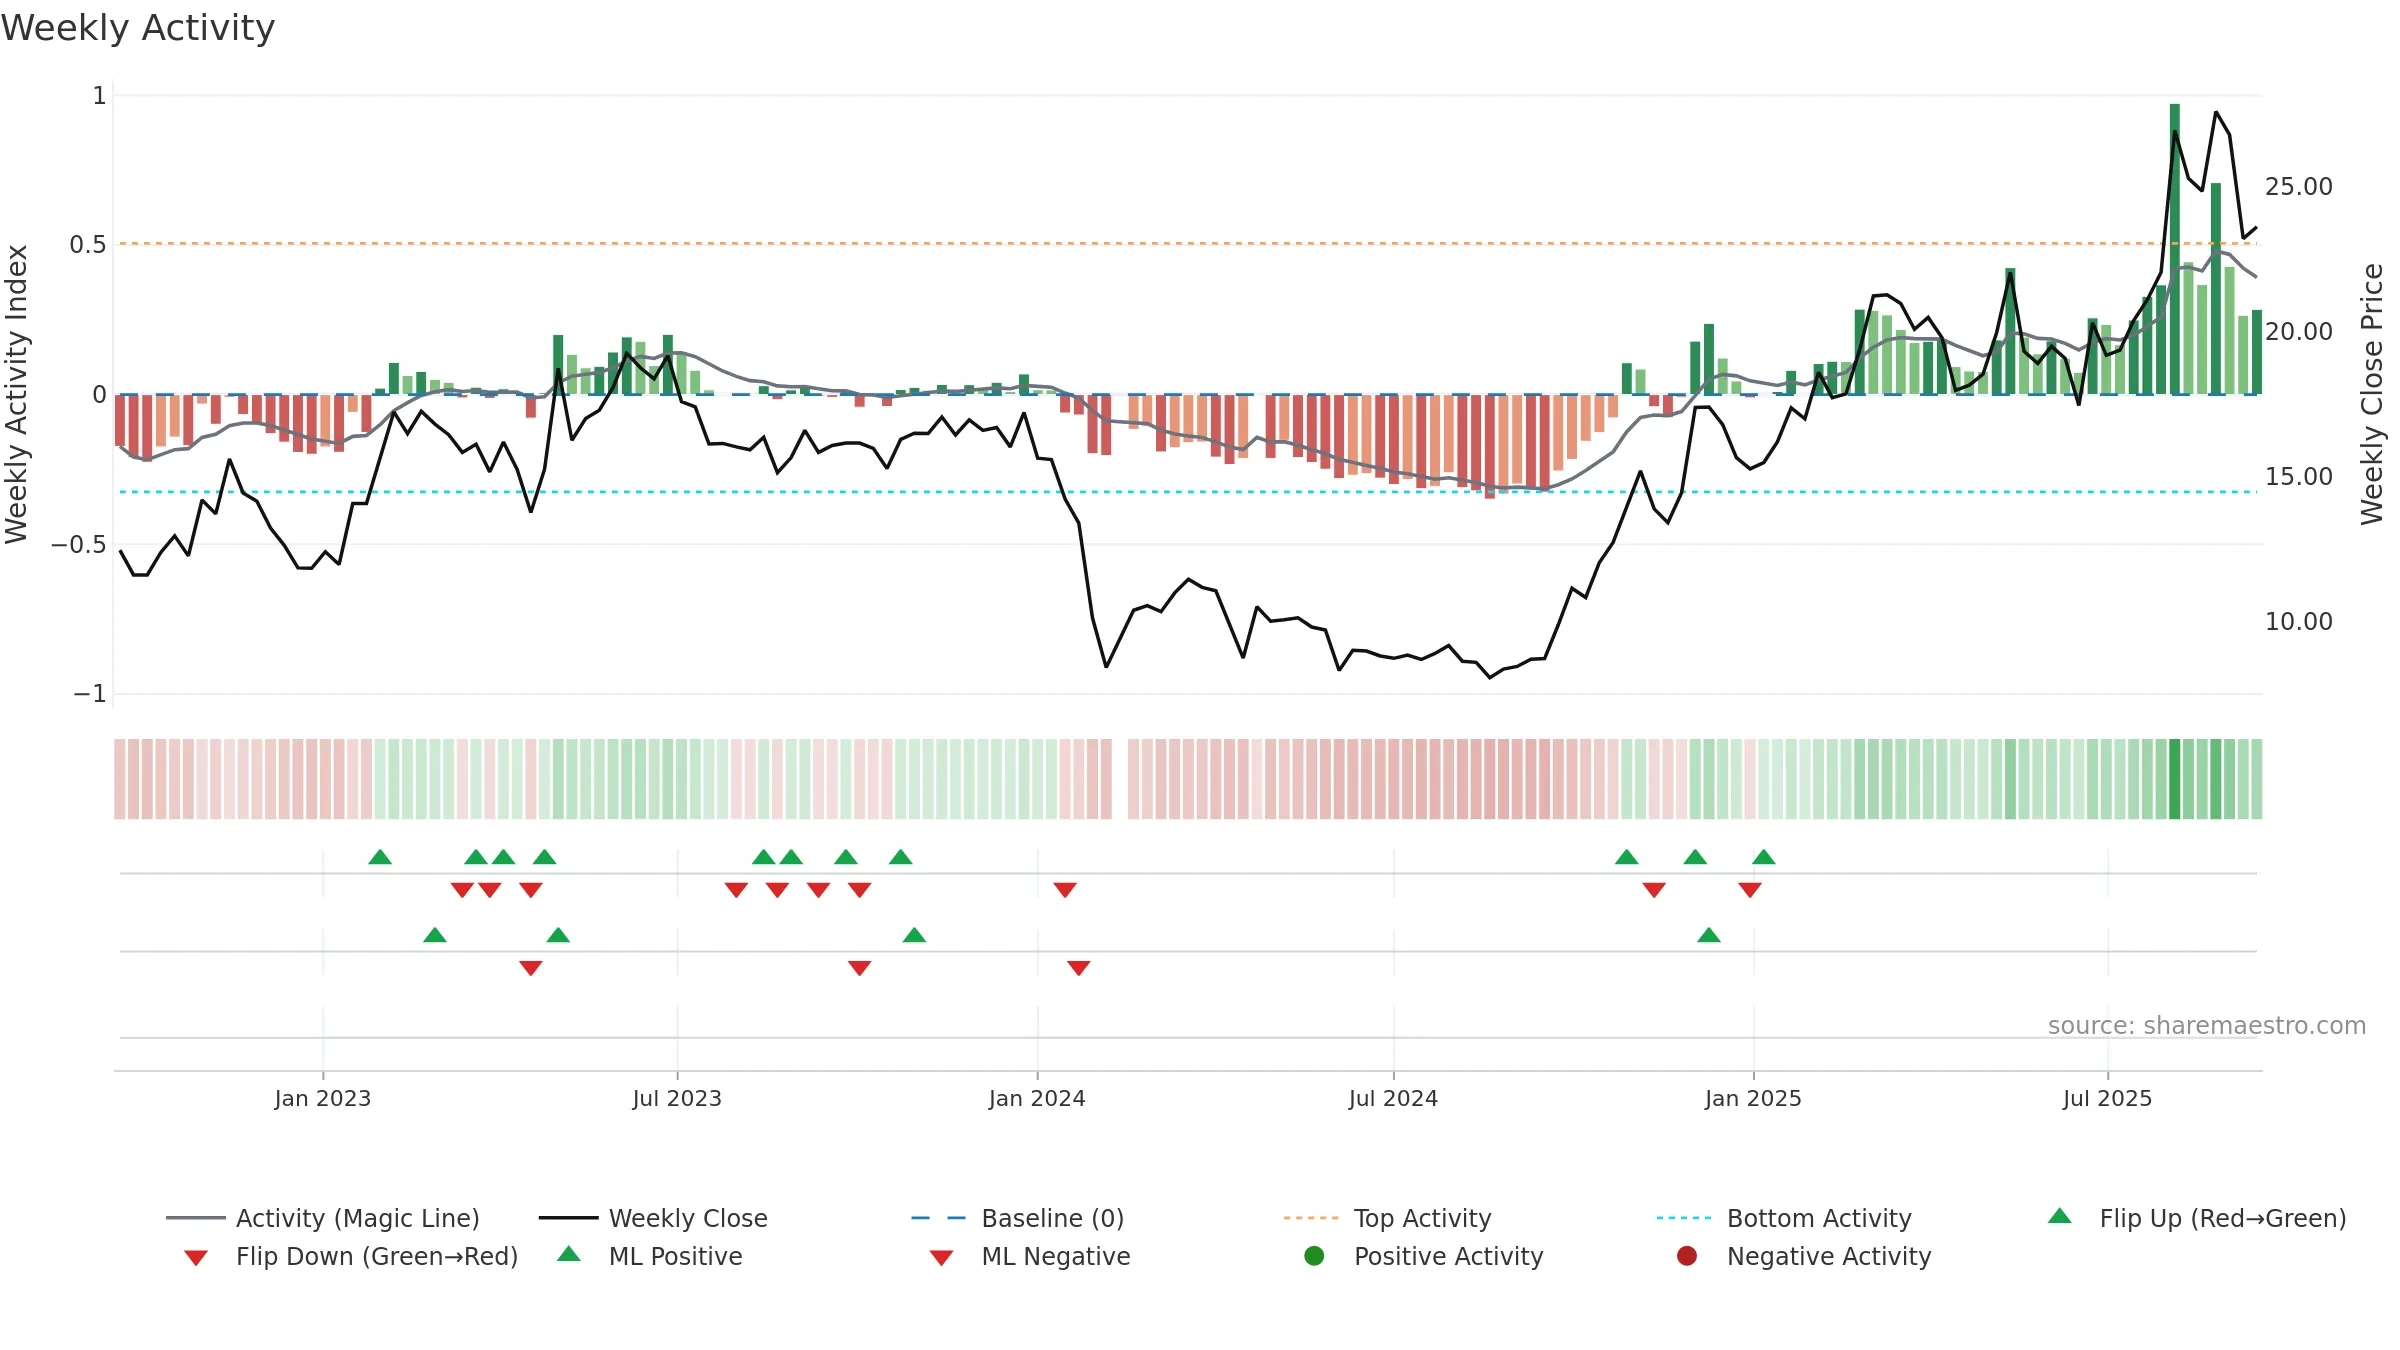
Gauge maps the trend signal to a 0–100 scale.
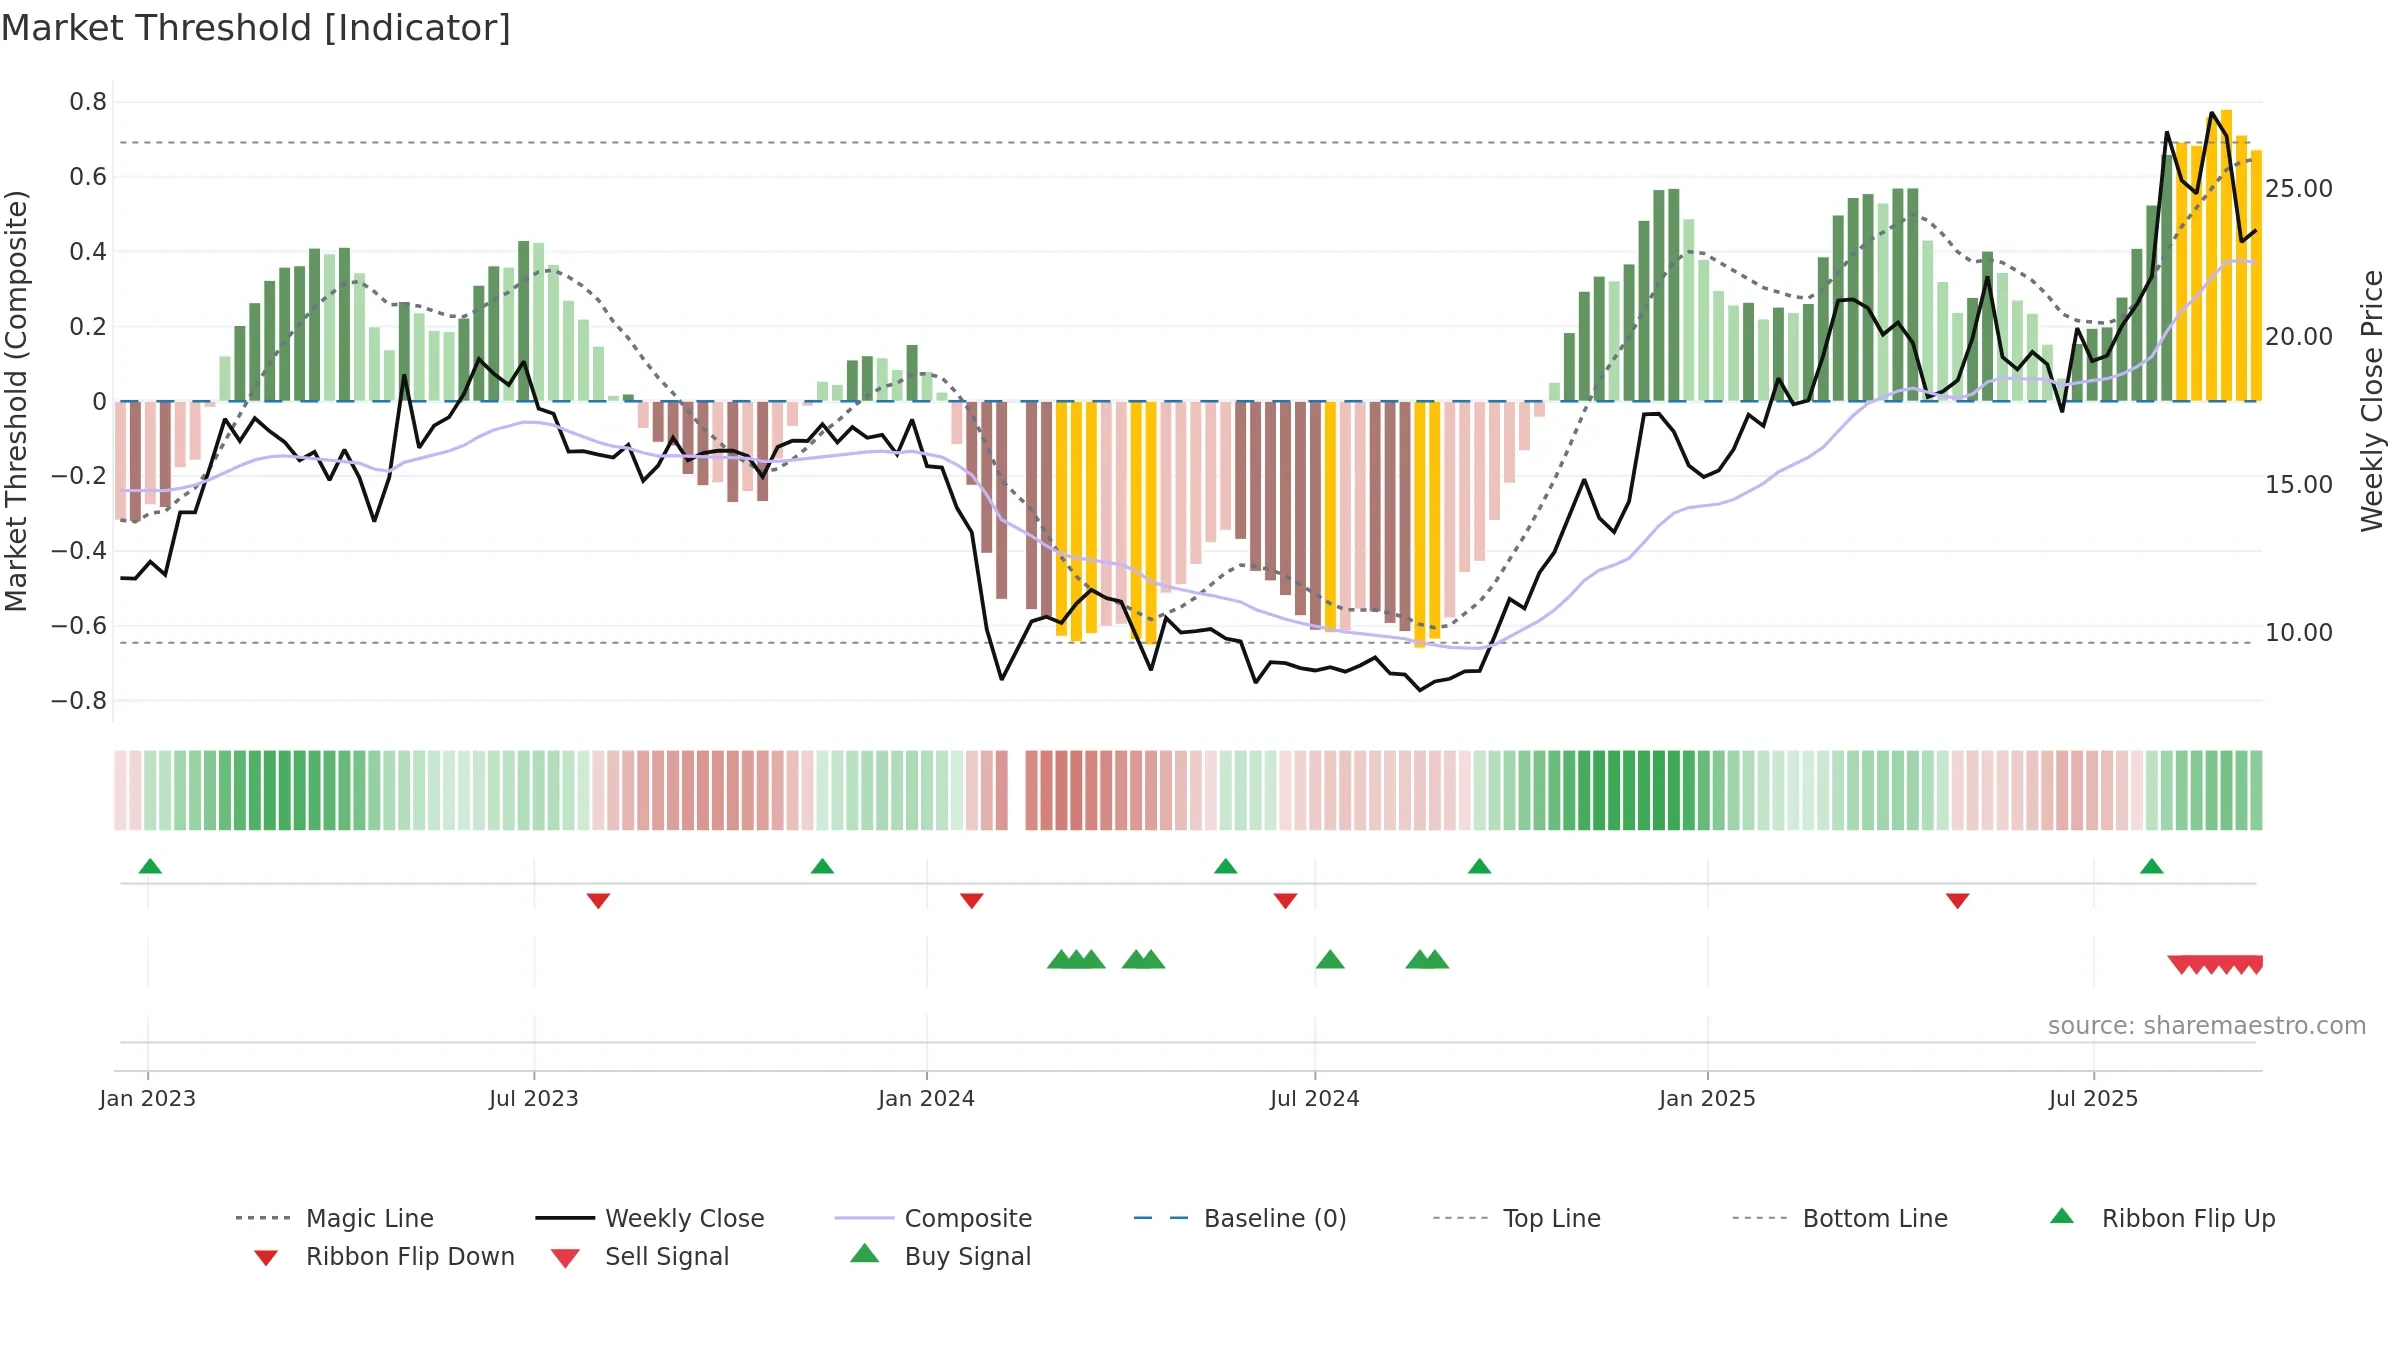
How to read this — Range-bound conditions; conviction is limited until a break or acceleration emerges. Notable breakdown from ≥0.80 weakens trend quality.
Wait for a directional break or improving acceleration.
Conclusion
Neutral setup. ★★★☆☆ confidence. Price window: 7. Trend: Range / Neutral; gauge 80. In combination, liquidity confirms the move.
- Momentum is bullish and rising
- Constructive moving-average stack
- Liquidity confirms the price trend
- Price is not above key averages
- High return volatility raises whipsaw risk
- Recent breakdown from ≥0.80 weakens trend quality
Why: Price window 7.12% over 8w. Close is -14.42% below the prior-window high. Return volatility 7.45%. Volume trend falling. Liquidity convergence with price. Trend state range / neutral. MA stack constructive. Momentum bullish and rising.
Tip: Most metrics include a hover tooltip where they appear in the report.