Centene Corporation
CNC NYSE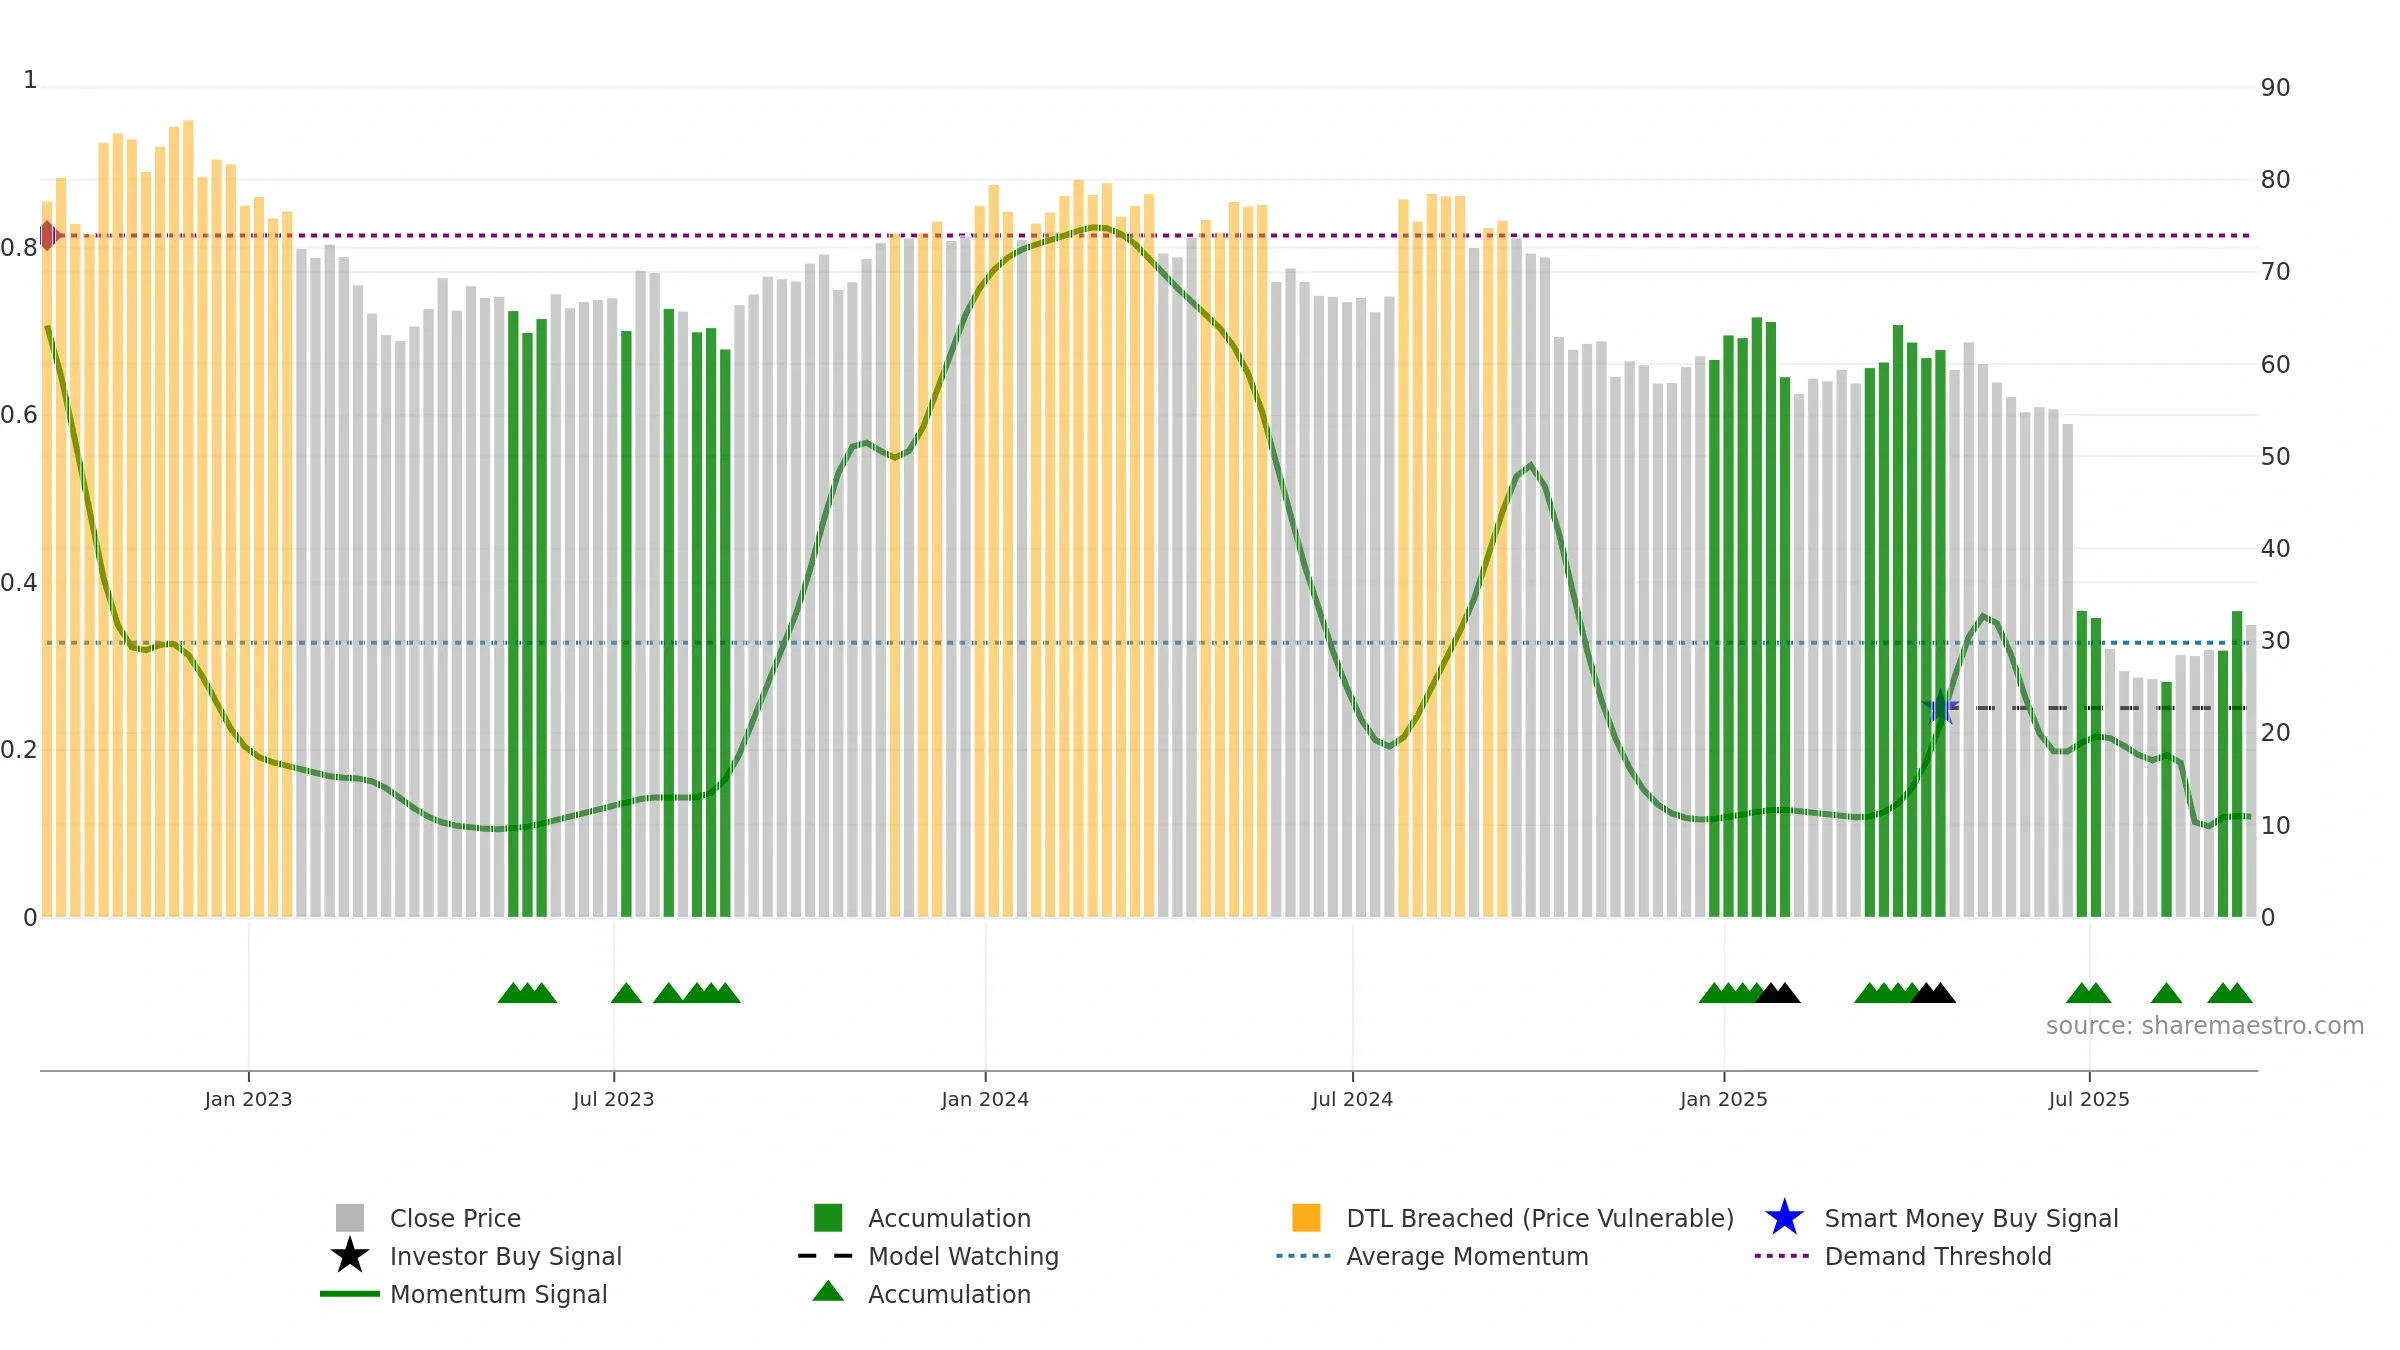
Weekly Report
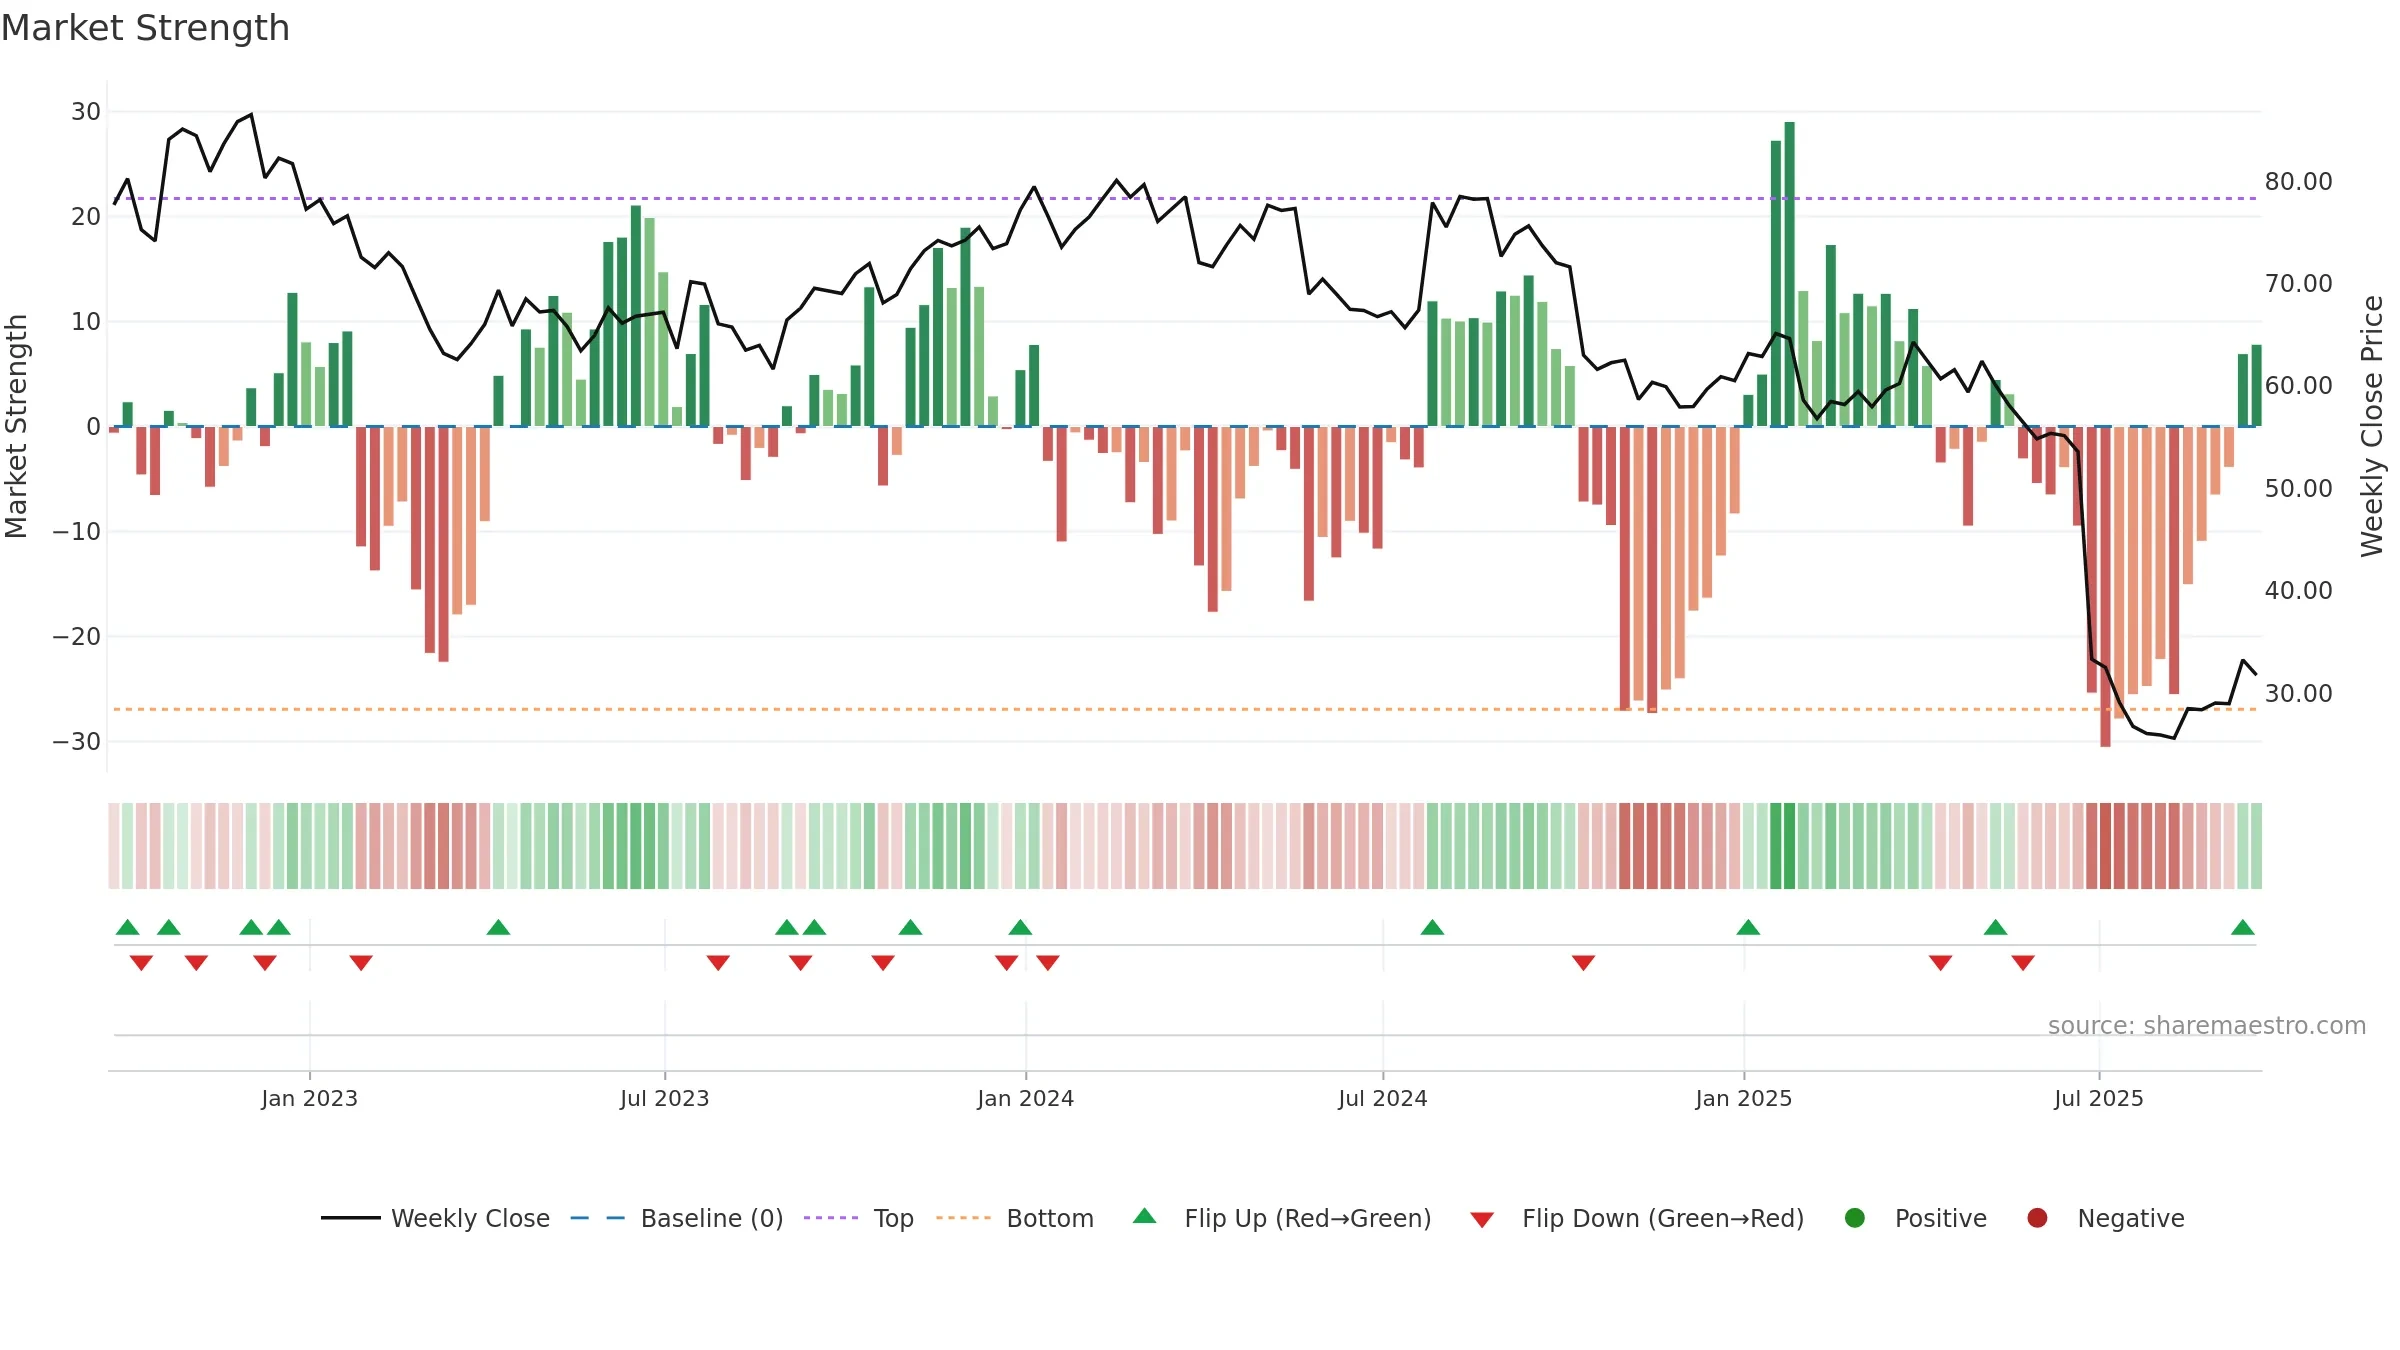
Centene Corporation closed at 31.7700 (-1.61% WoW) . Data window ends Fri, 19 Sep 2025.
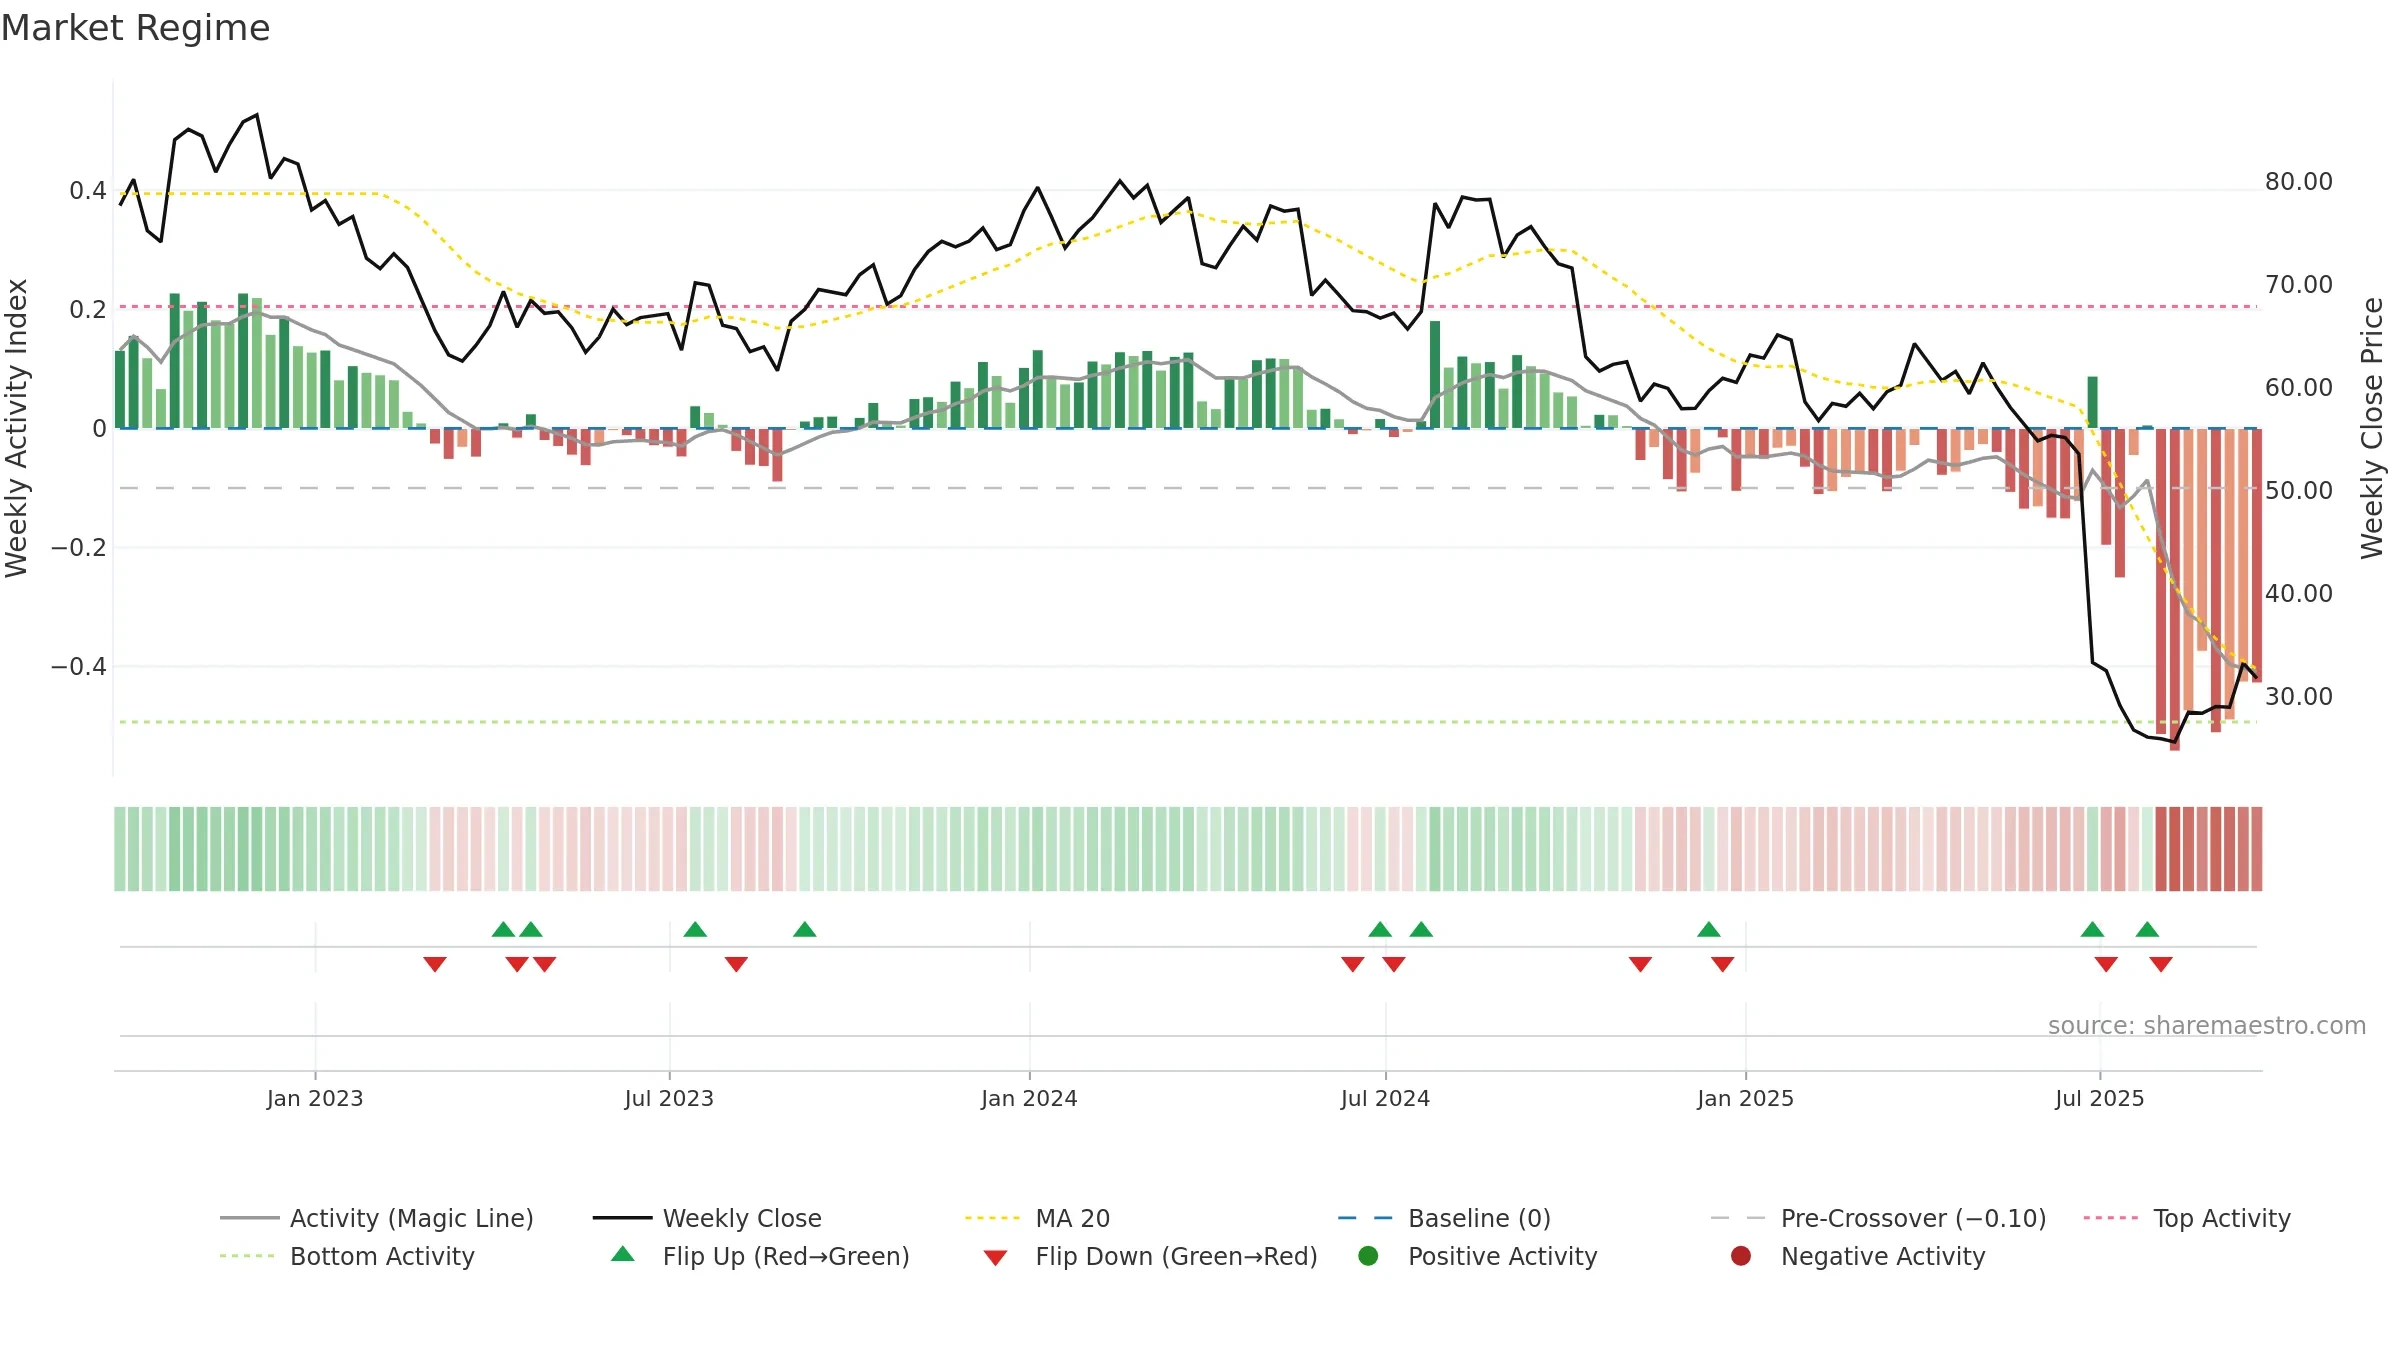
How to read this — Price slope is upward, indicating persistent buying over the window. Low weekly volatility favours steadier follow-through. Volume trend diverges from price — watch for fatigue or rotation. Returns are negatively correlated with volume — strength may come on lighter activity.
Up-slope supports buying interest; pullbacks may be contained if activity stays firm. Because liquidity isn’t confirming, prefer evidence of fresh demand before chasing moves.
Gauge maps the trend signal to a 0–100 scale.
How to read this — Range-bound conditions; conviction is limited until a break or acceleration emerges.
Wait for a directional break or improving acceleration.
The flag is positive: favourable upside skew with supportive conditions.
Conclusion
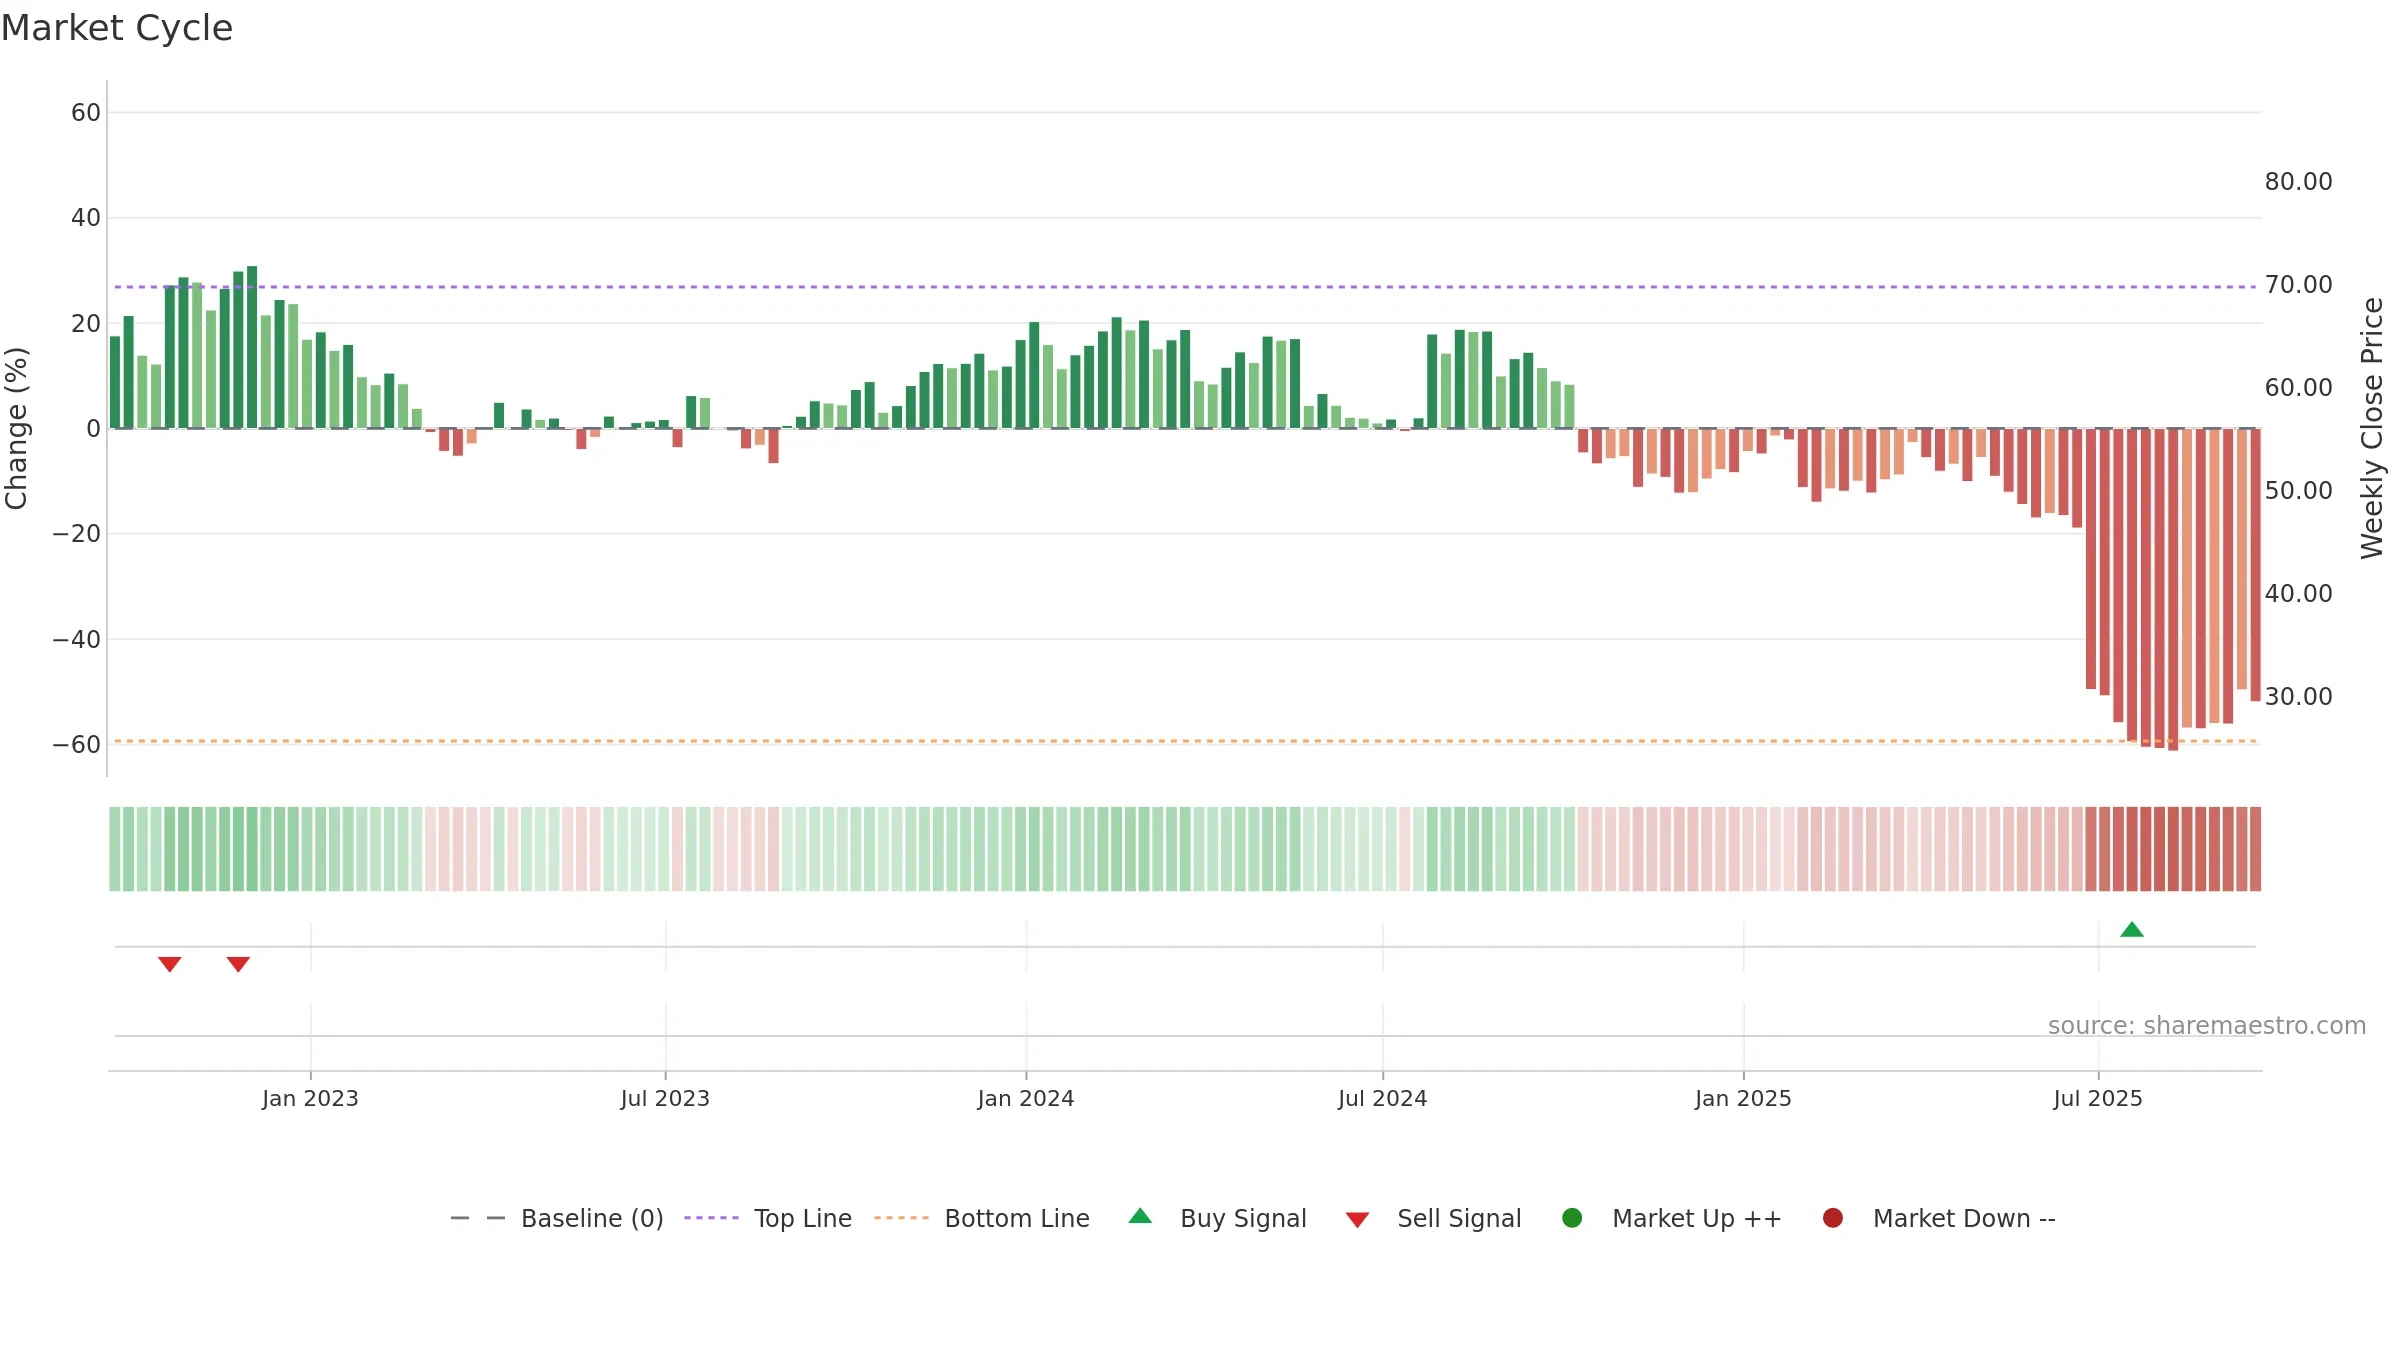
Negative setup. ★★☆☆☆ confidence. Price window: 22. Trend: Range / Neutral; gauge 12. In combination, liquidity diverges from price.
- Low return volatility supports durability
- Solid multi-week performance
- Momentum is weak/falling
- Price is not above key averages
- Liquidity diverges from price
Why: Price window 22.62% over 8w. Close is -4.48% below the prior-window high. Return volatility 1.91%. Volume trend falling. Liquidity divergence with price. Trend state range / neutral. Low-regime (≤0.25) upticks 3/7 (43.0%) • Distributing. Momentum bearish and falling. Valuation stance positive.
Tip: Most metrics include a hover tooltip where they appear in the report.