Aditya Birla Sun Life AMC Limited
ABSLAMC NSE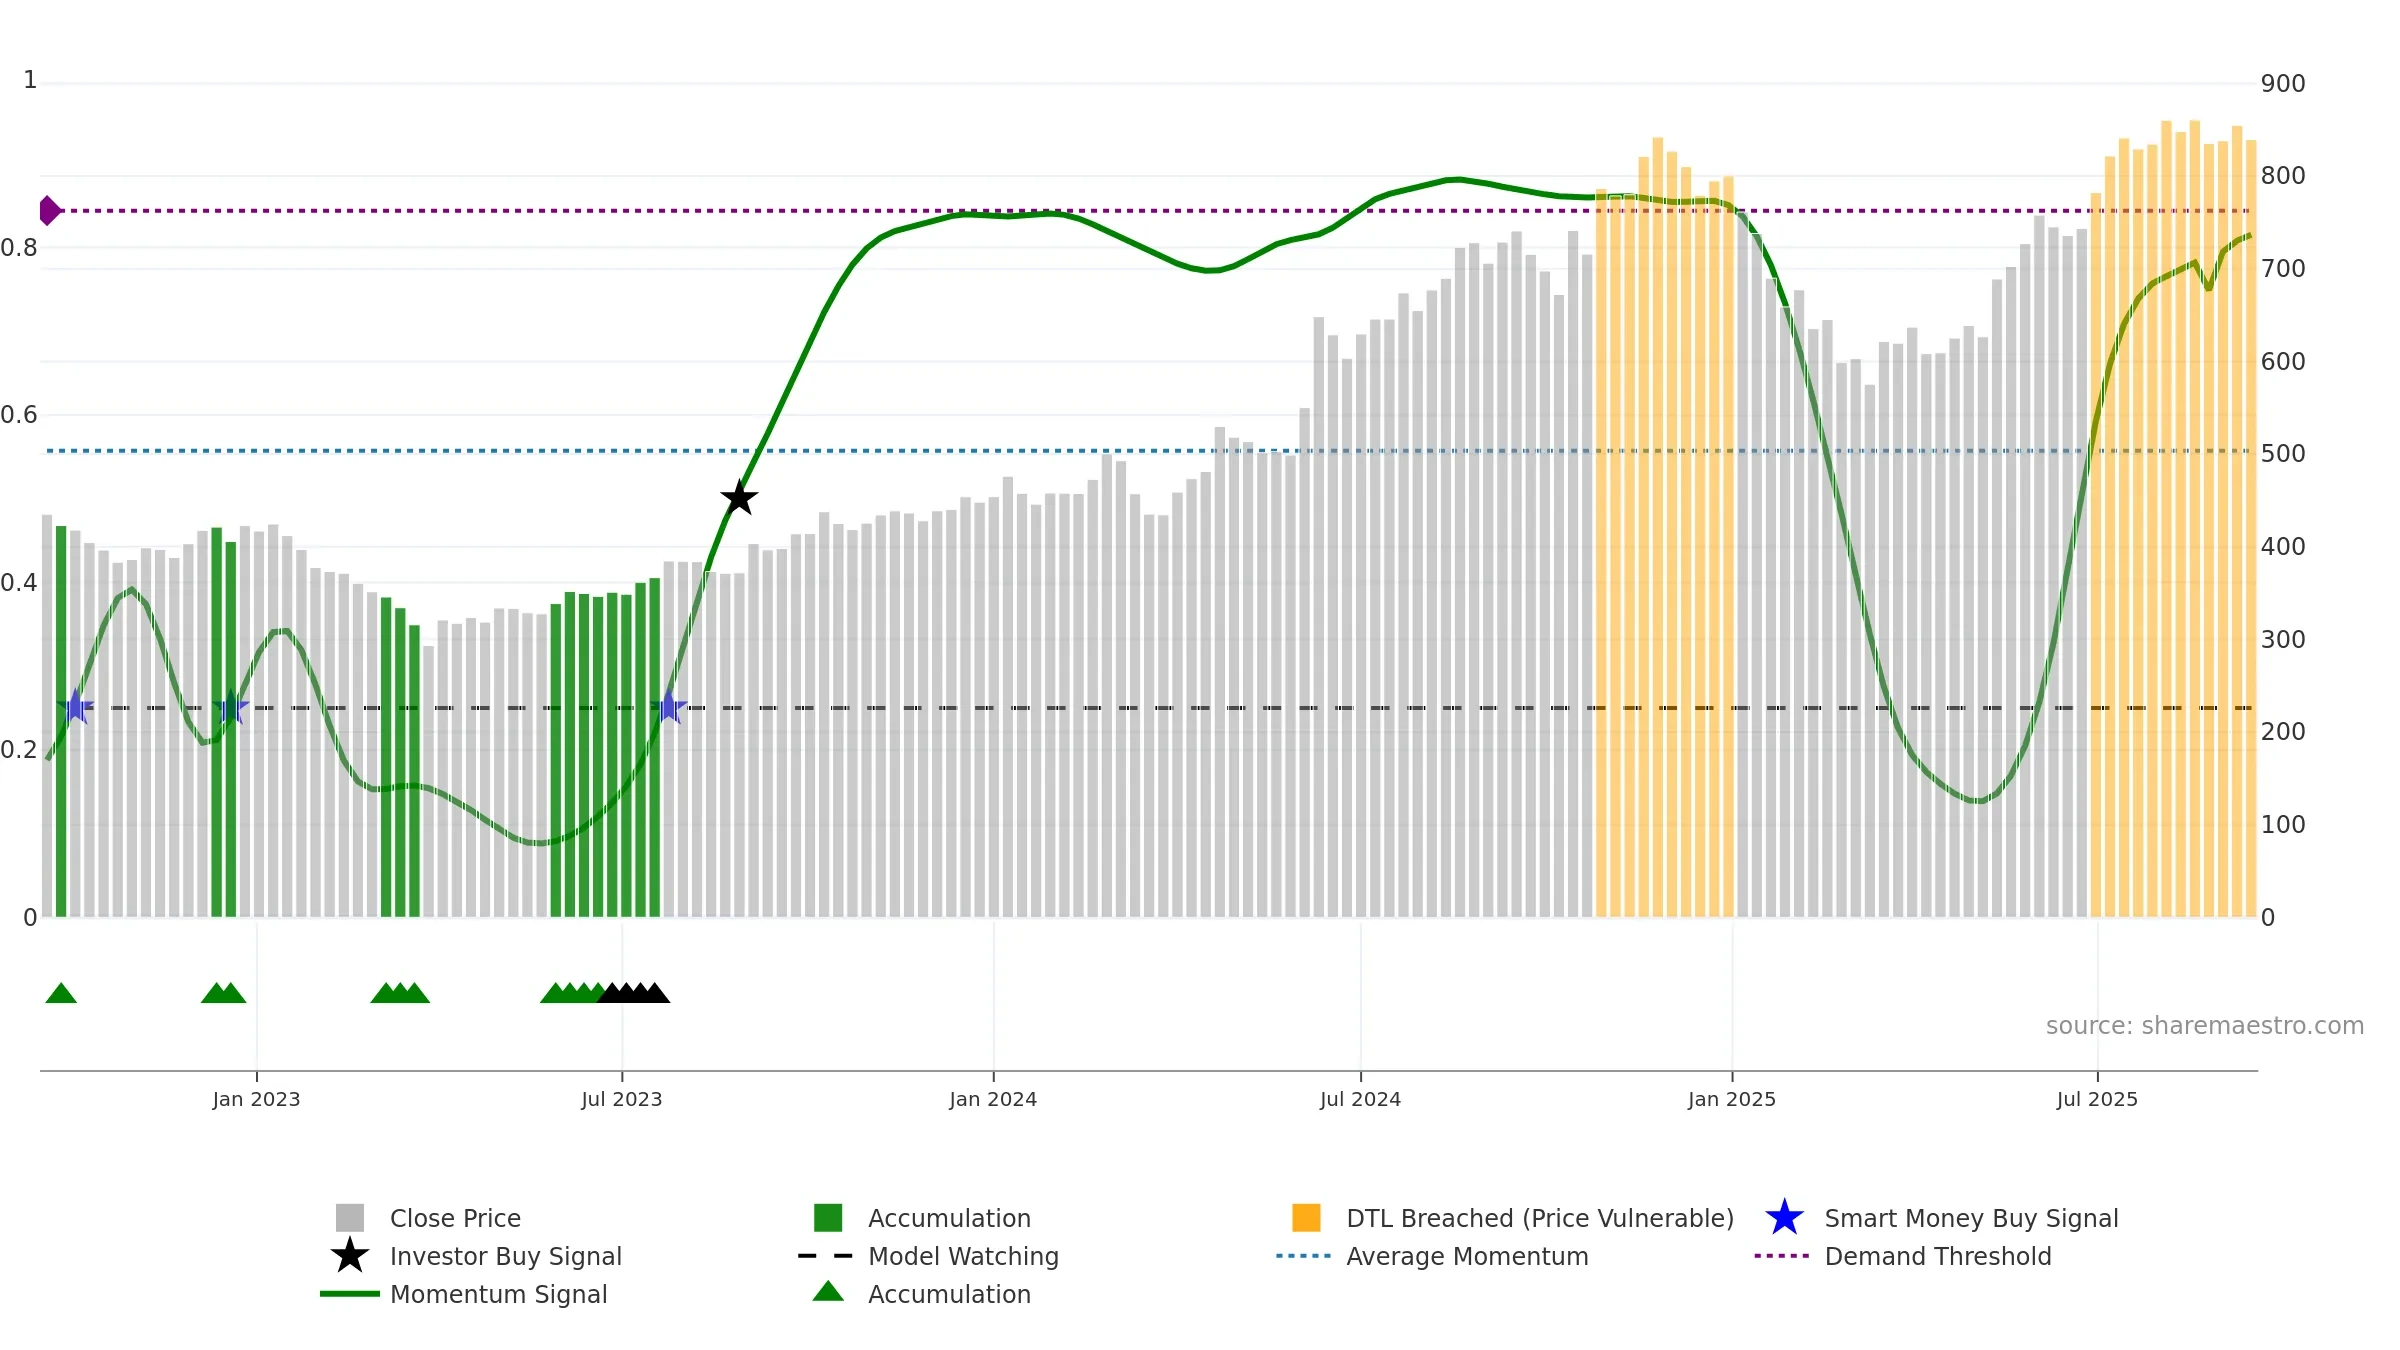
Weekly Report
Aditya Birla Sun Life AMC Limited closed at 839.3500 (-1.01% WoW) . Data window ends Mon, 15 Sep 2025.
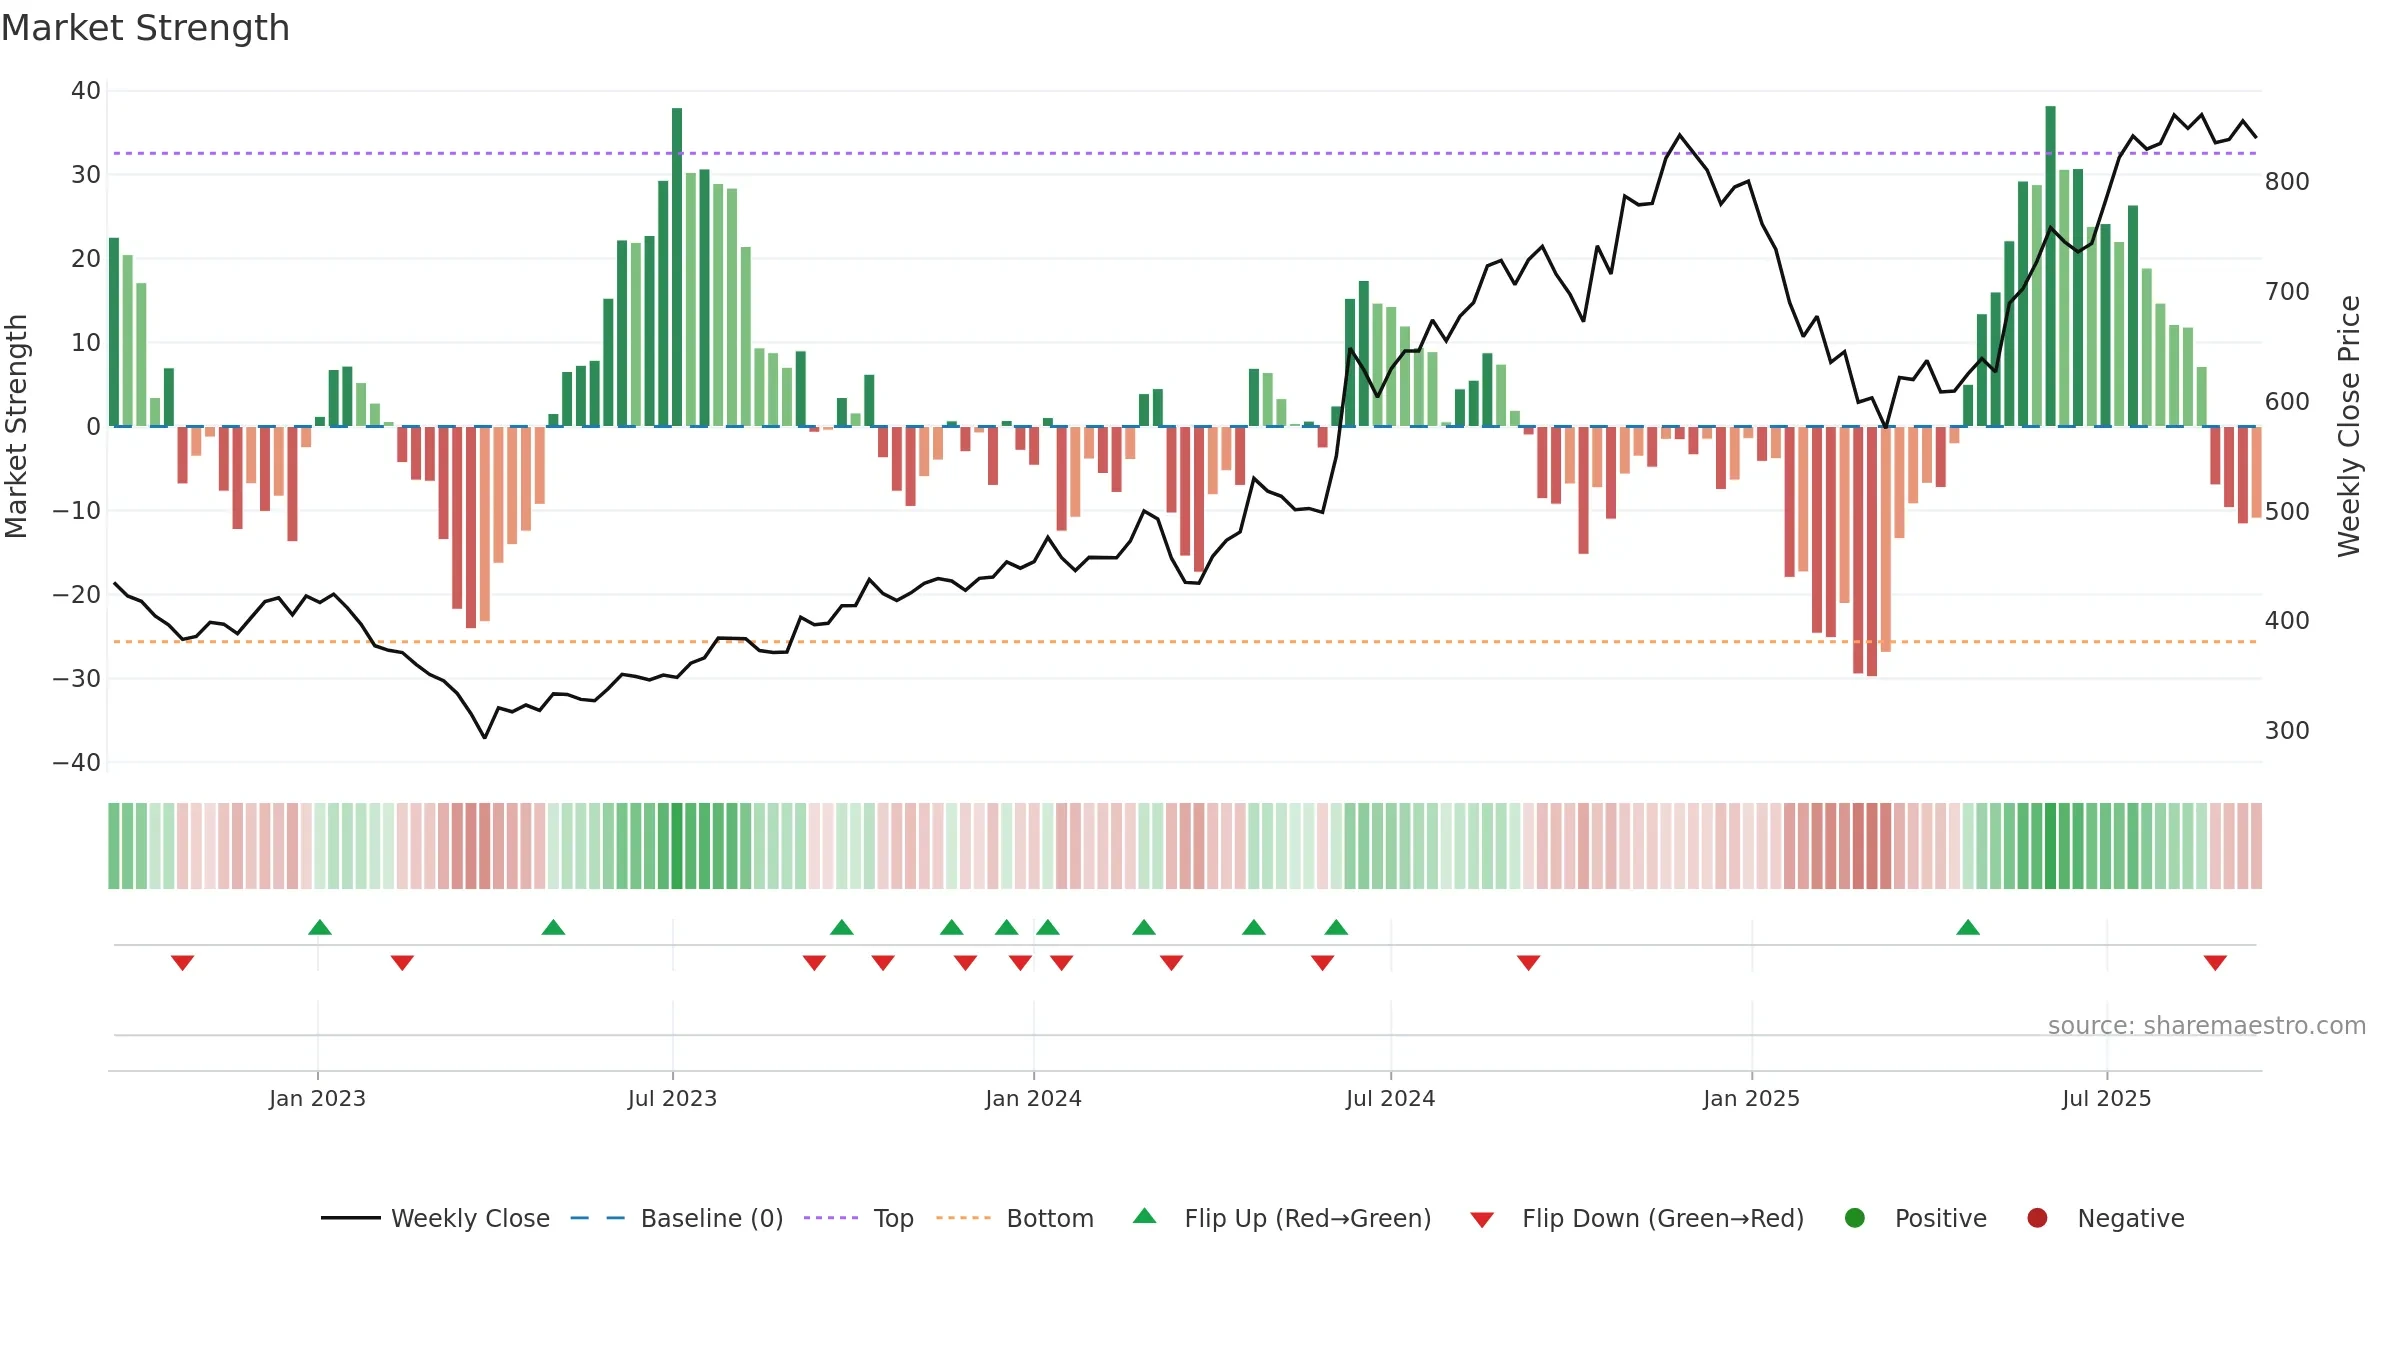
How to read this — Price slope is downward, indicating persistent supply pressure. Volume and price are moving in the same direction — a constructive confirmation. Returns are negatively correlated with volume — strength may come on lighter activity. Distance to baseline is narrowing — reverting closer to its fair-value track. Fresh short-term downside crossover weakens near-term tone.
Down-slope argues for patience; rallies can fade sooner unless participation improves.
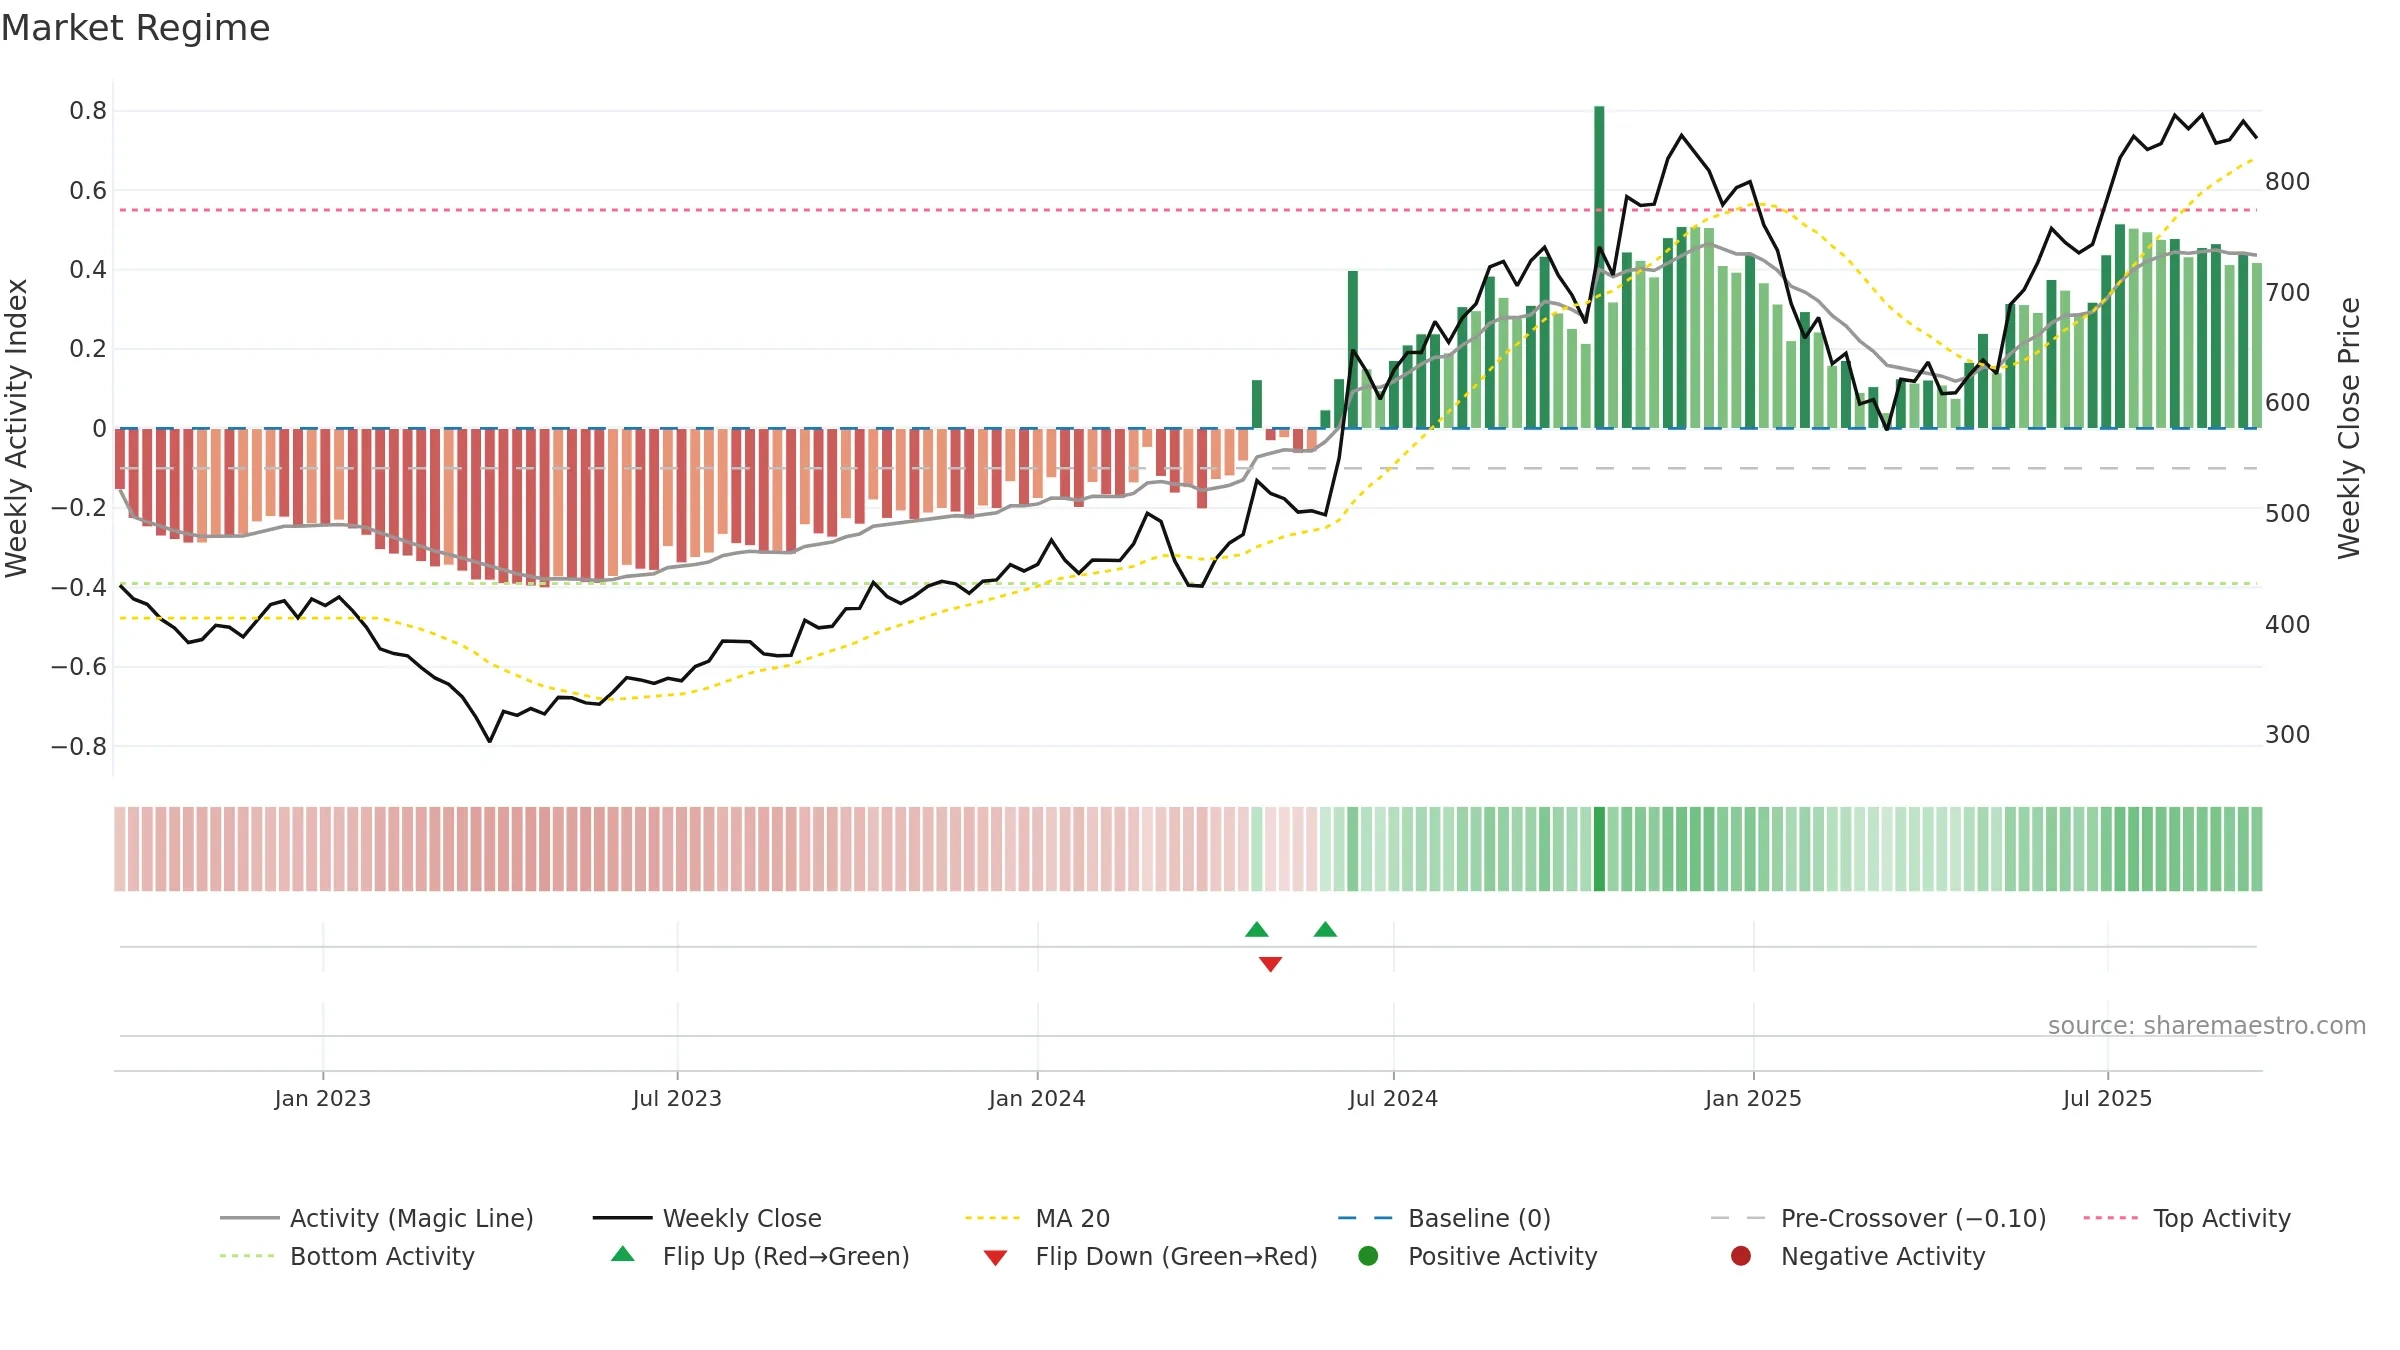
Gauge maps the trend signal to a 0–100 scale.
How to read this — High gauge and rising momentum — buyers in control.
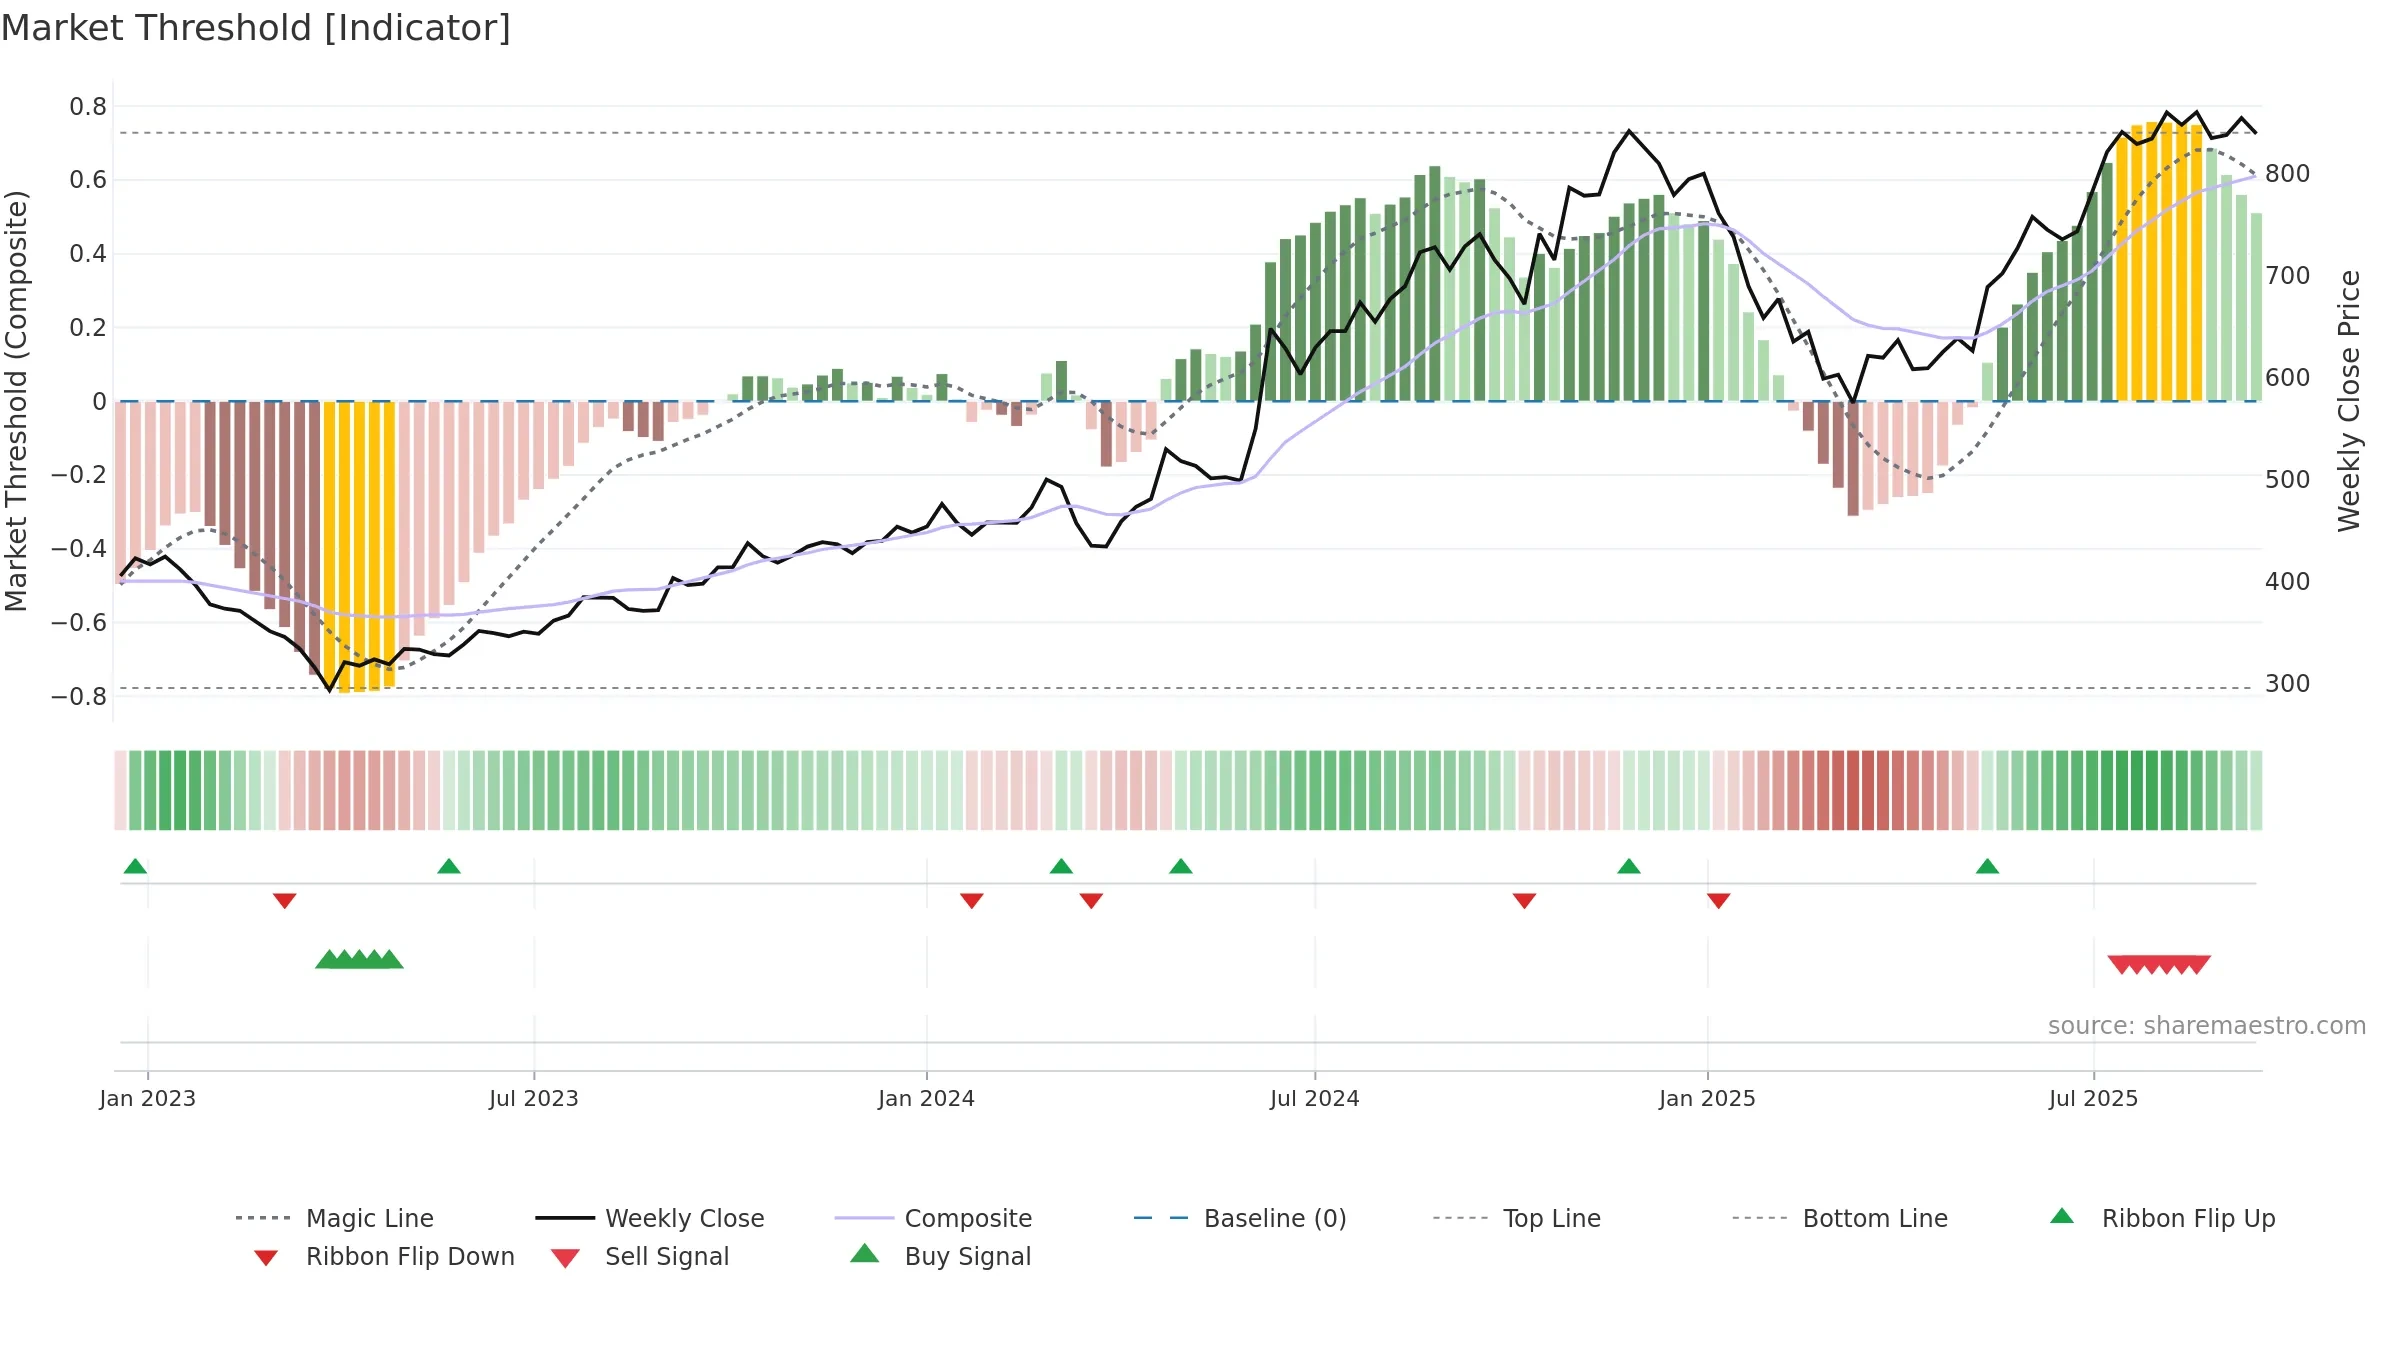
Bias remains higher; pullbacks could be buyable if participation holds.
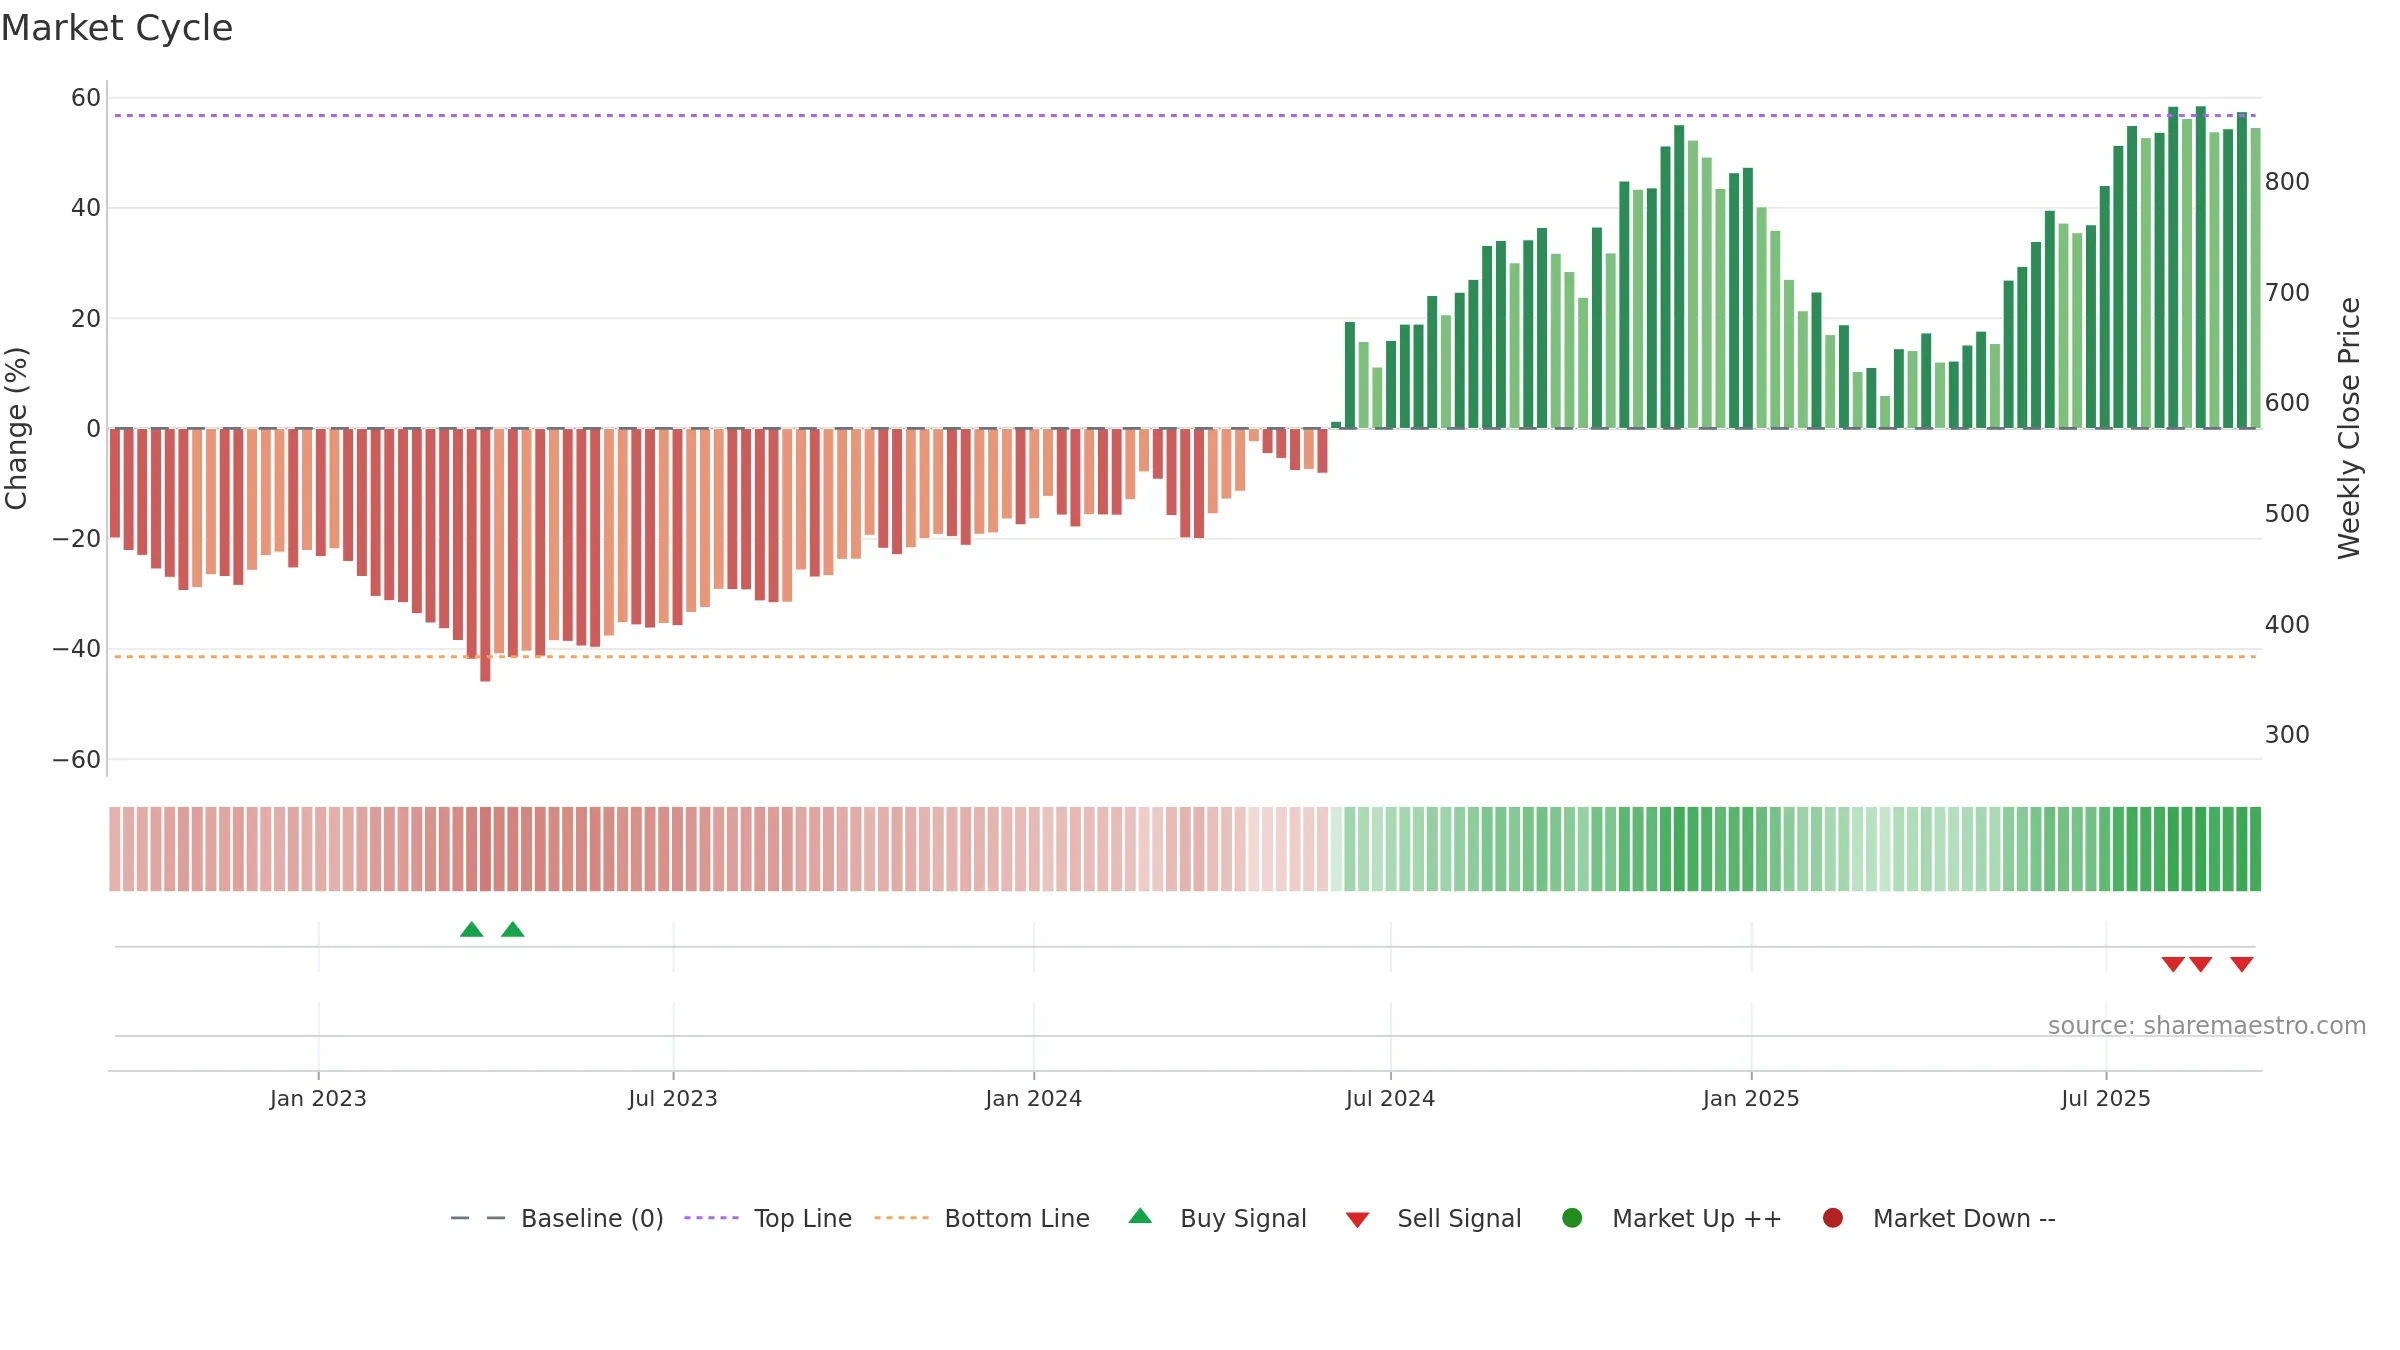
The flag is positive: favourable upside skew with supportive conditions.
Conclusion
Positive setup. ★★★★☆ confidence. Price window: 0. Trend: Strong Uptrend; gauge 81. In combination, liquidity confirms the move.
- High gauge with rising momentum (strong uptrend)
- Momentum is bullish and rising
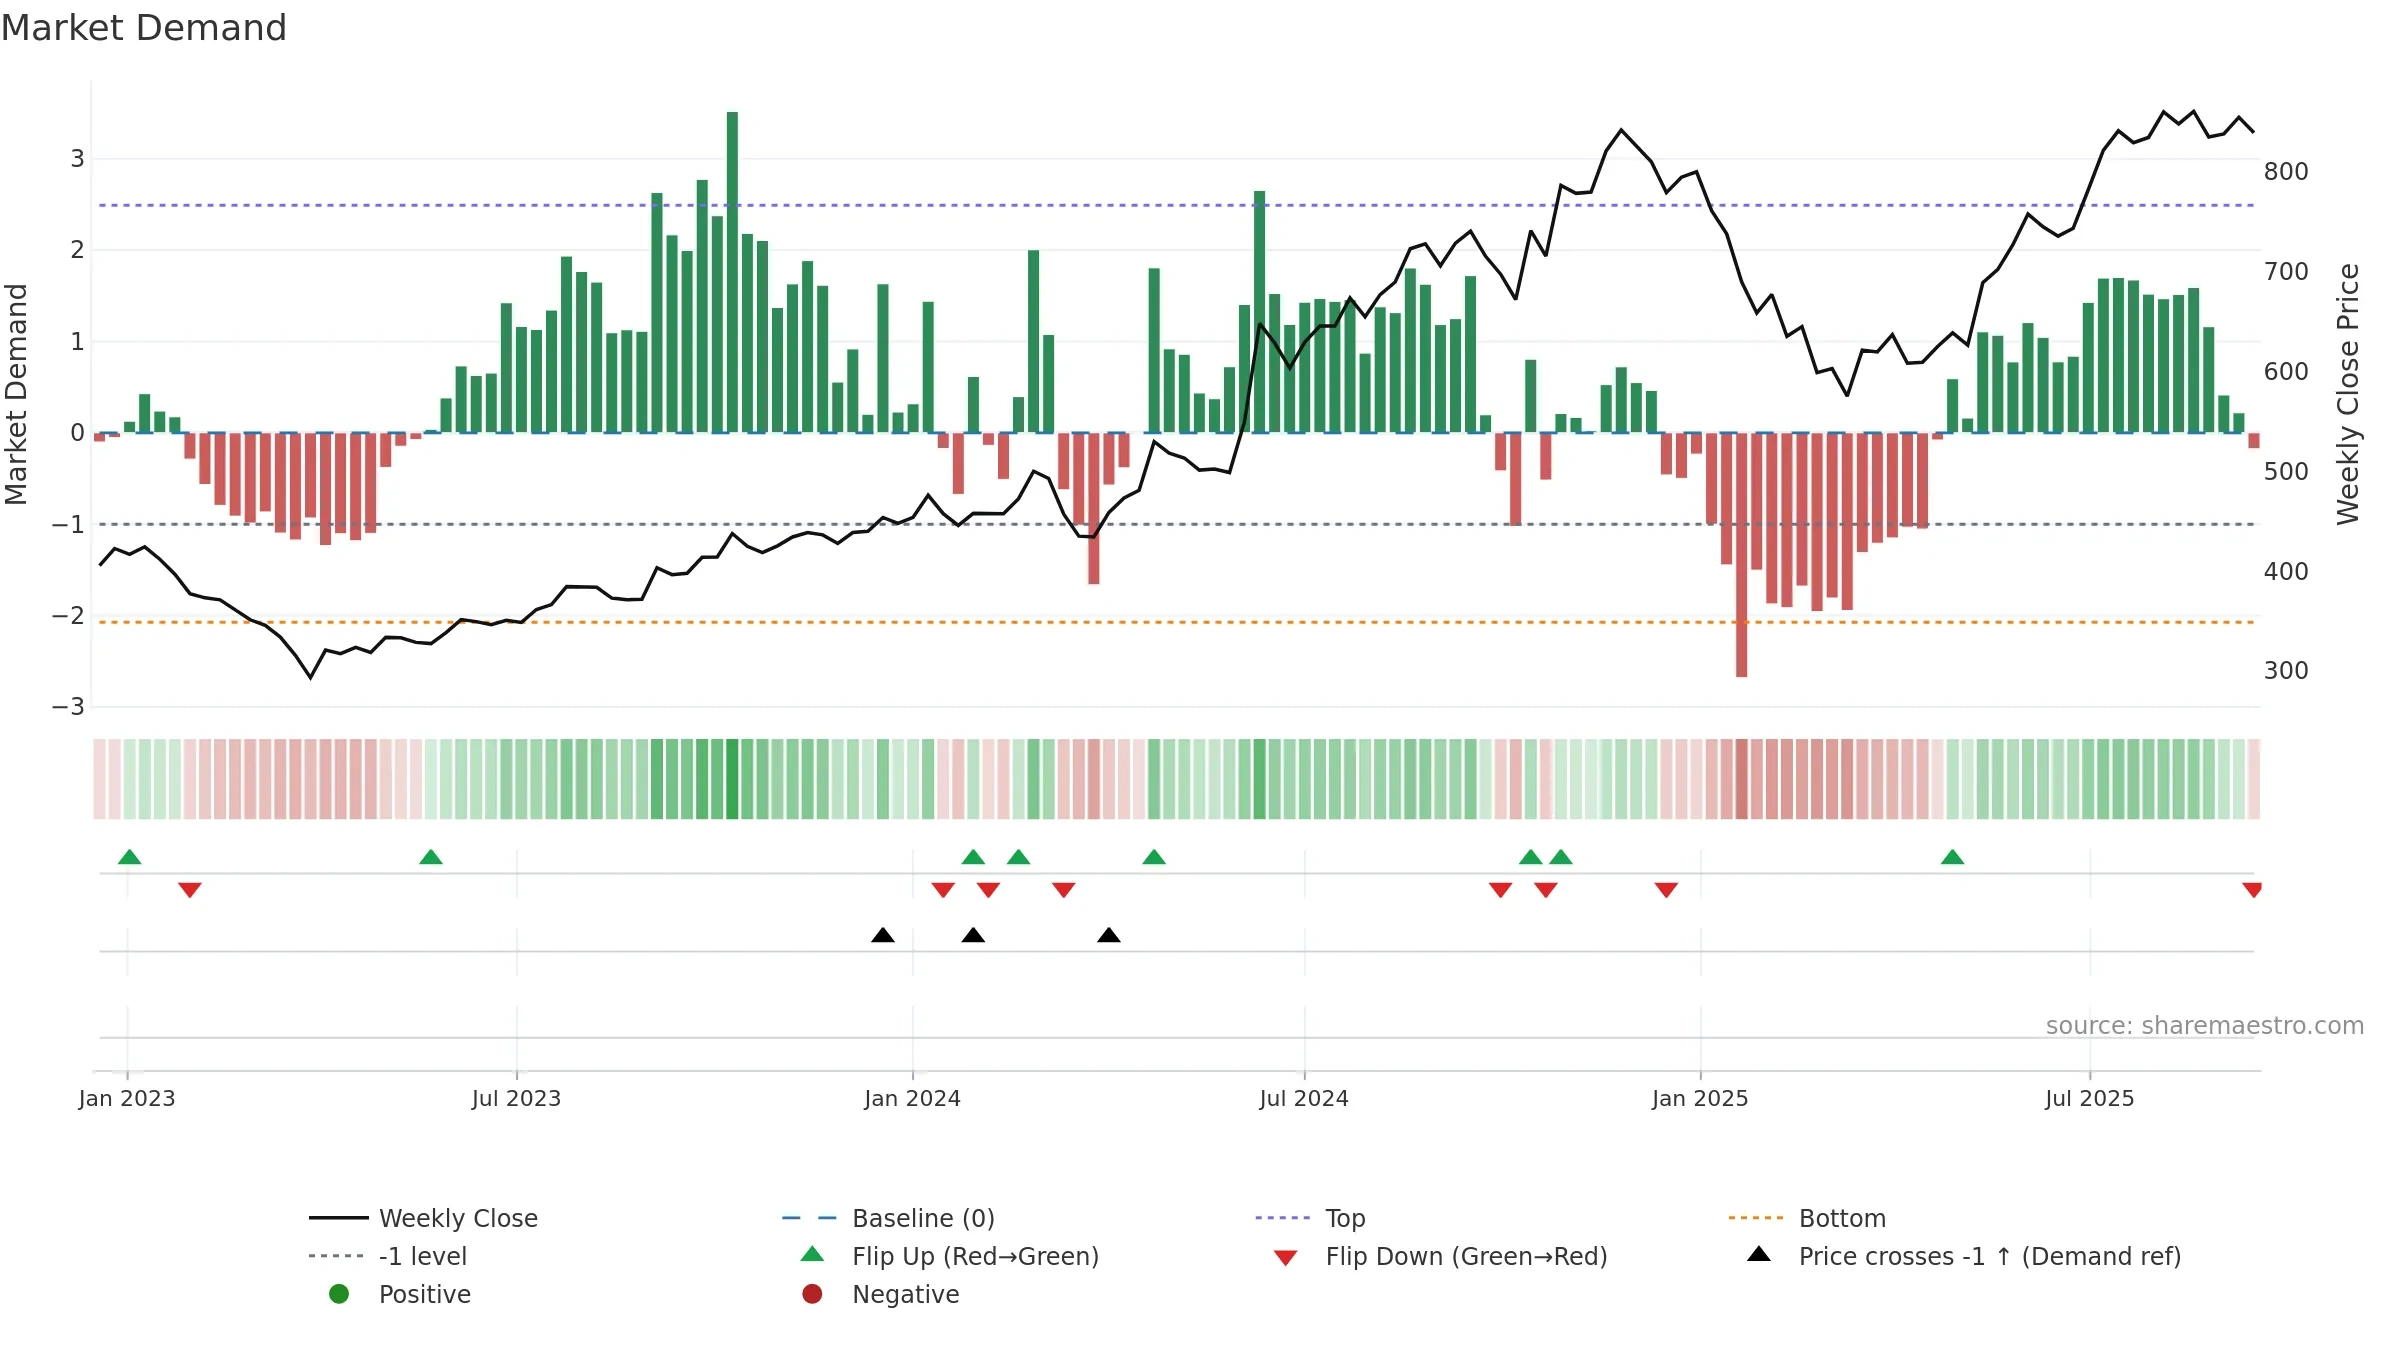
- Liquidity confirms the price trend
- Price is not above key averages
Why: Price window 0.57% over 8w. Close is -2.47% below the prior-window high. Volume trend falling. Liquidity convergence with price. Trend state strong uptrend. 4–8w crossover bearish. Momentum bullish and rising. Valuation stance positive.
Tip: Most metrics include a hover tooltip where they appear in the report.