ACADIA Pharmaceuticals Inc.
ACAD NASDAQ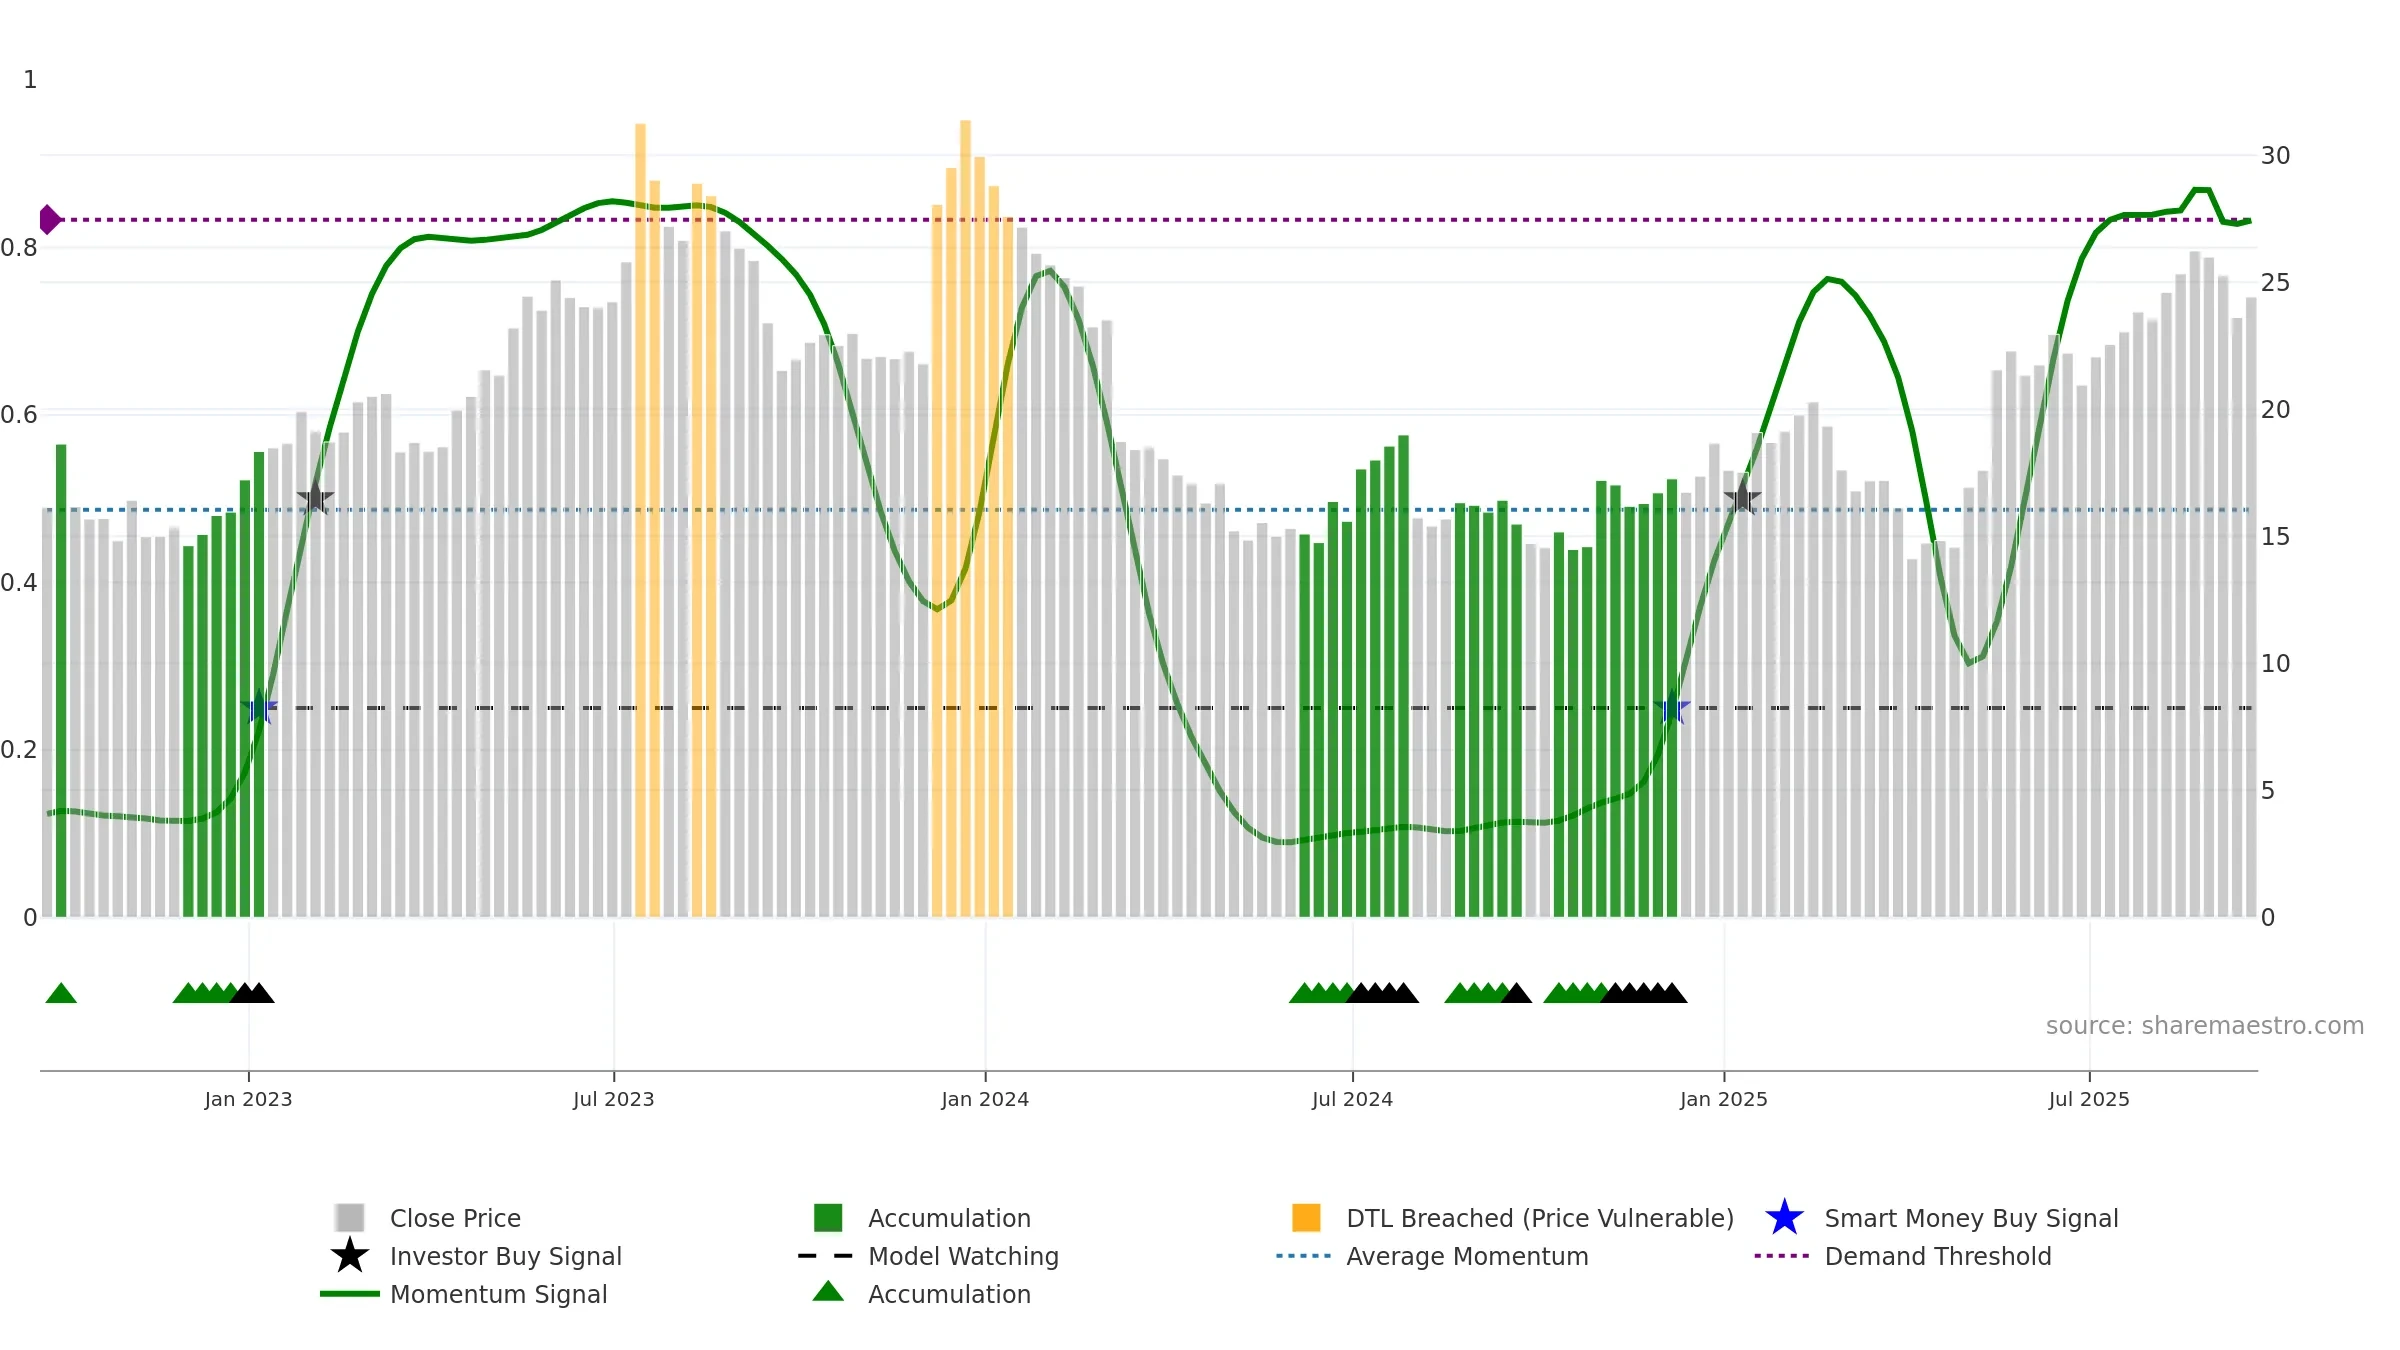
Weekly Report
ACADIA Pharmaceuticals Inc. closed at 24.4200 (-1.05% WoW) . Data window ends Fri, 19 Sep 2025.
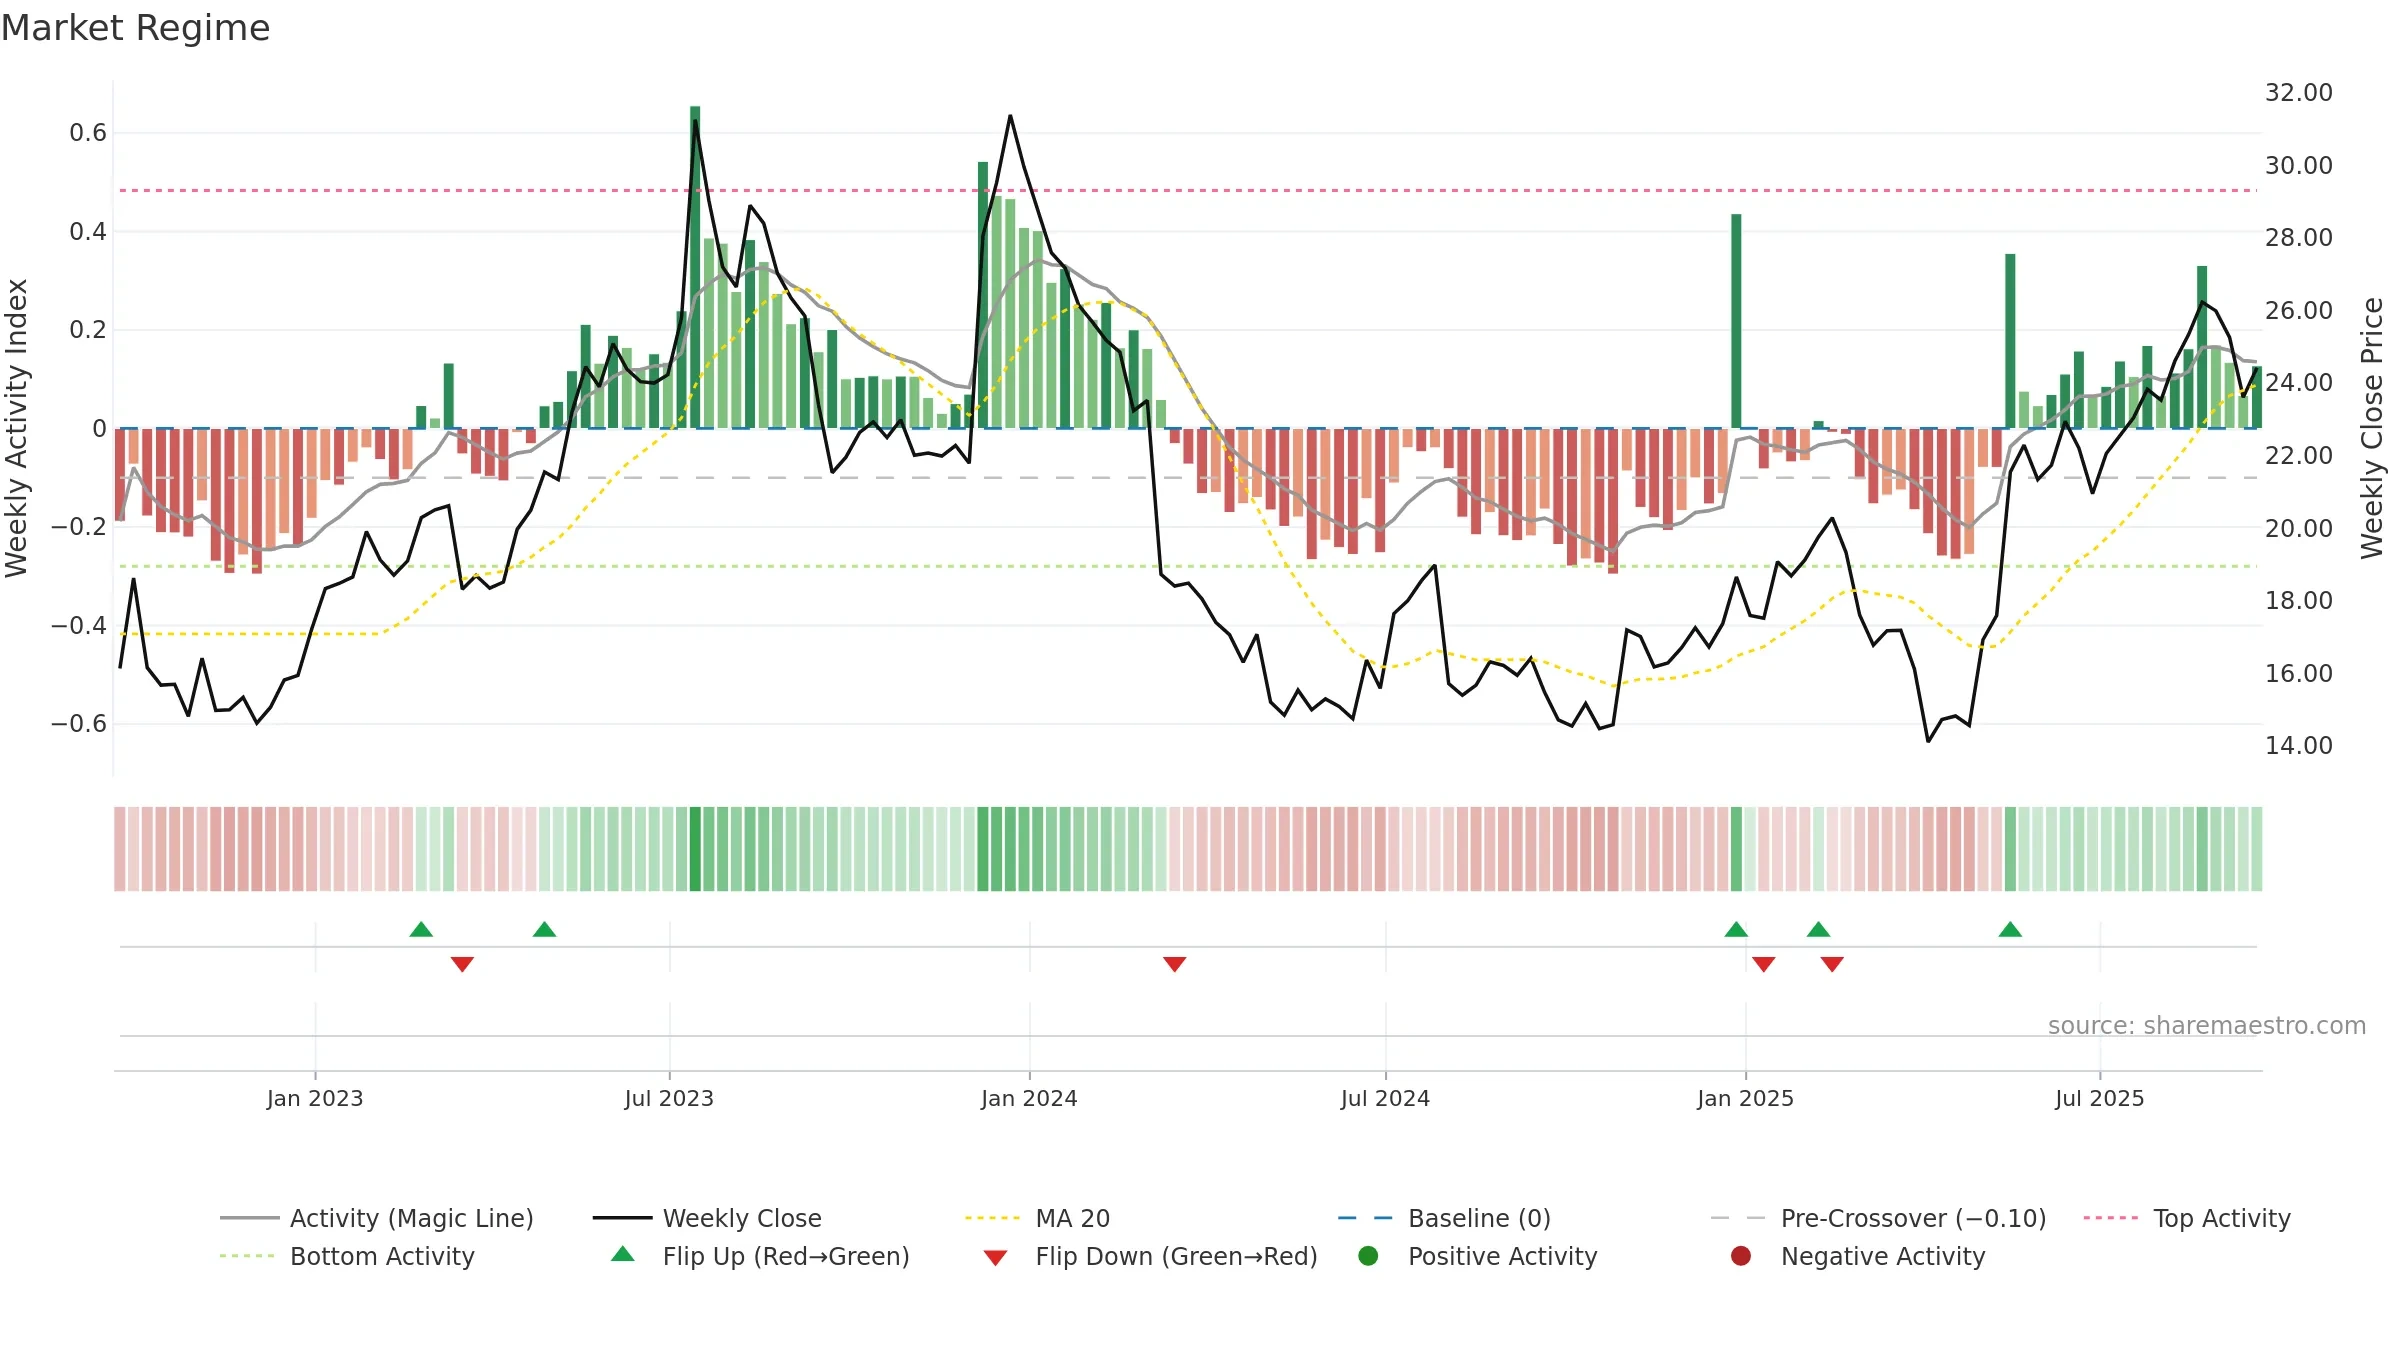
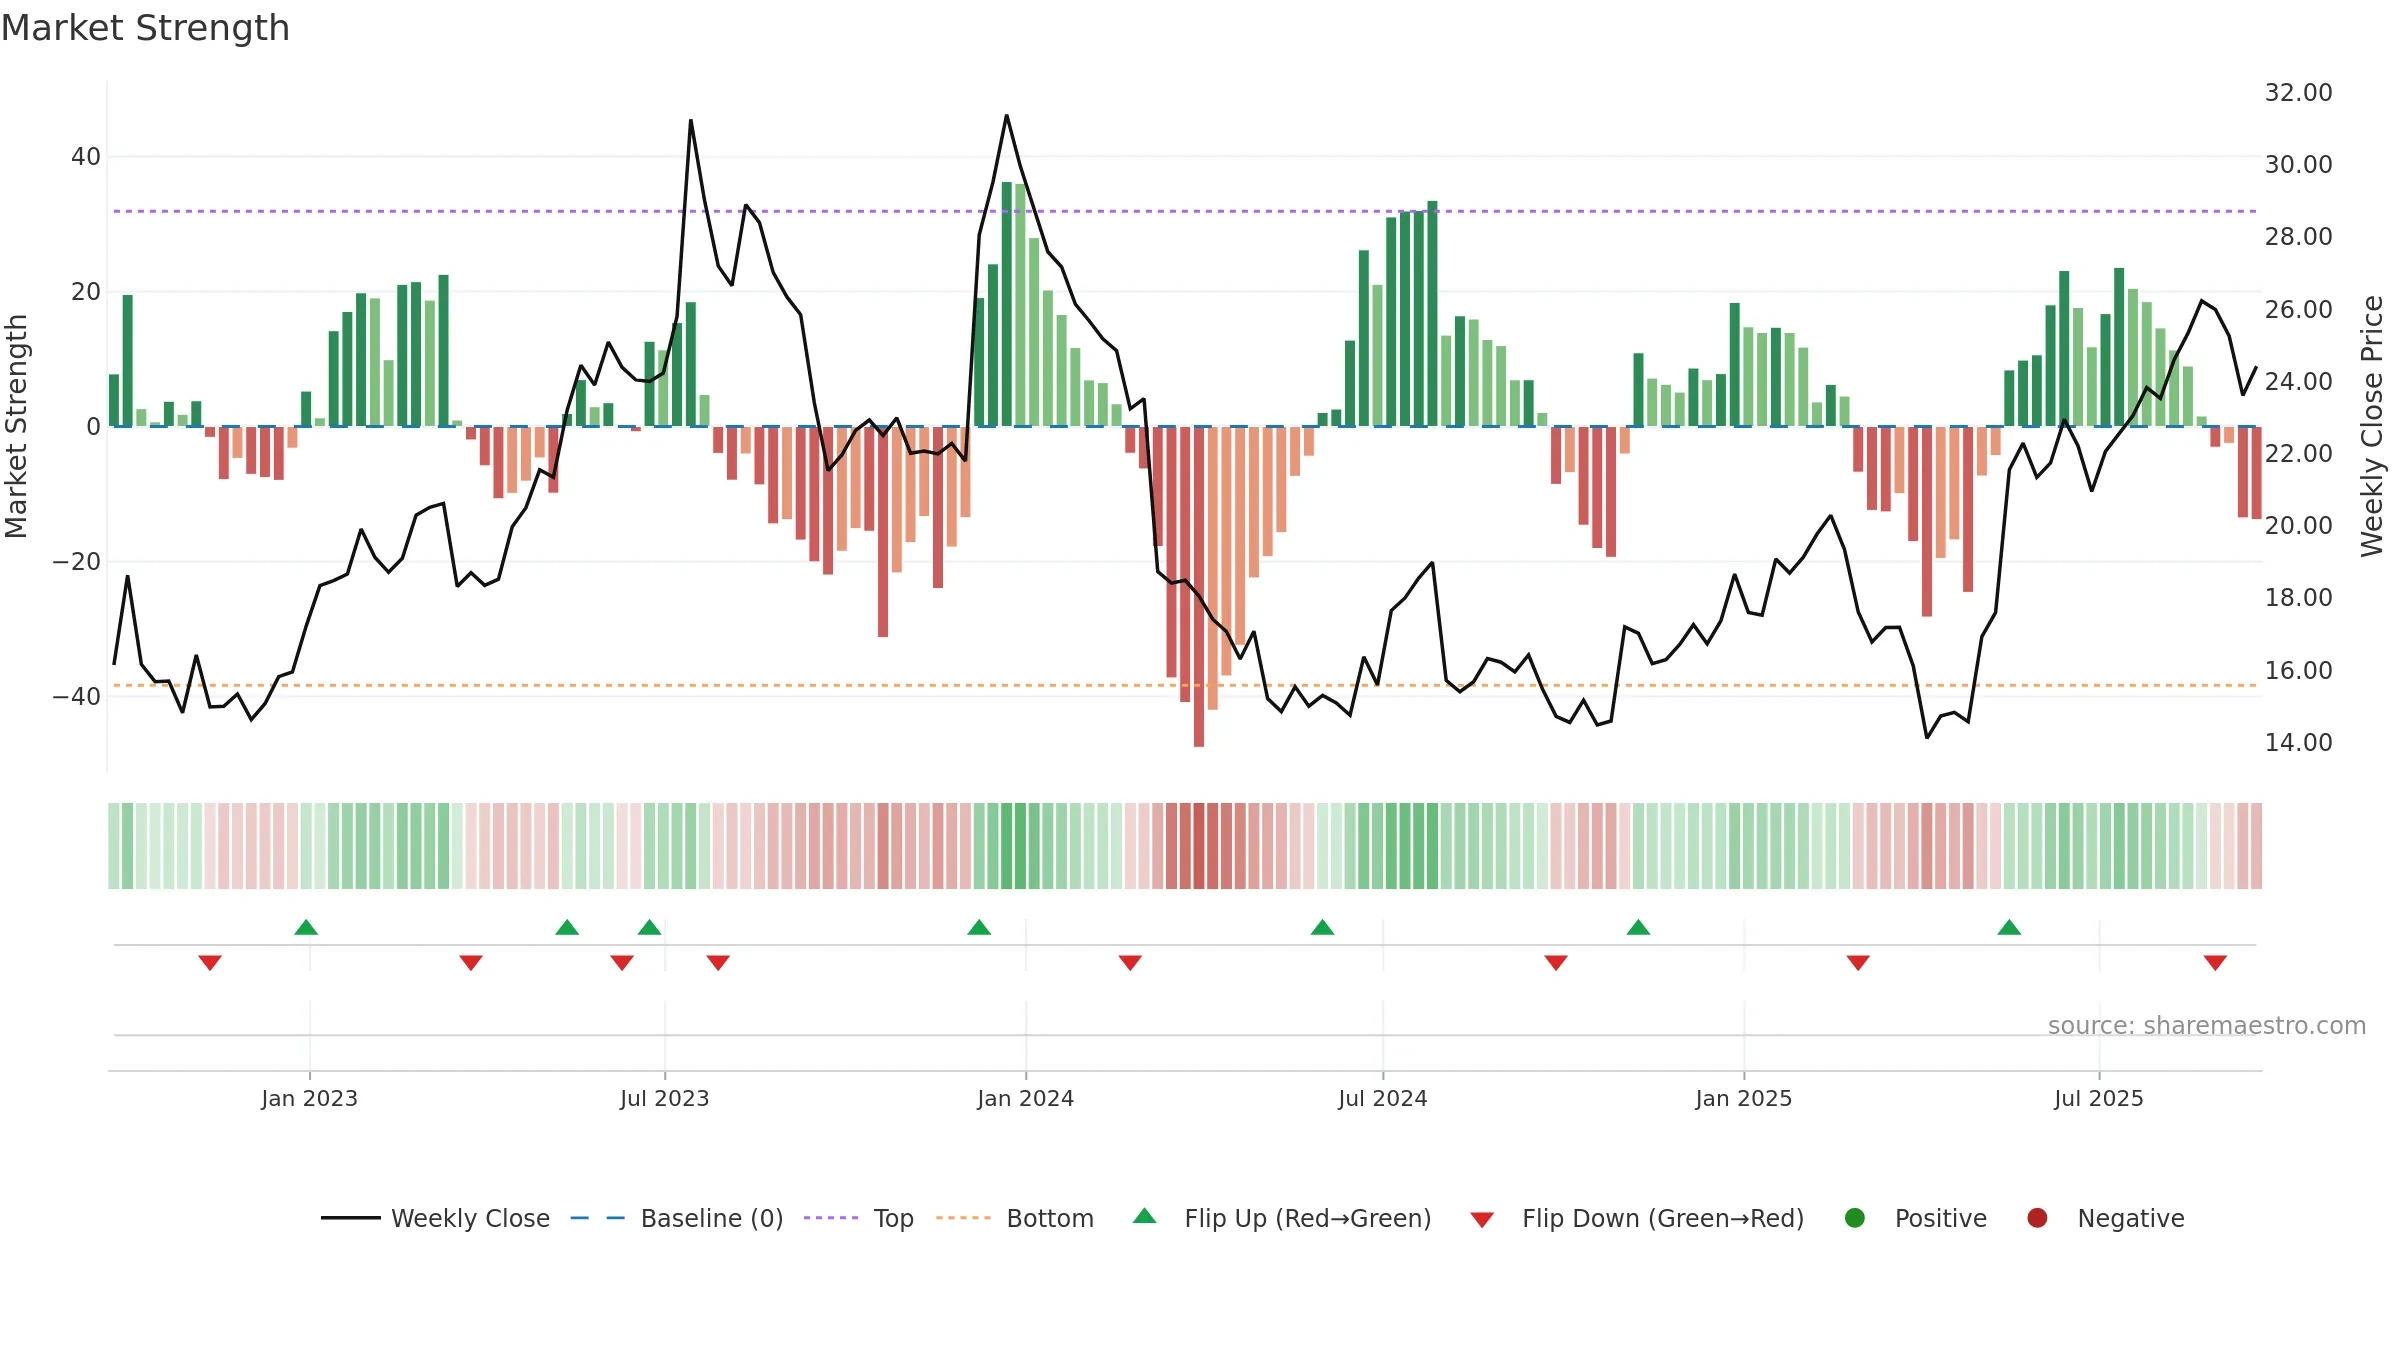
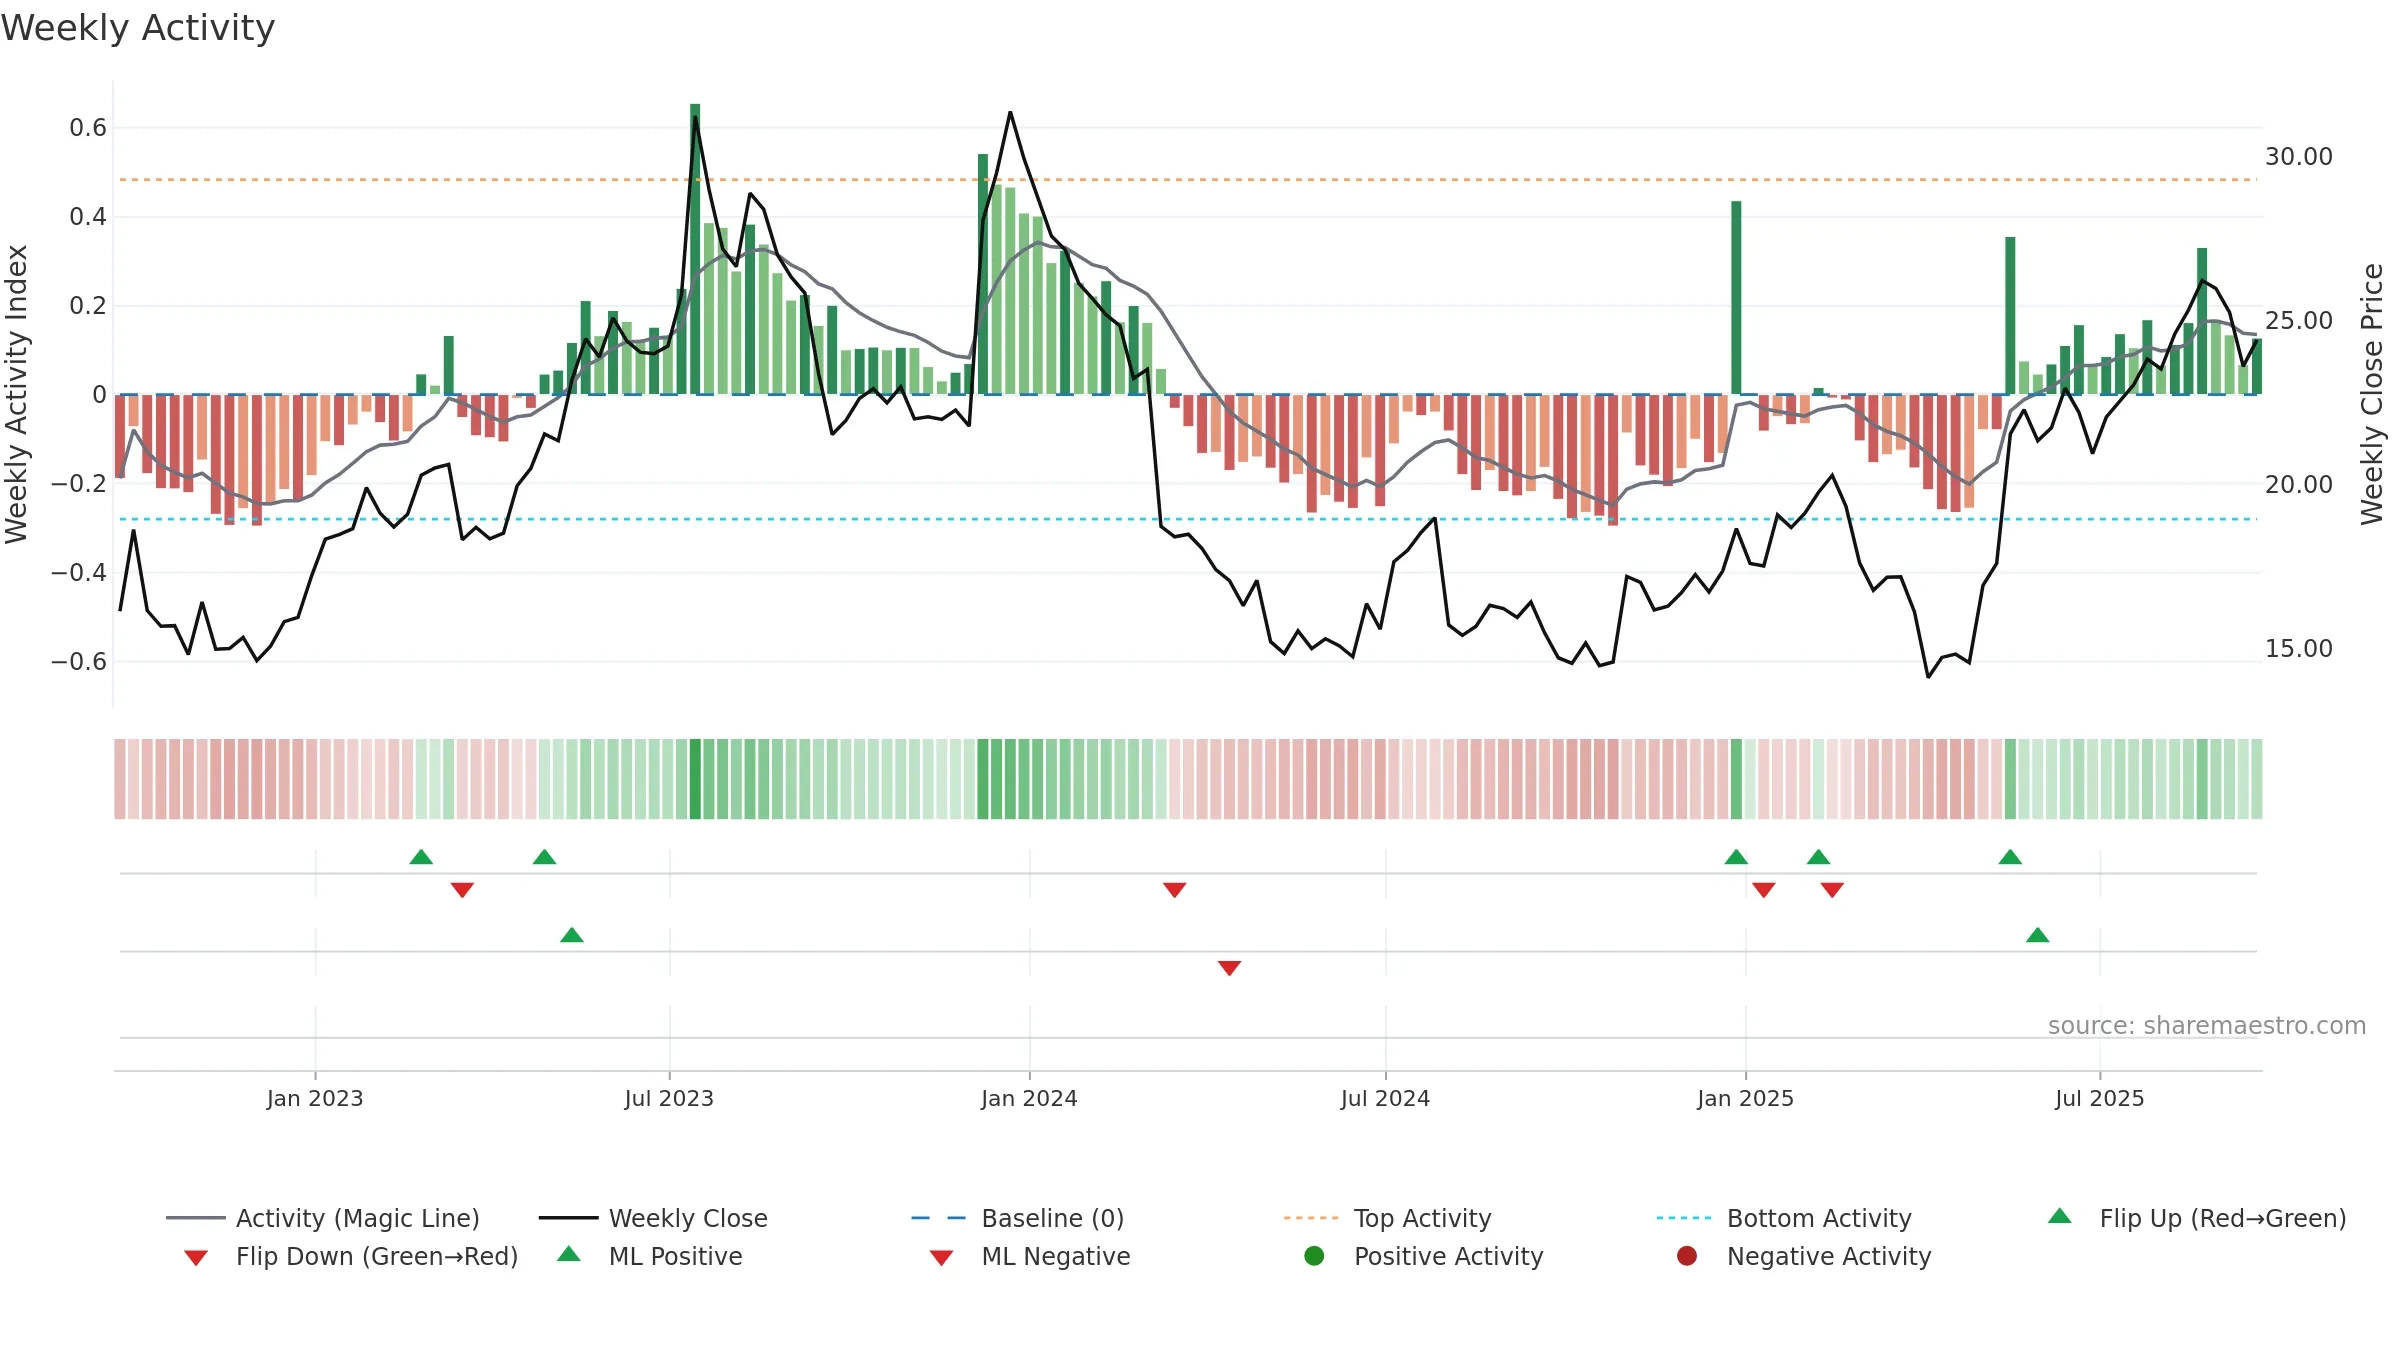
How to read this — Price slope is upward, indicating persistent buying over the window. Volume trend diverges from price — watch for fatigue or rotation. Returns are positively correlated with volume — strength tends to arrive on higher activity. Fresh short-term downside crossover weakens near-term tone.
Up-slope supports buying interest; pullbacks may be contained if activity stays firm. Because liquidity isn’t confirming, prefer evidence of fresh demand before chasing moves.
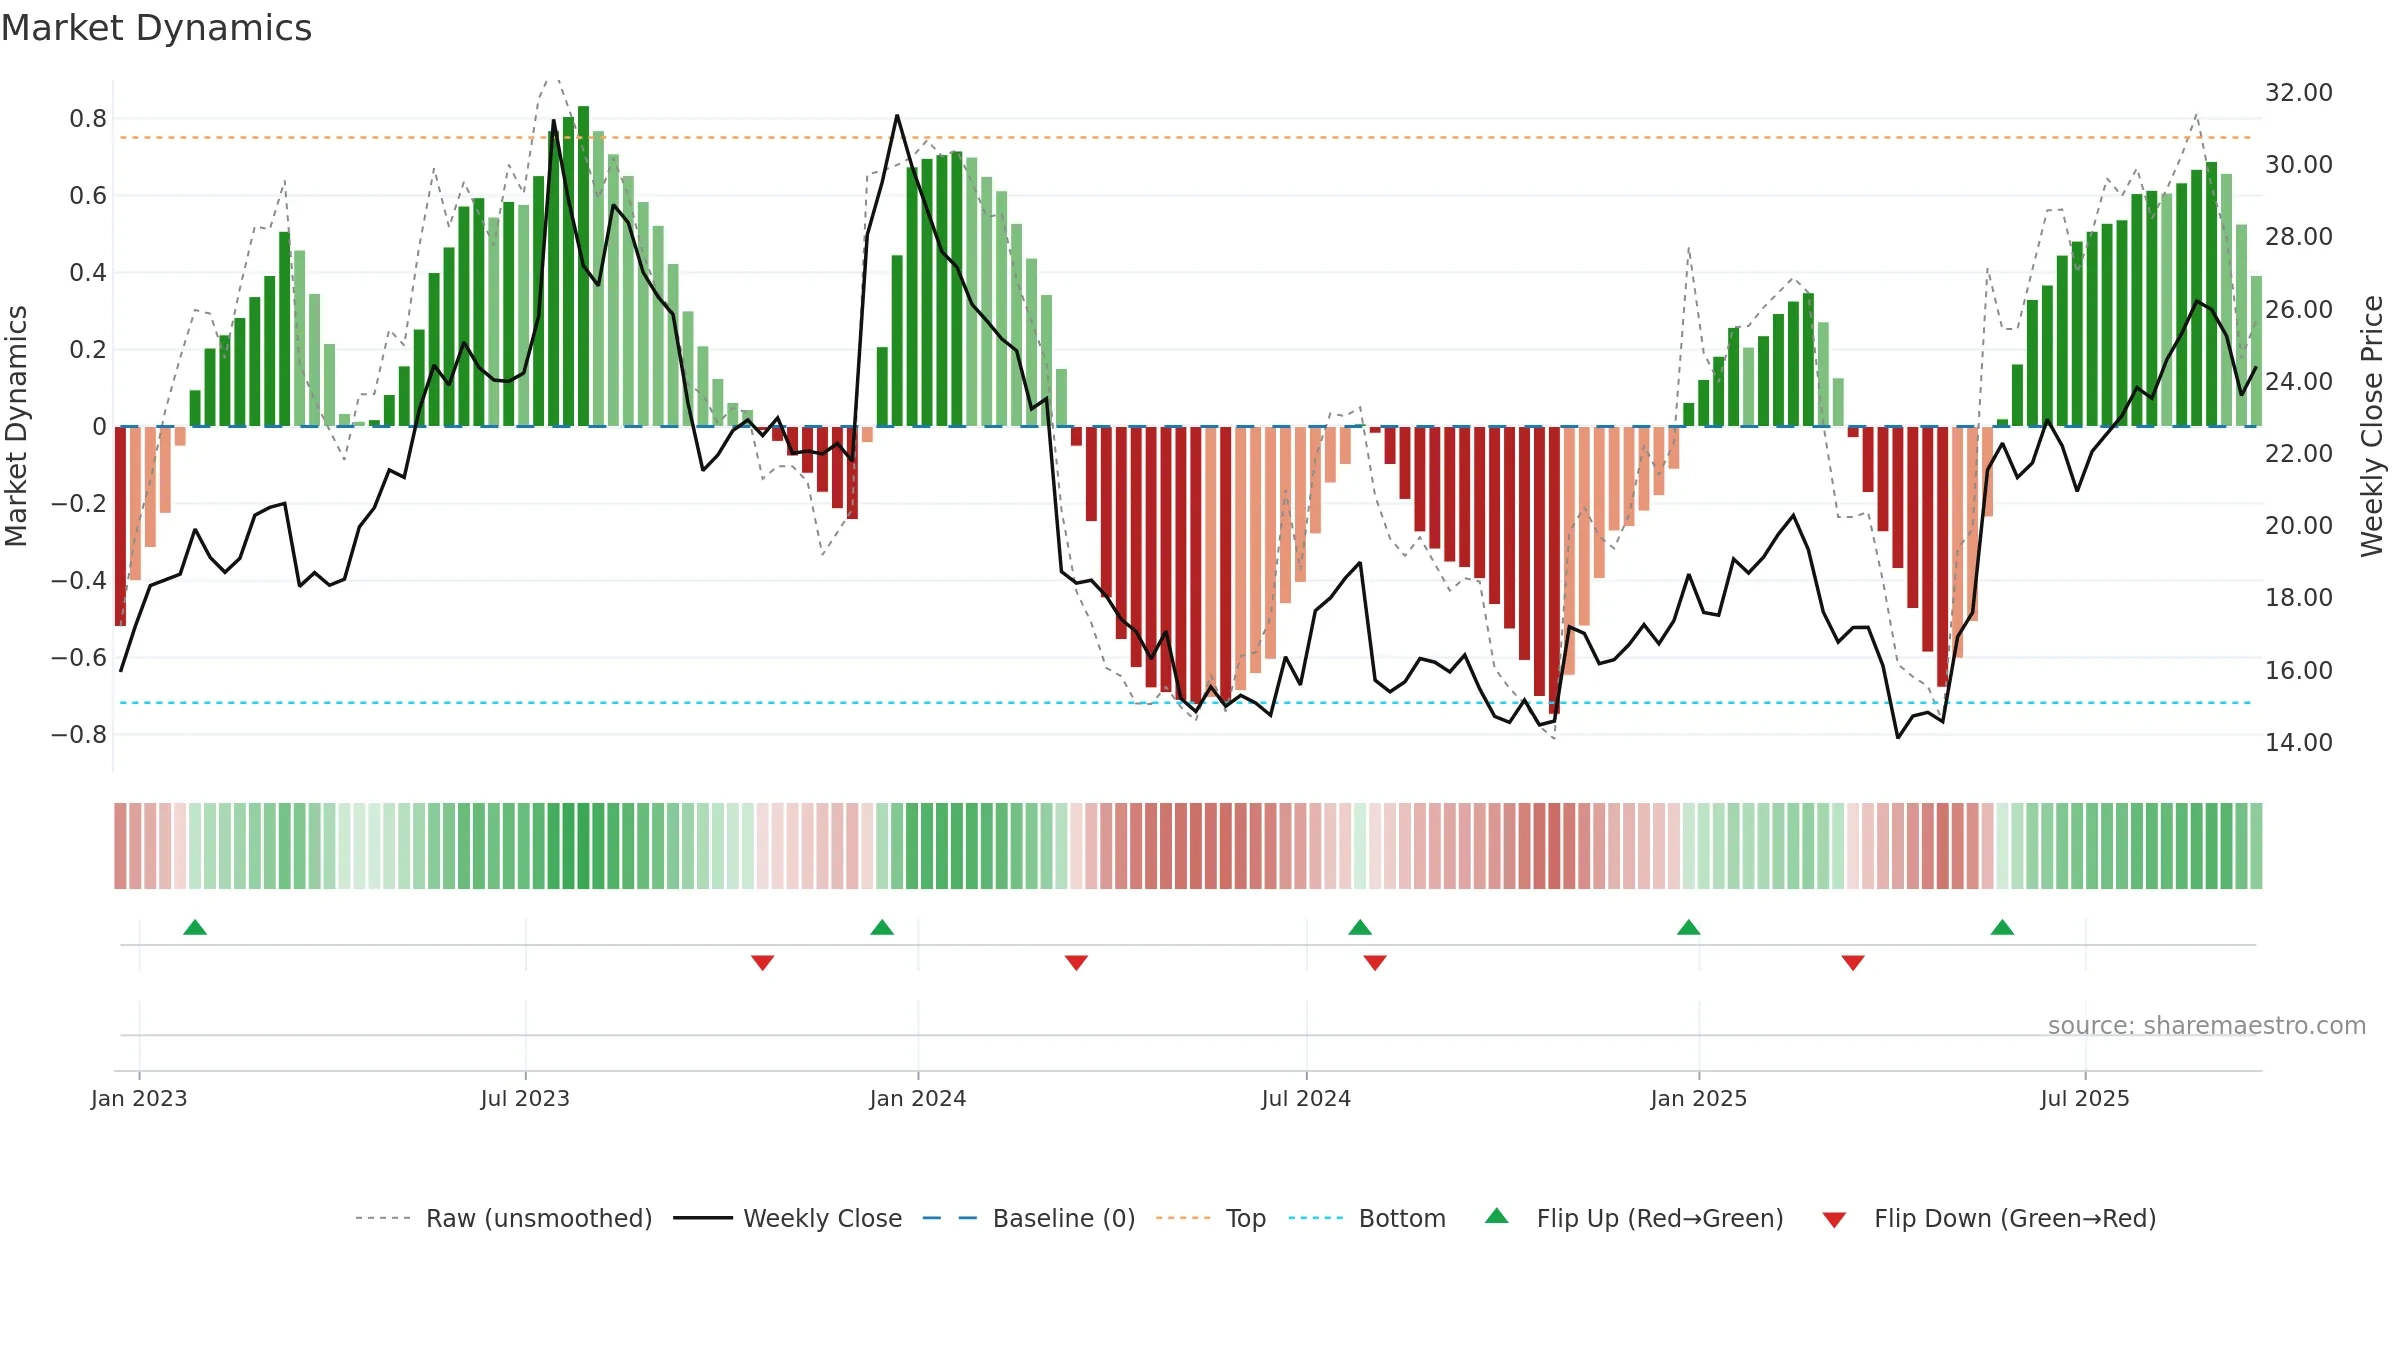
Gauge maps the trend signal to a 0–100 scale.
How to read this — Gauge is elevated but momentum is rolling over; topping risk is rising.
Stay alert: protect gains or seek confirmation before adding risk.
Price is above fair value; upside may be capped without catalysts.
Conclusion
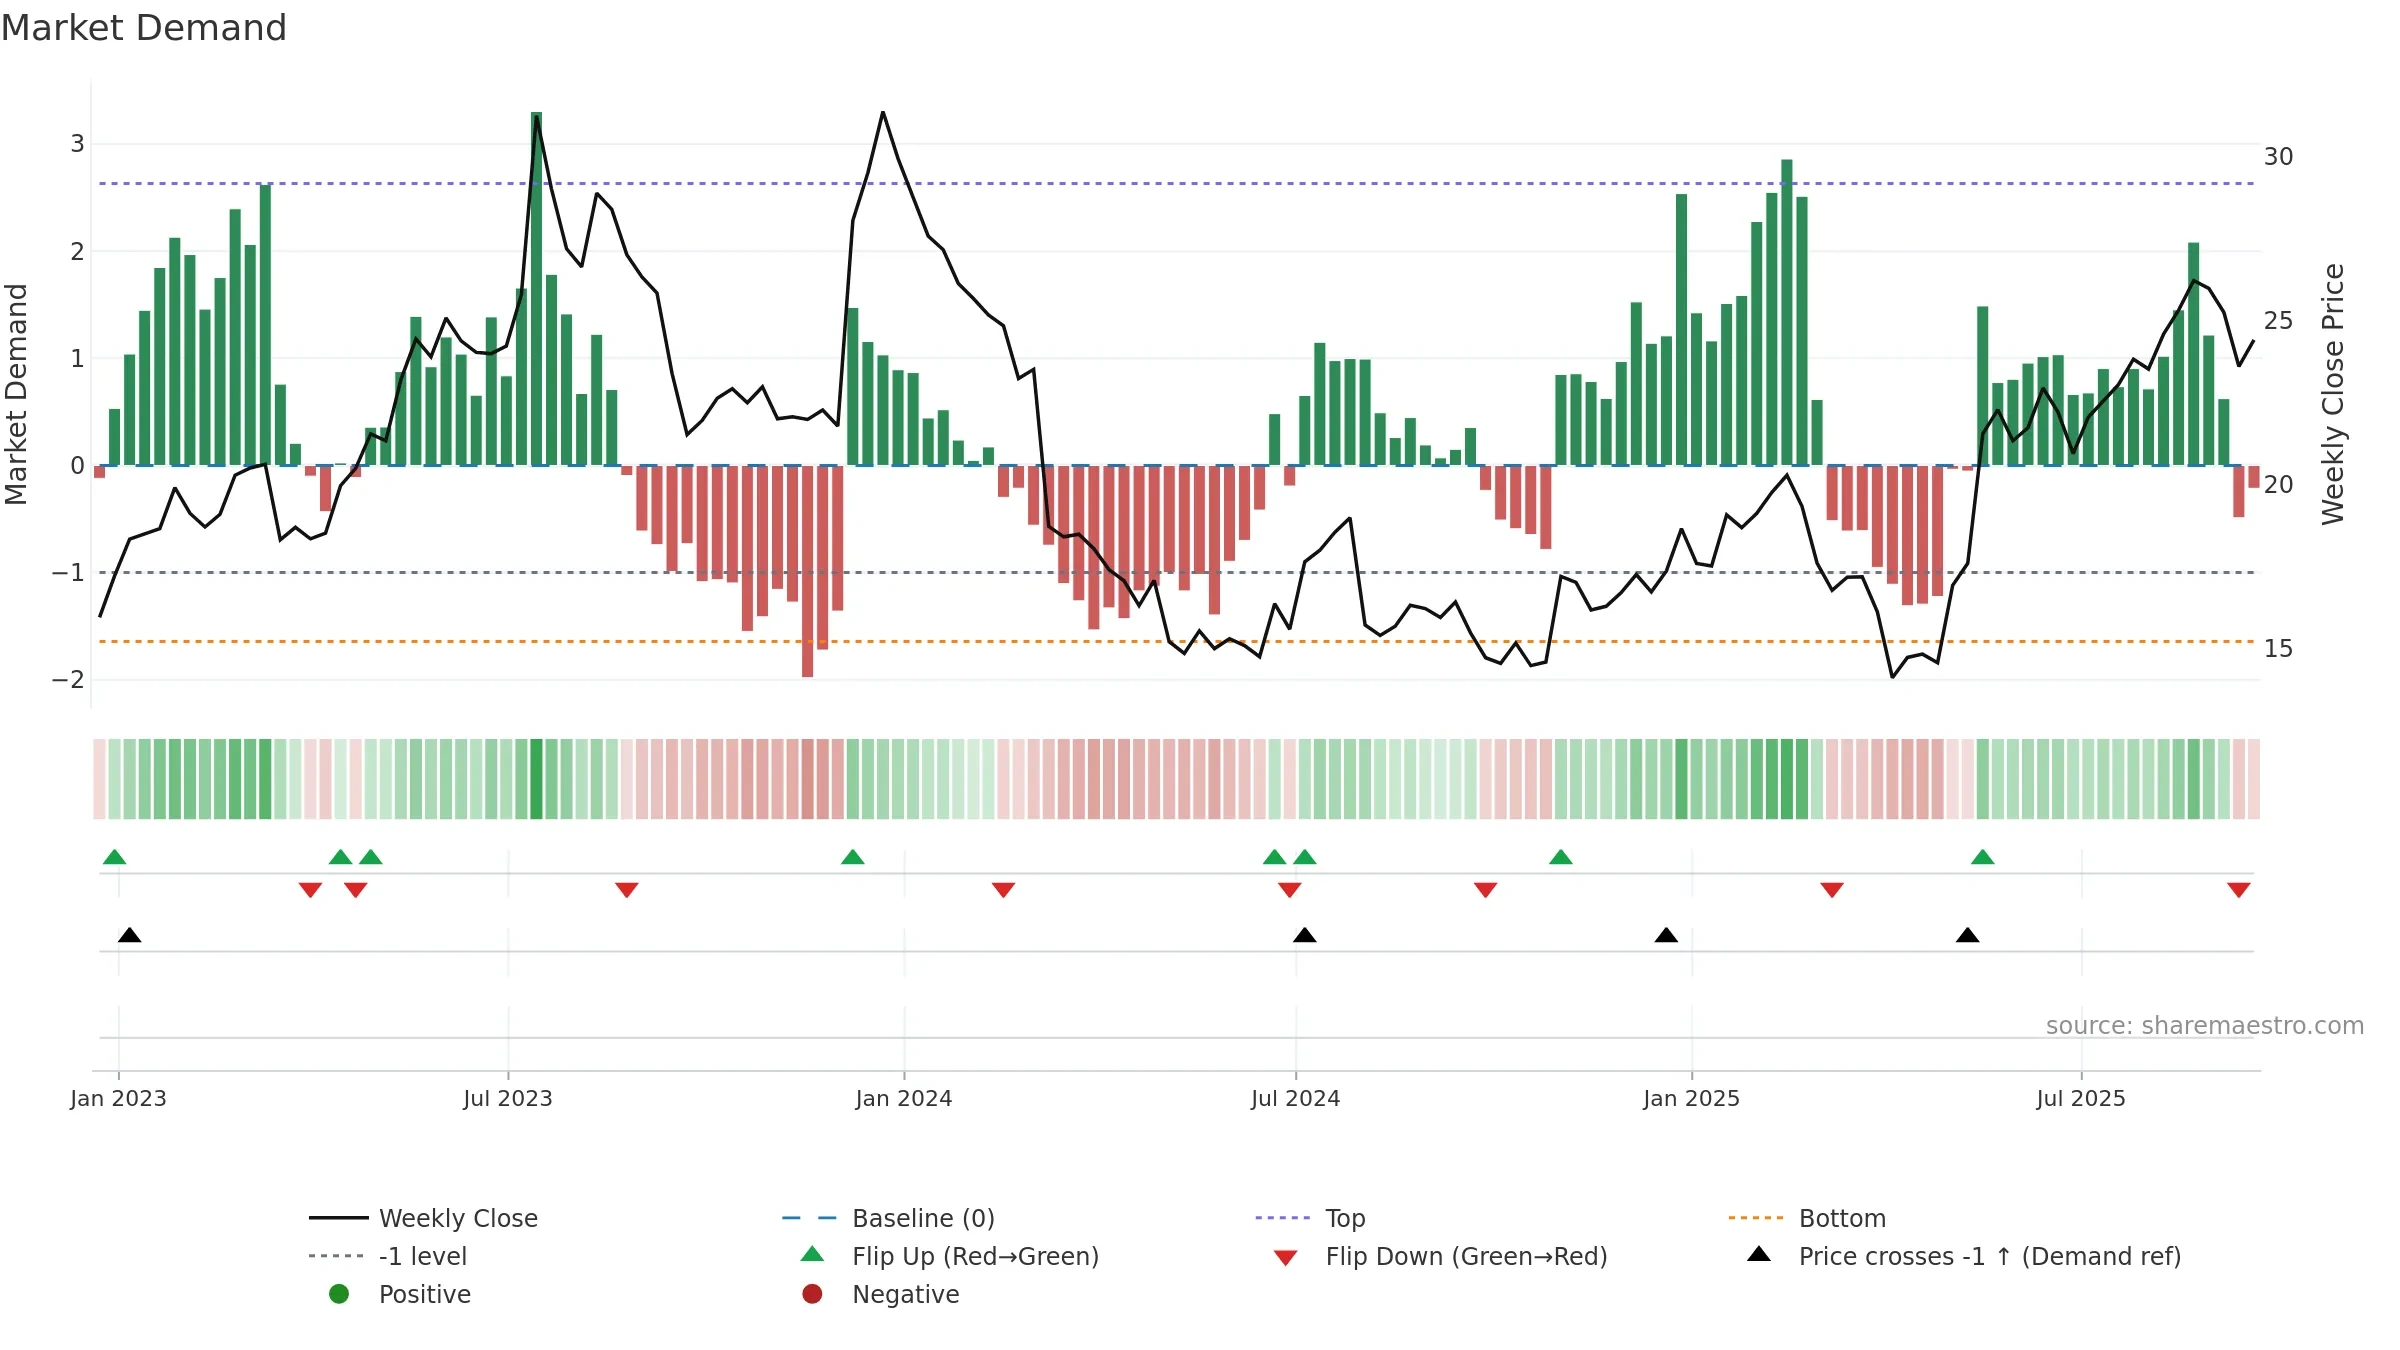
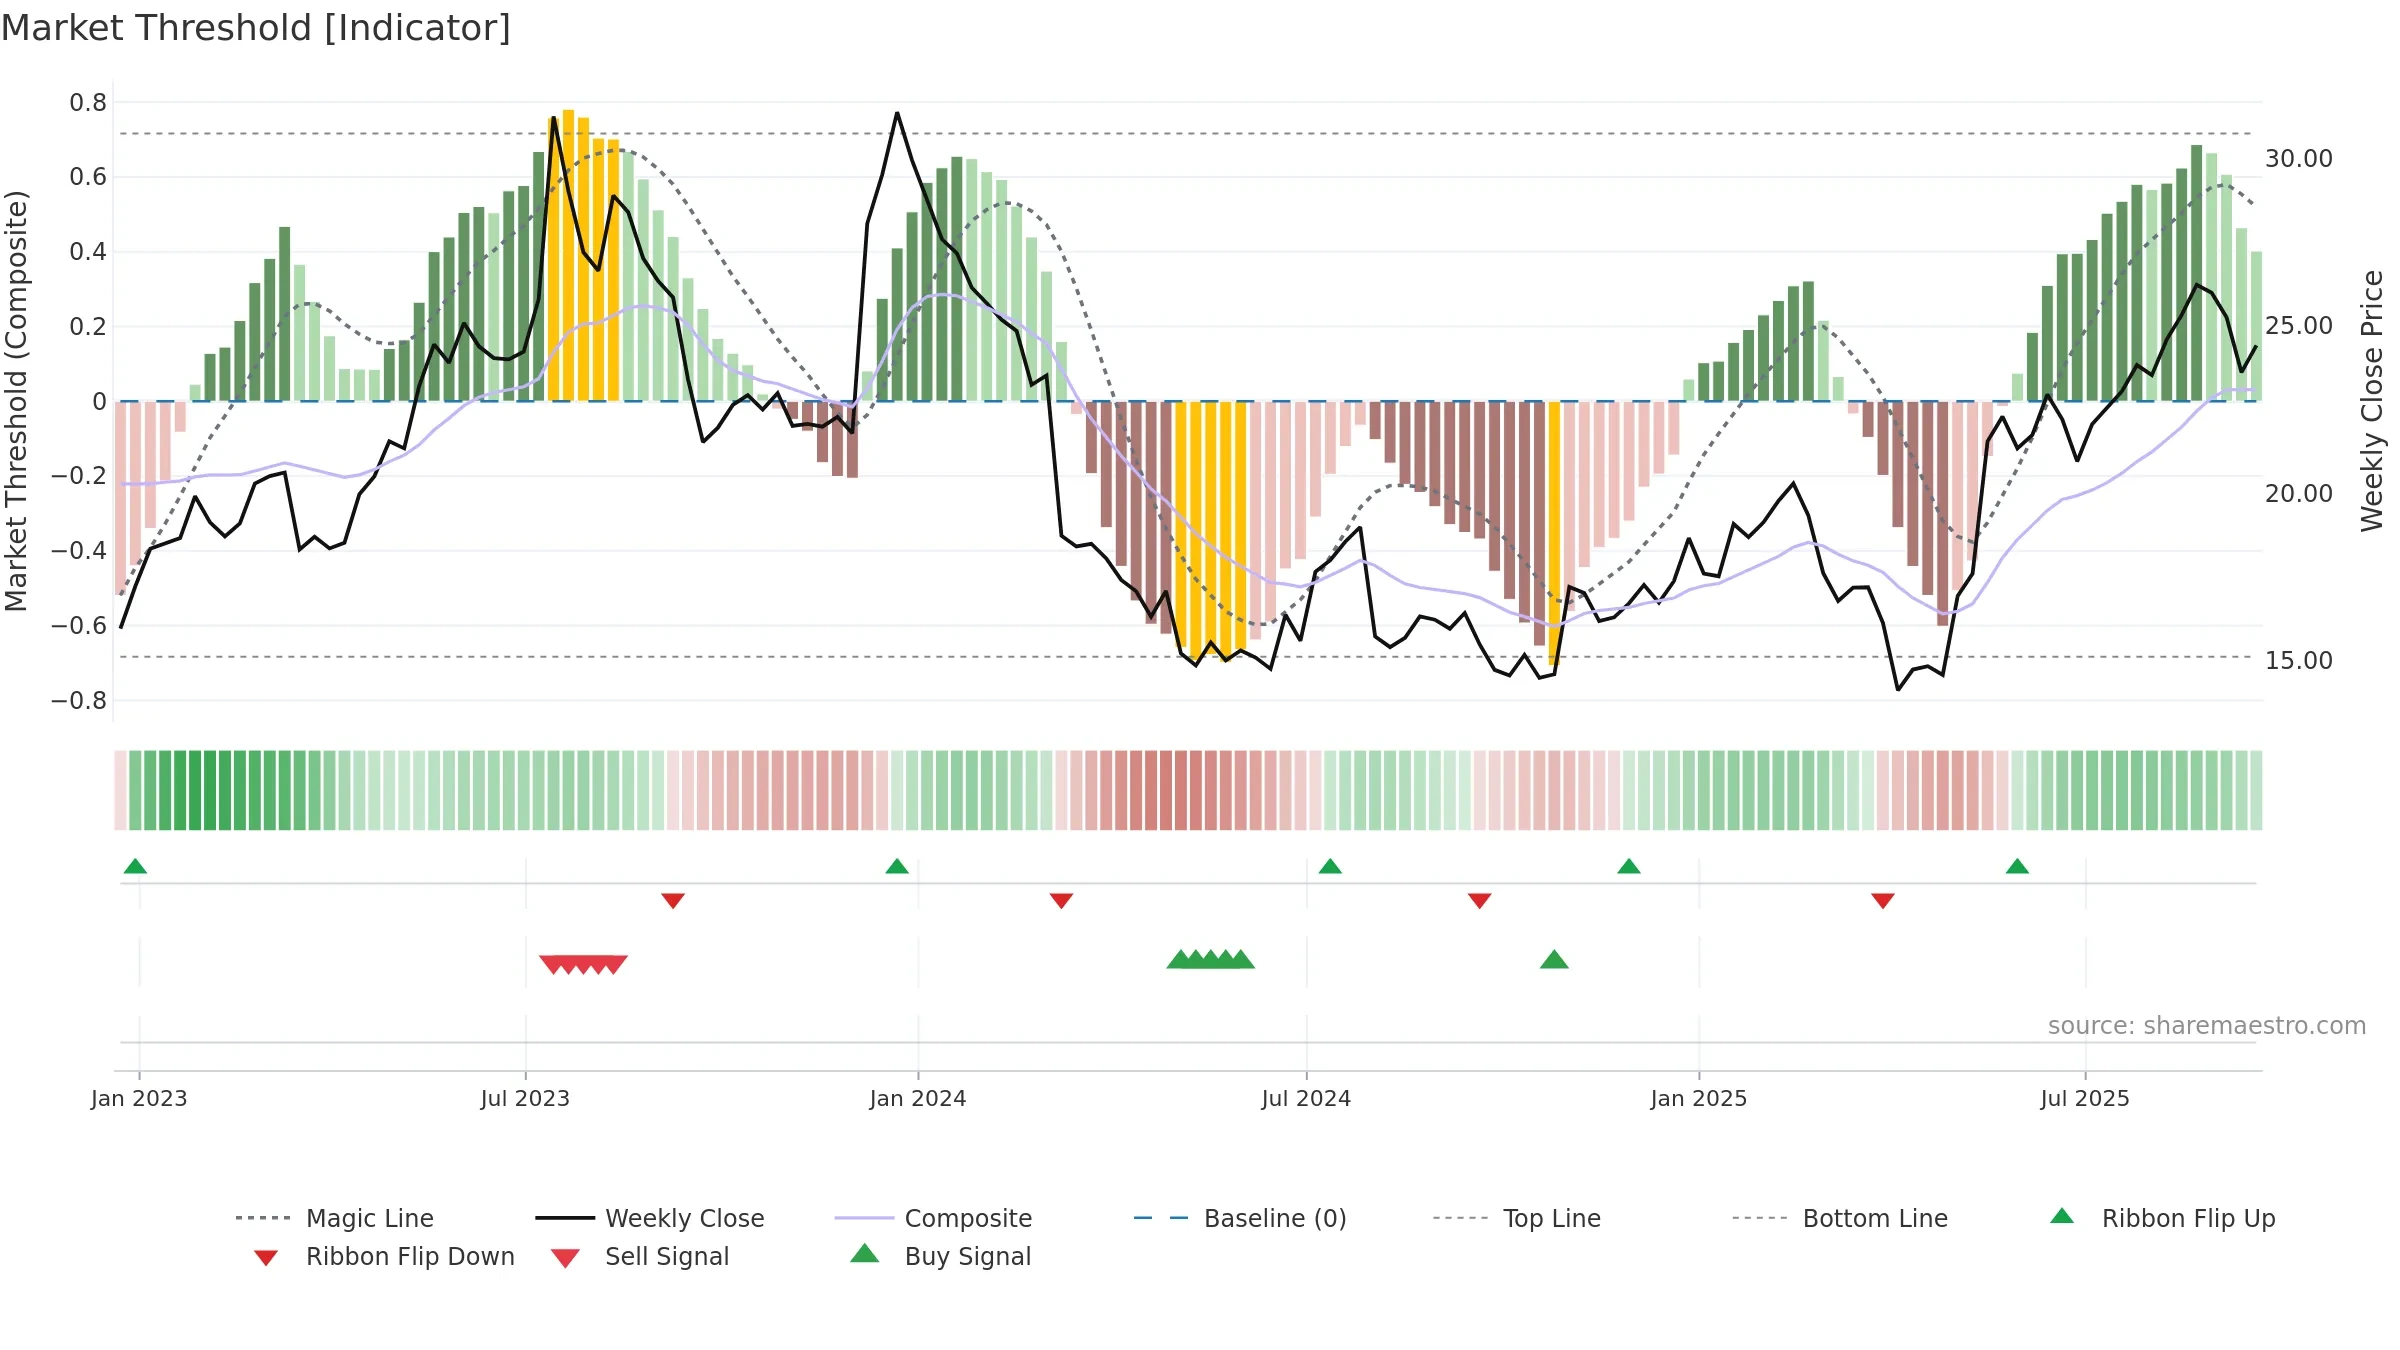
Negative setup. ★★☆☆☆ confidence. Price window: 3. Trend: Uptrend at Risk; gauge 83. In combination, liquidity diverges from price.
- High-level but rolling over (topping risk)
- Momentum is weak/falling
- Price is not above key averages
- Liquidity diverges from price
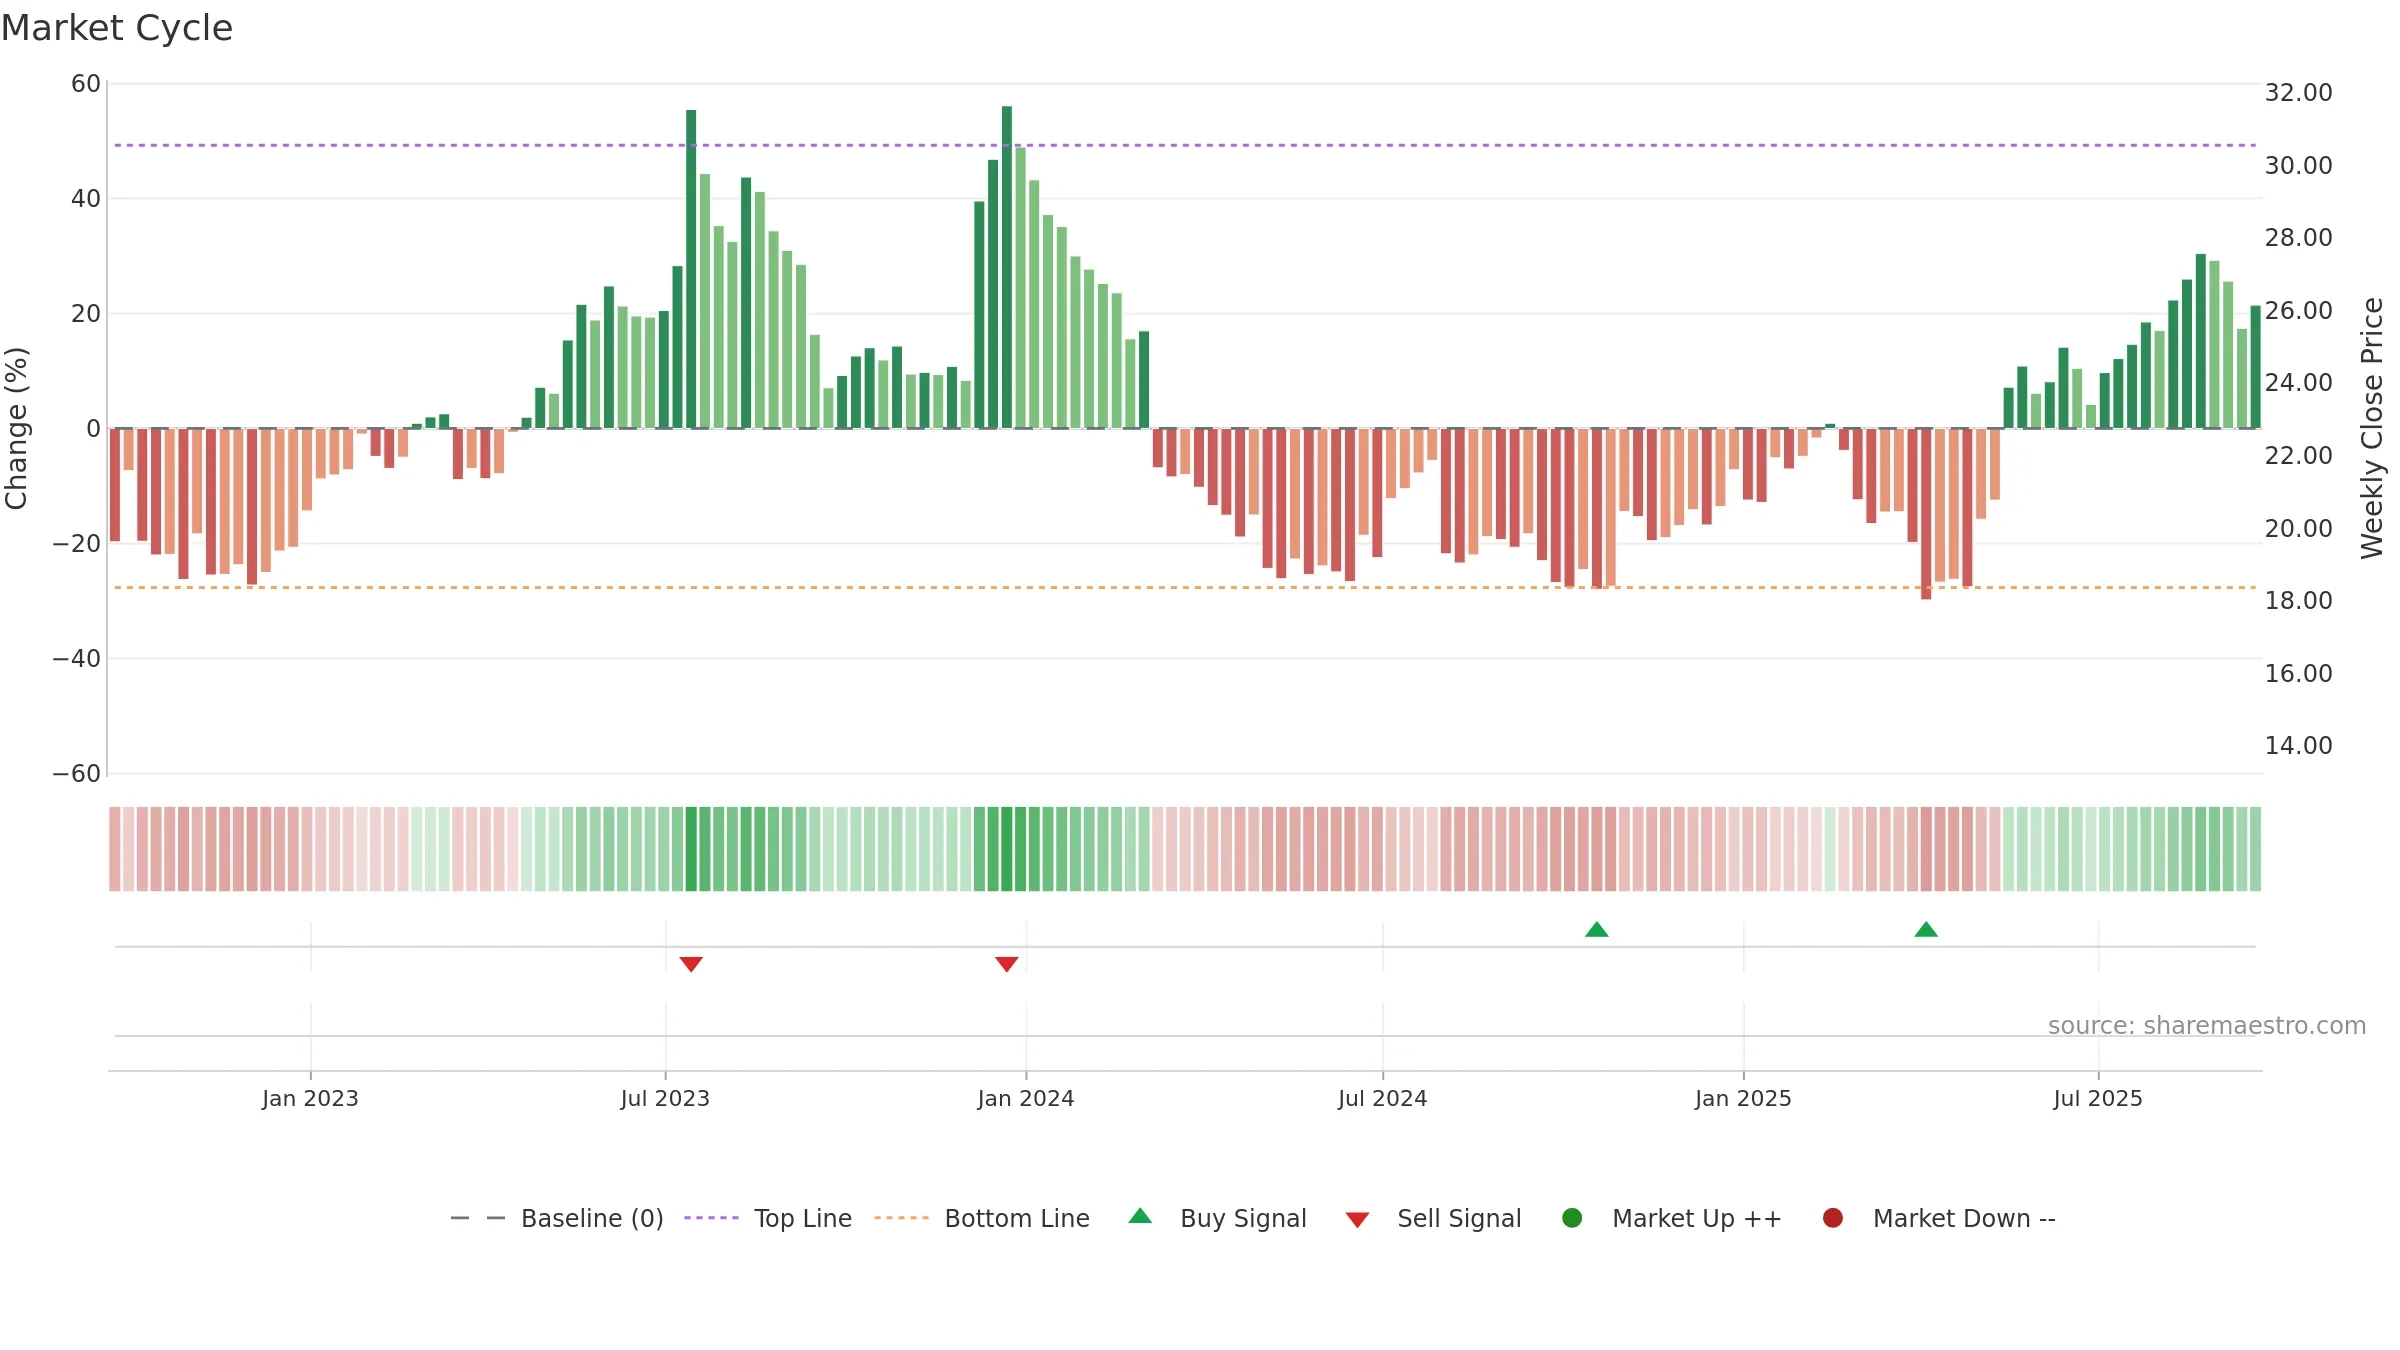
Why: Price window 3.78% over 8w. Close is -6.90% below the prior-window high. Return volatility 2.28%. Volume trend falling. Liquidity divergence with price. Trend state uptrend at risk. High-regime (0.80–1.00) downticks 3/7 (43.0%) • Accumulating. 4–8w crossover bearish. Momentum neutral and falling. Valuation limited upside without catalysts.
Tip: Most metrics include a hover tooltip where they appear in the report.