Ecolab Inc.
ECL NYSE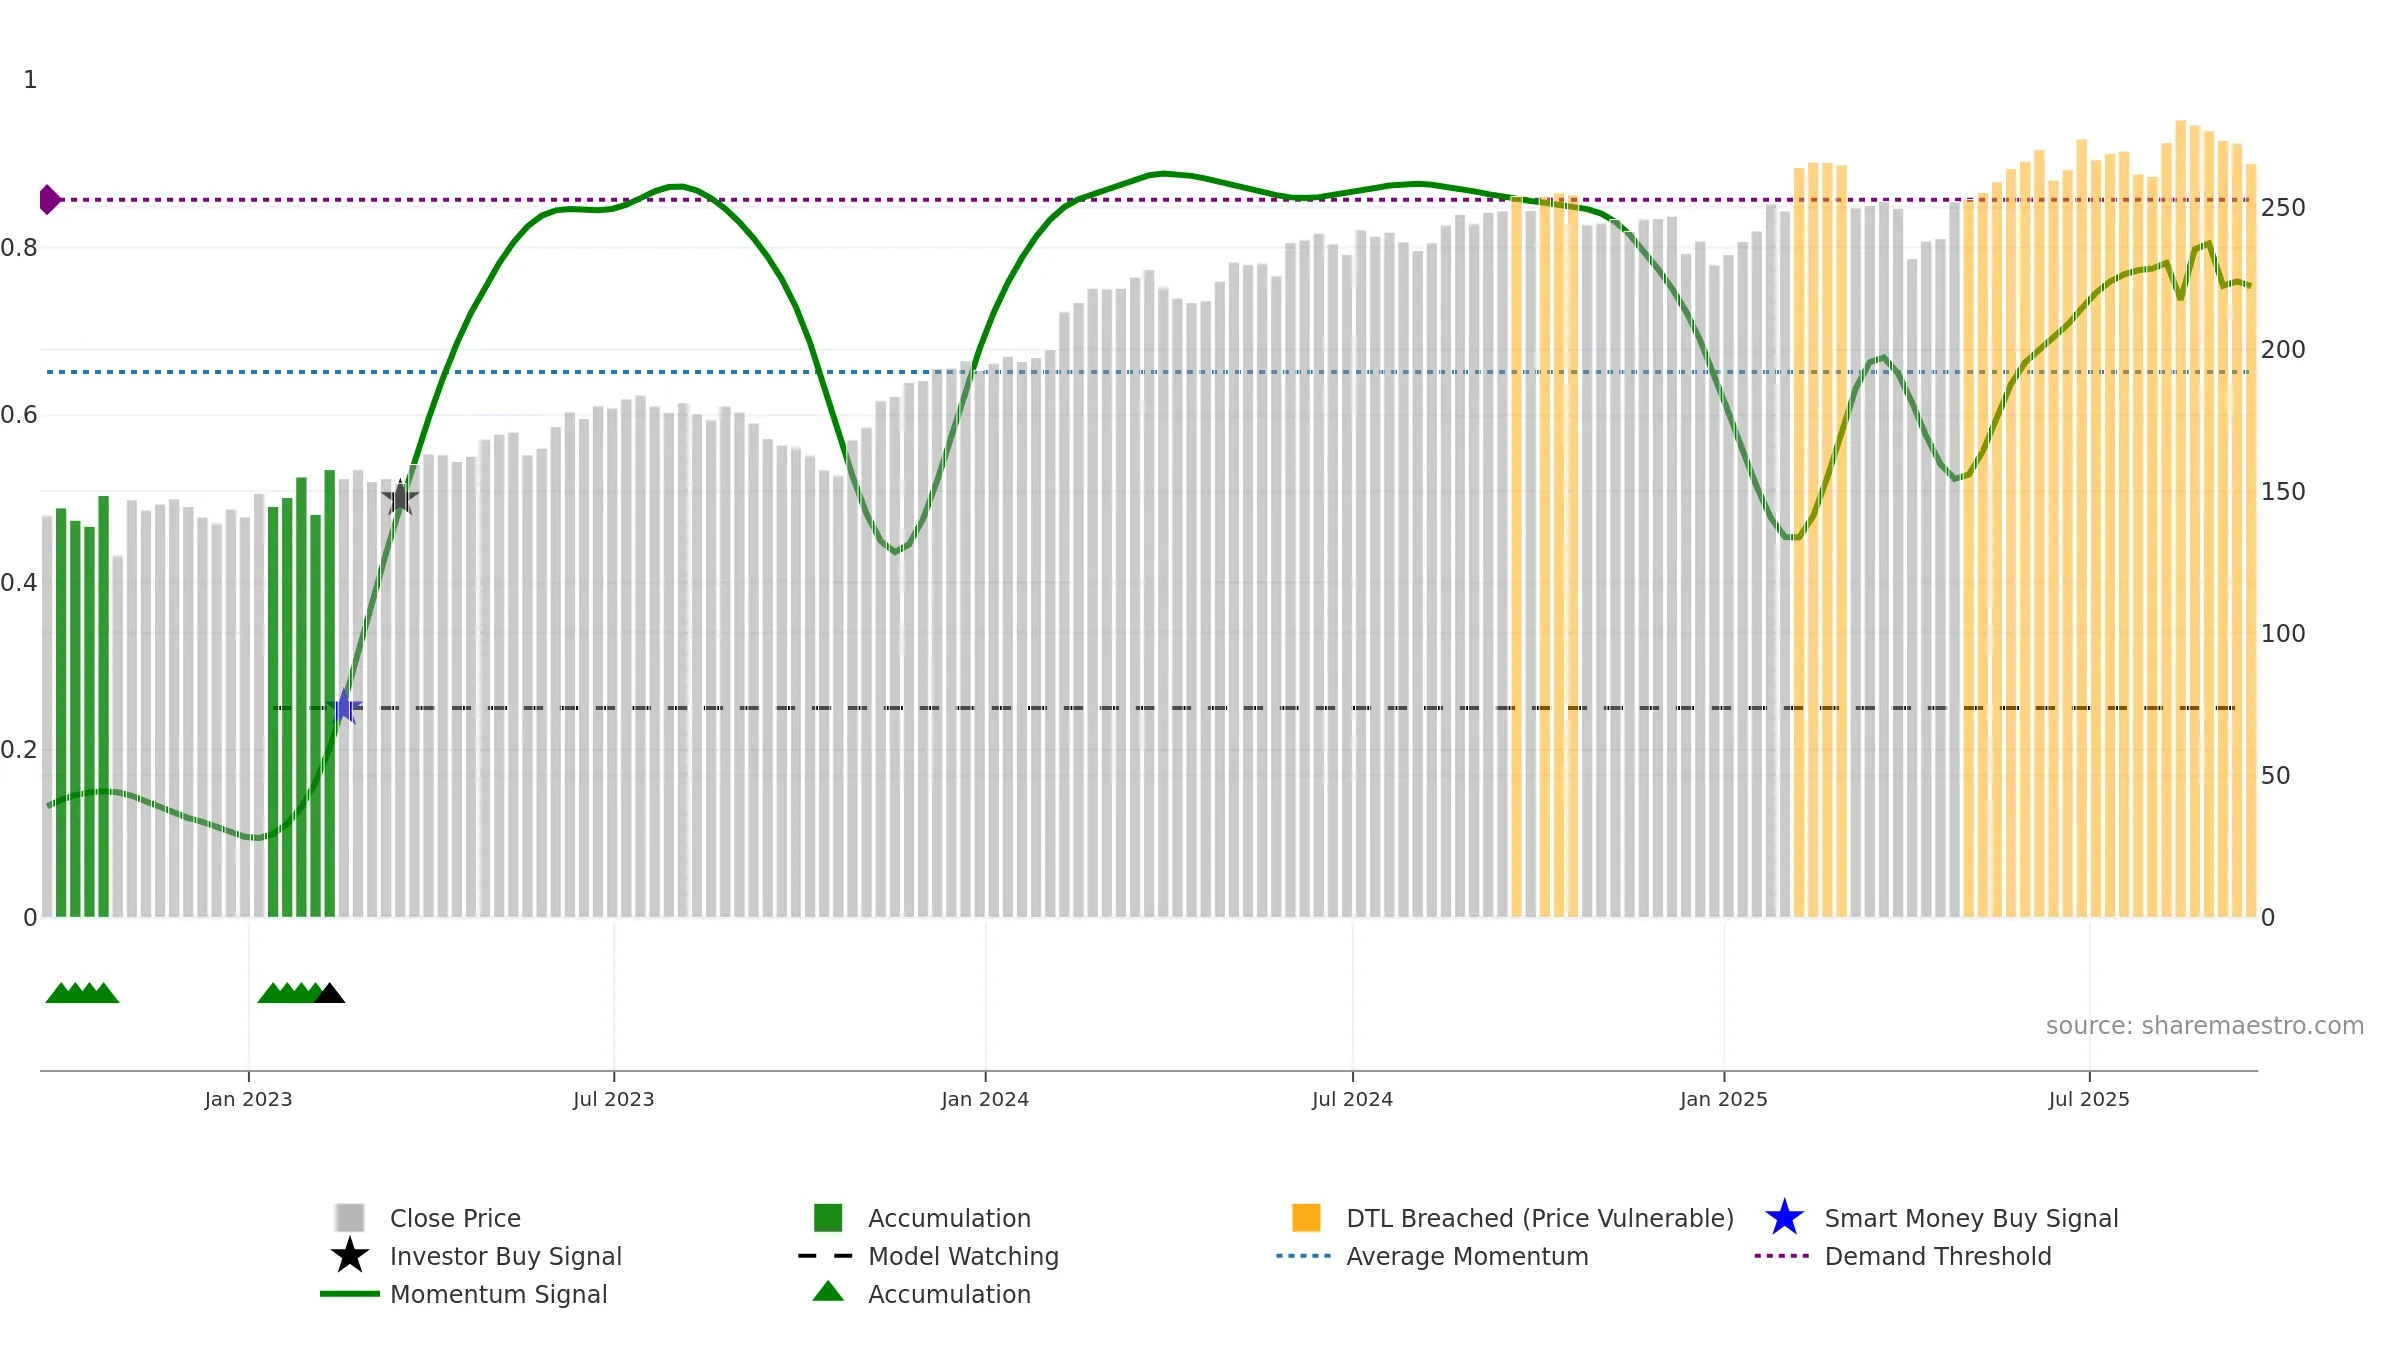
Weekly Report
Ecolab Inc. closed at 265.4800 (0.15% WoW) . Data window ends Fri, 19 Sep 2025.
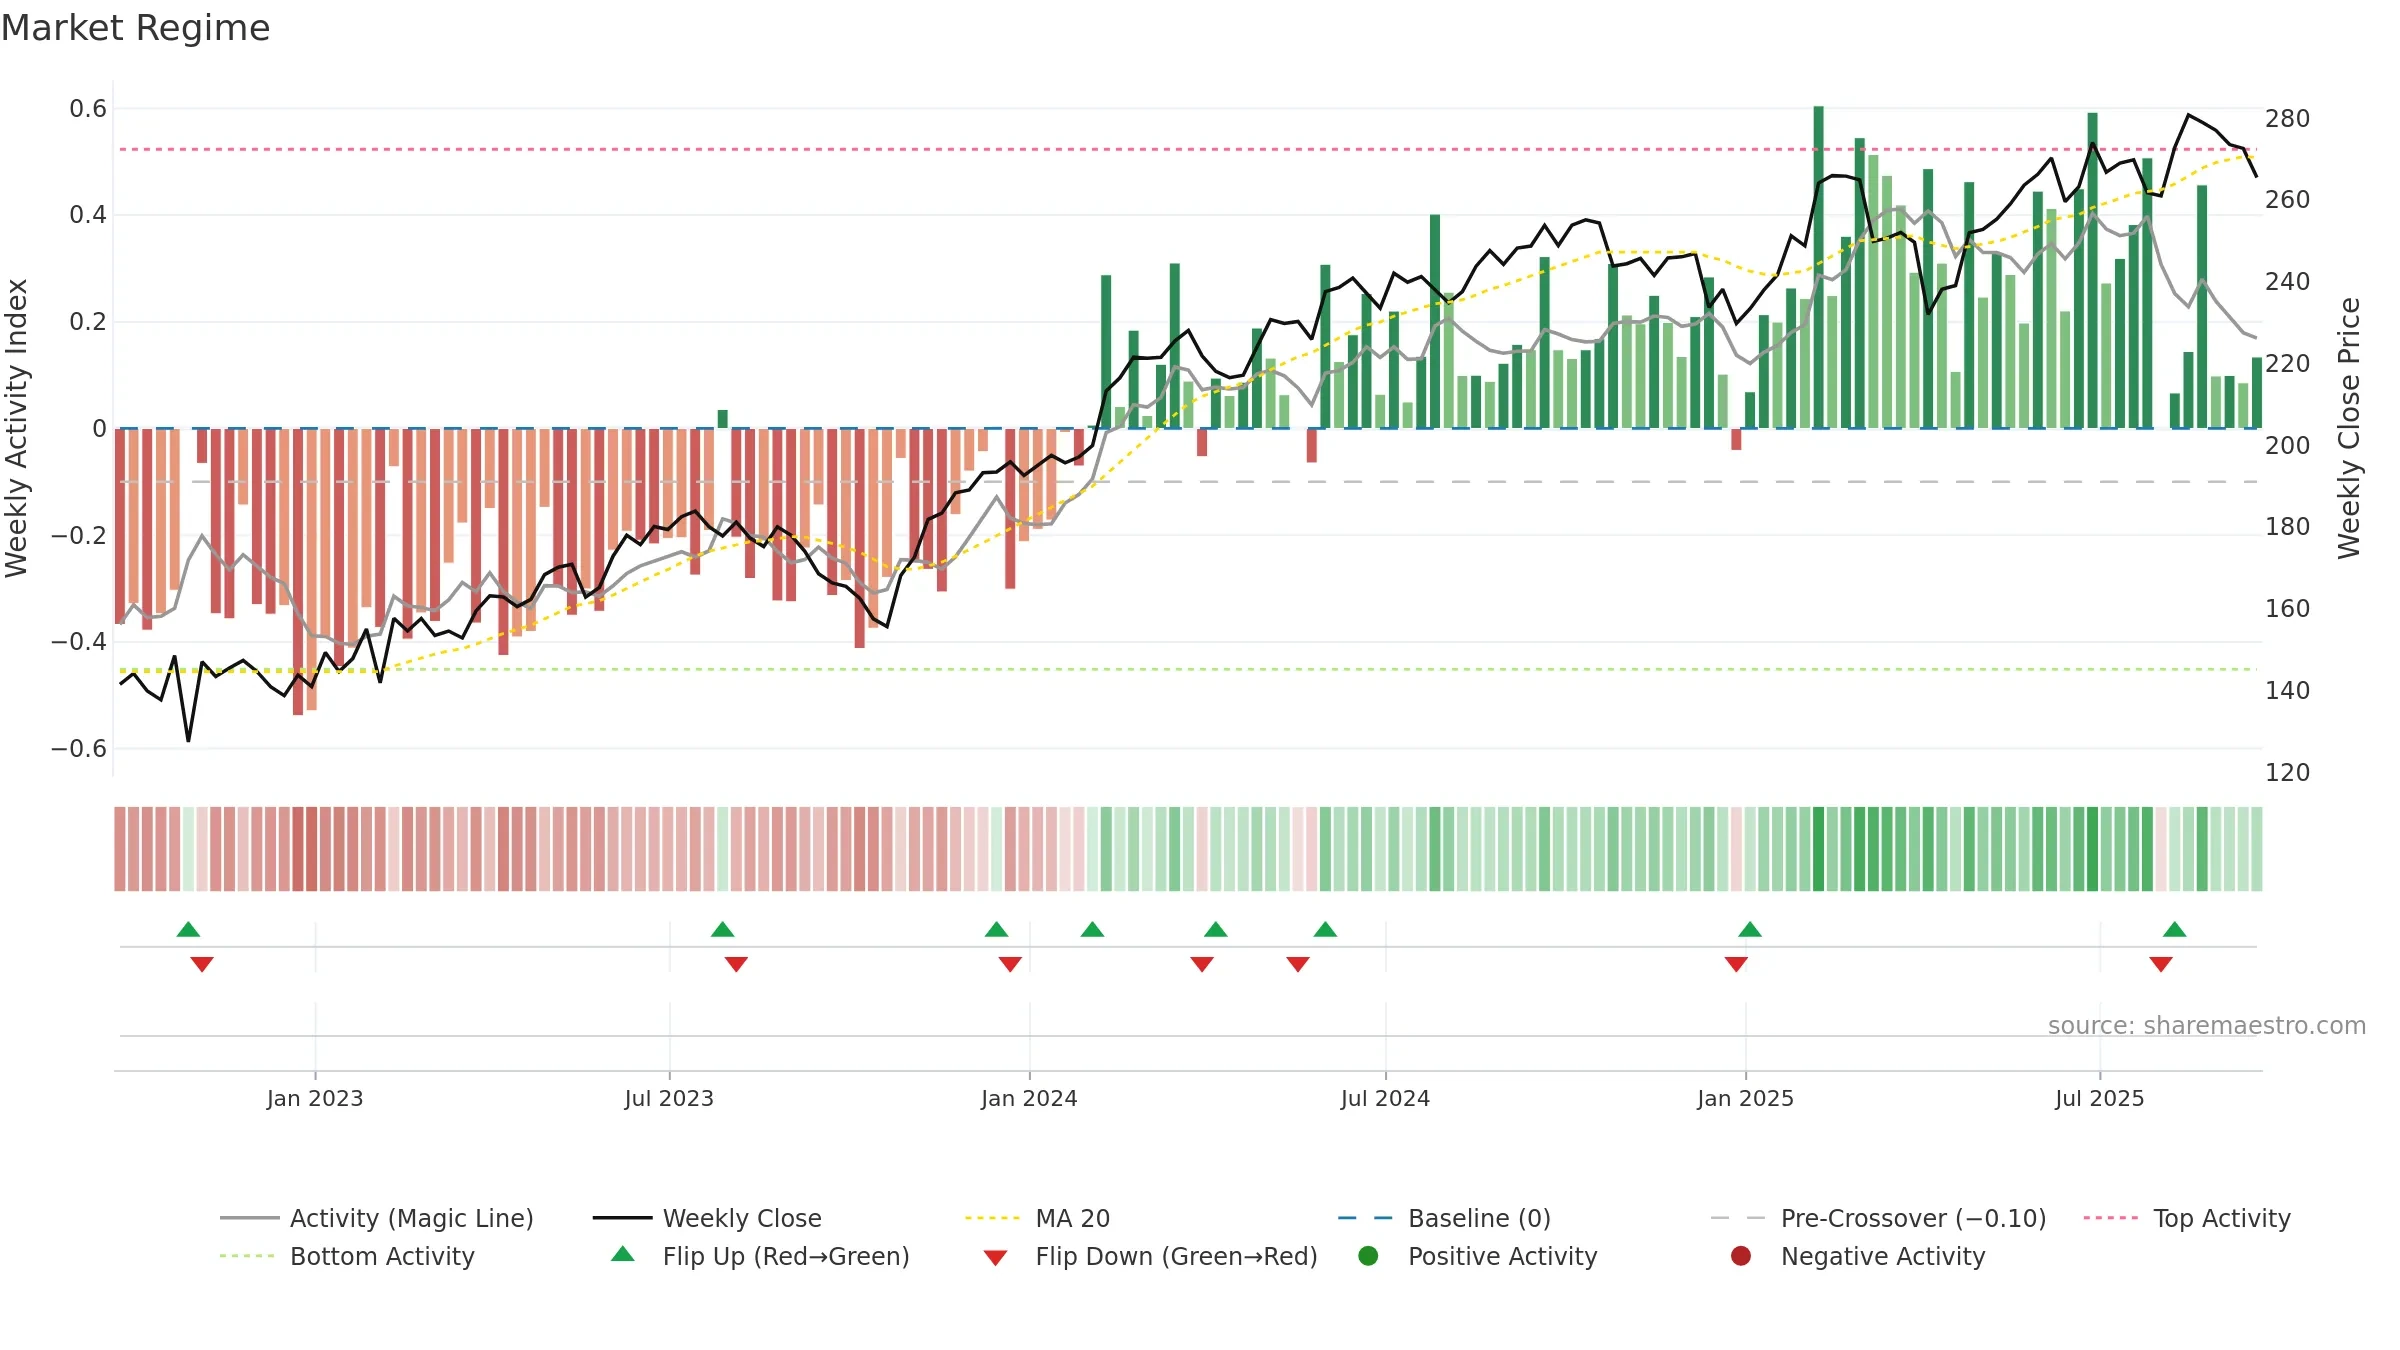
How to read this — Price slope is upward, indicating persistent buying over the window. Low weekly volatility favours steadier follow-through. Volume and price are moving in the same direction — a constructive confirmation. Returns are negatively correlated with volume — strength may come on lighter activity. Distance to baseline is narrowing — reverting closer to its fair-value track. Fresh short-term downside crossover weakens near-term tone.
Up-slope supports buying interest; pullbacks may be contained if activity stays firm.
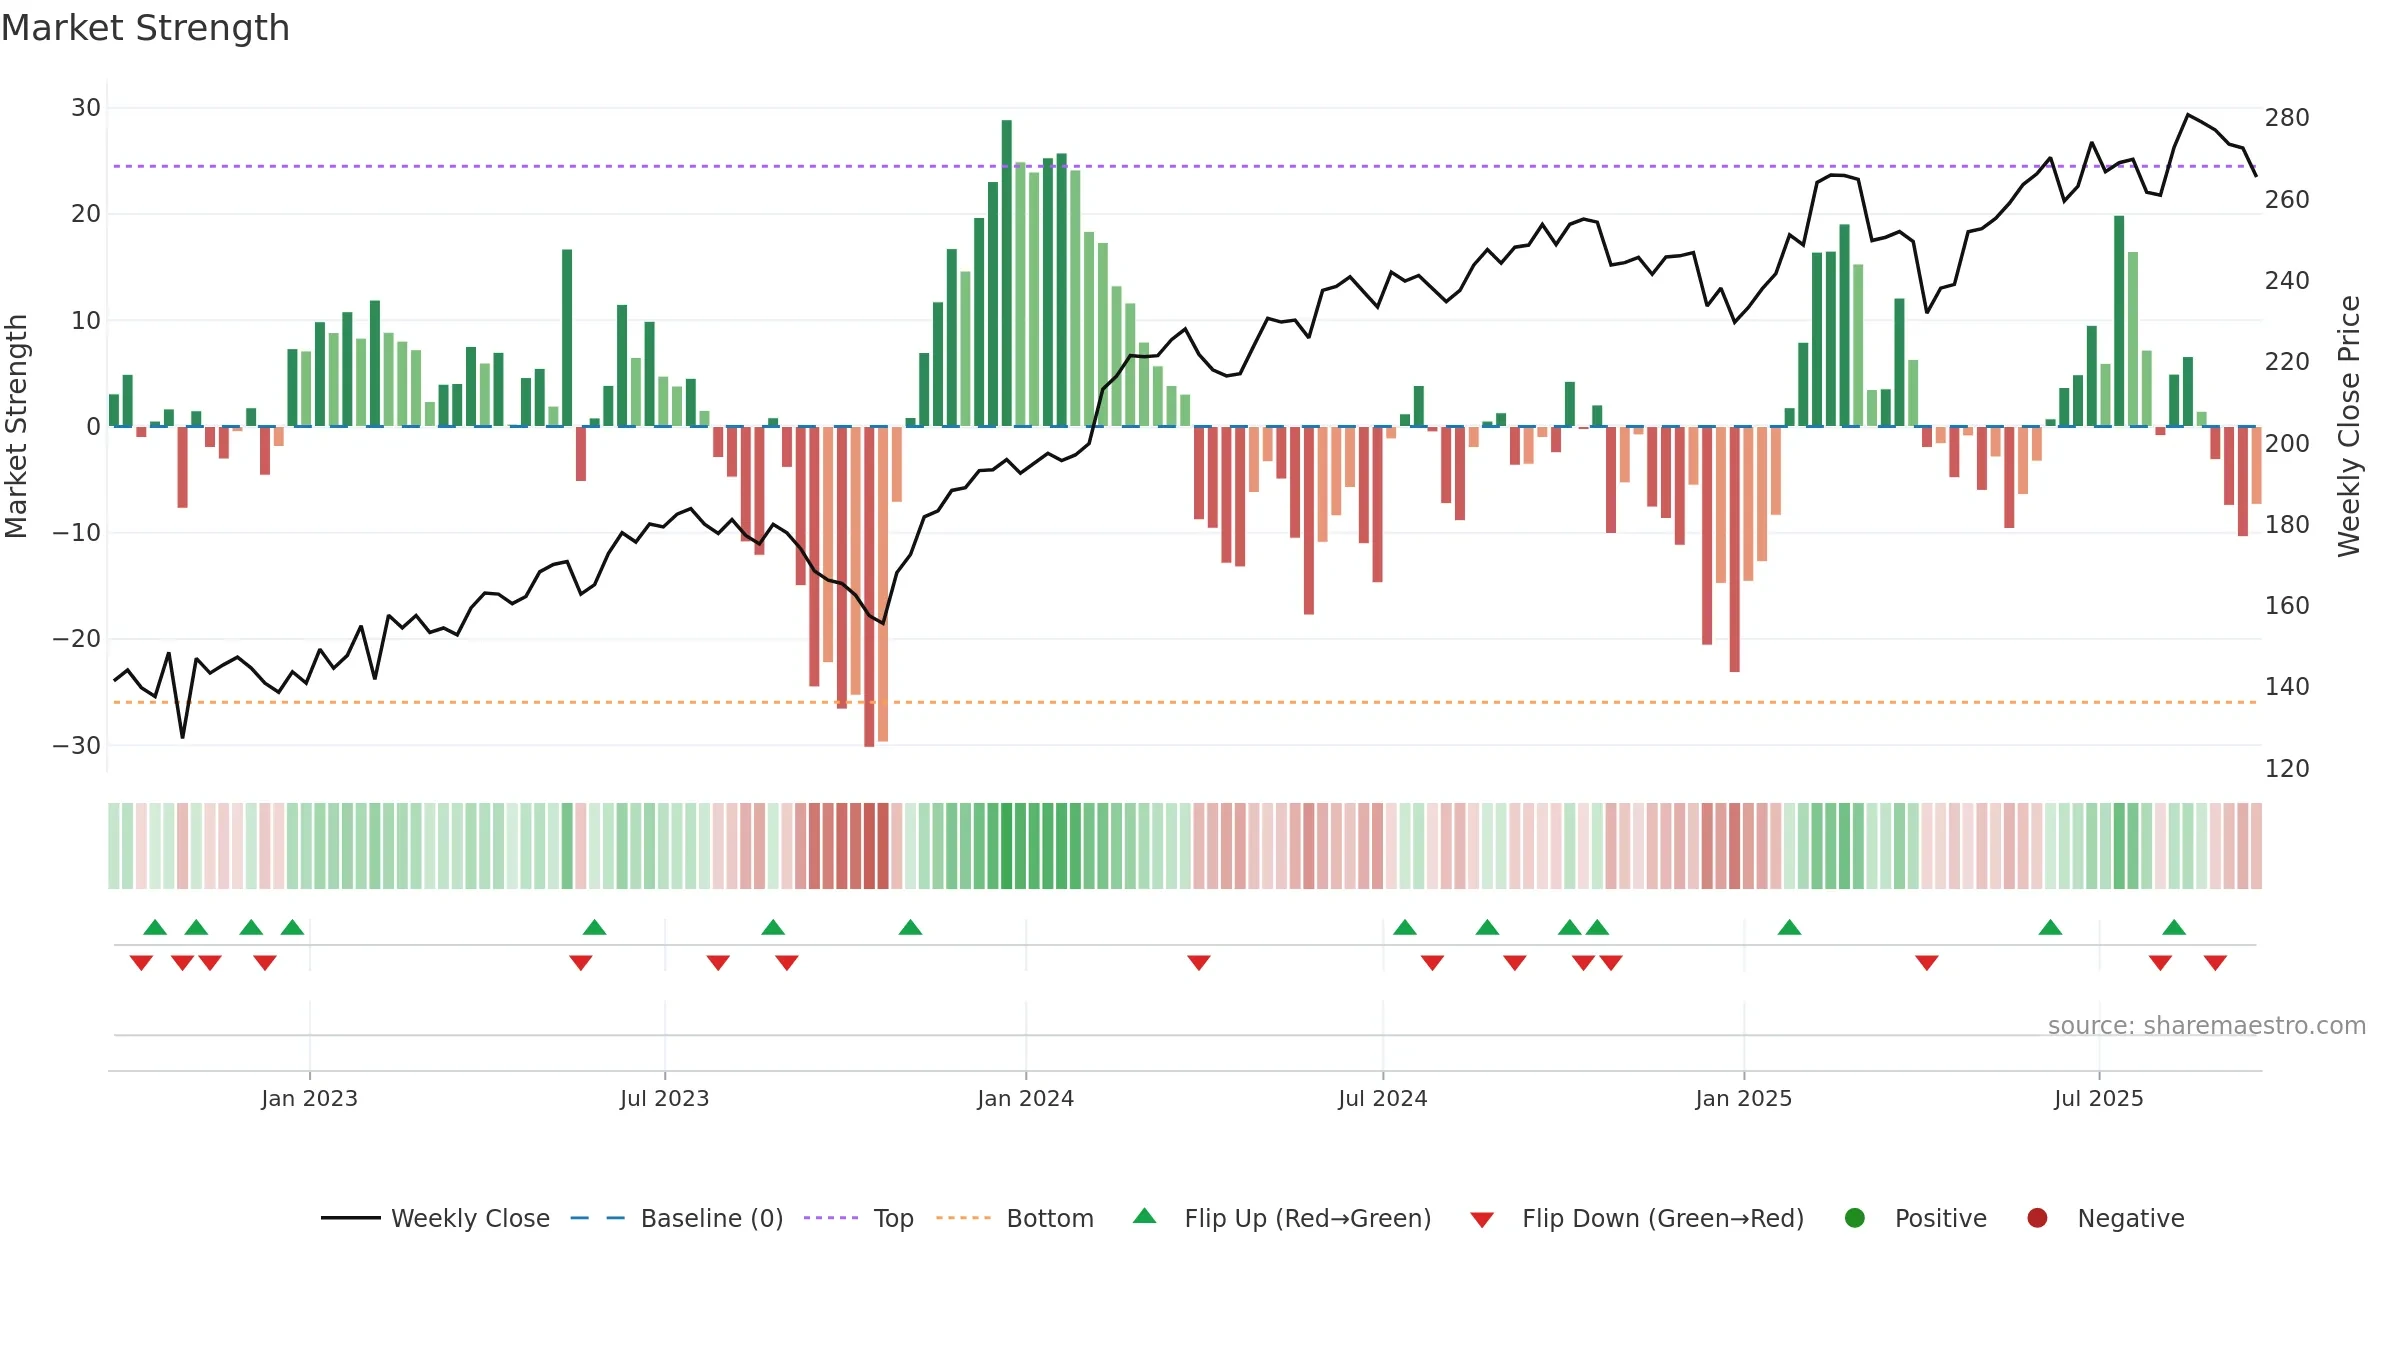
Gauge maps the trend signal to a 0–100 scale.
How to read this — Gauge is elevated but momentum is rolling over; topping risk is rising. Notable breakdown from ≥0.80 weakens trend quality.
Stay alert: protect gains or seek confirmation before adding risk.
Conclusion
Negative setup. ★★☆☆☆ confidence. Price window: 1. Trend: Uptrend at Risk; gauge 75. In combination, liquidity confirms the move.
- Liquidity confirms the price trend
- Low return volatility supports durability
- High-level but rolling over (topping risk)
- Momentum is weak/falling
- Price is not above key averages
- Recent breakdown from ≥0.80 weakens trend quality
Why: Price window 1.71% over 8w. Close is -5.47% below the prior-window high. Return volatility 0.82%. Volume trend rising. Liquidity convergence with price. Trend state uptrend at risk. 4–8w crossover bearish. Momentum neutral and falling.
Tip: Most metrics include a hover tooltip where they appear in the report.