San Neng Group Holdings Co., LTD.
6671 TPE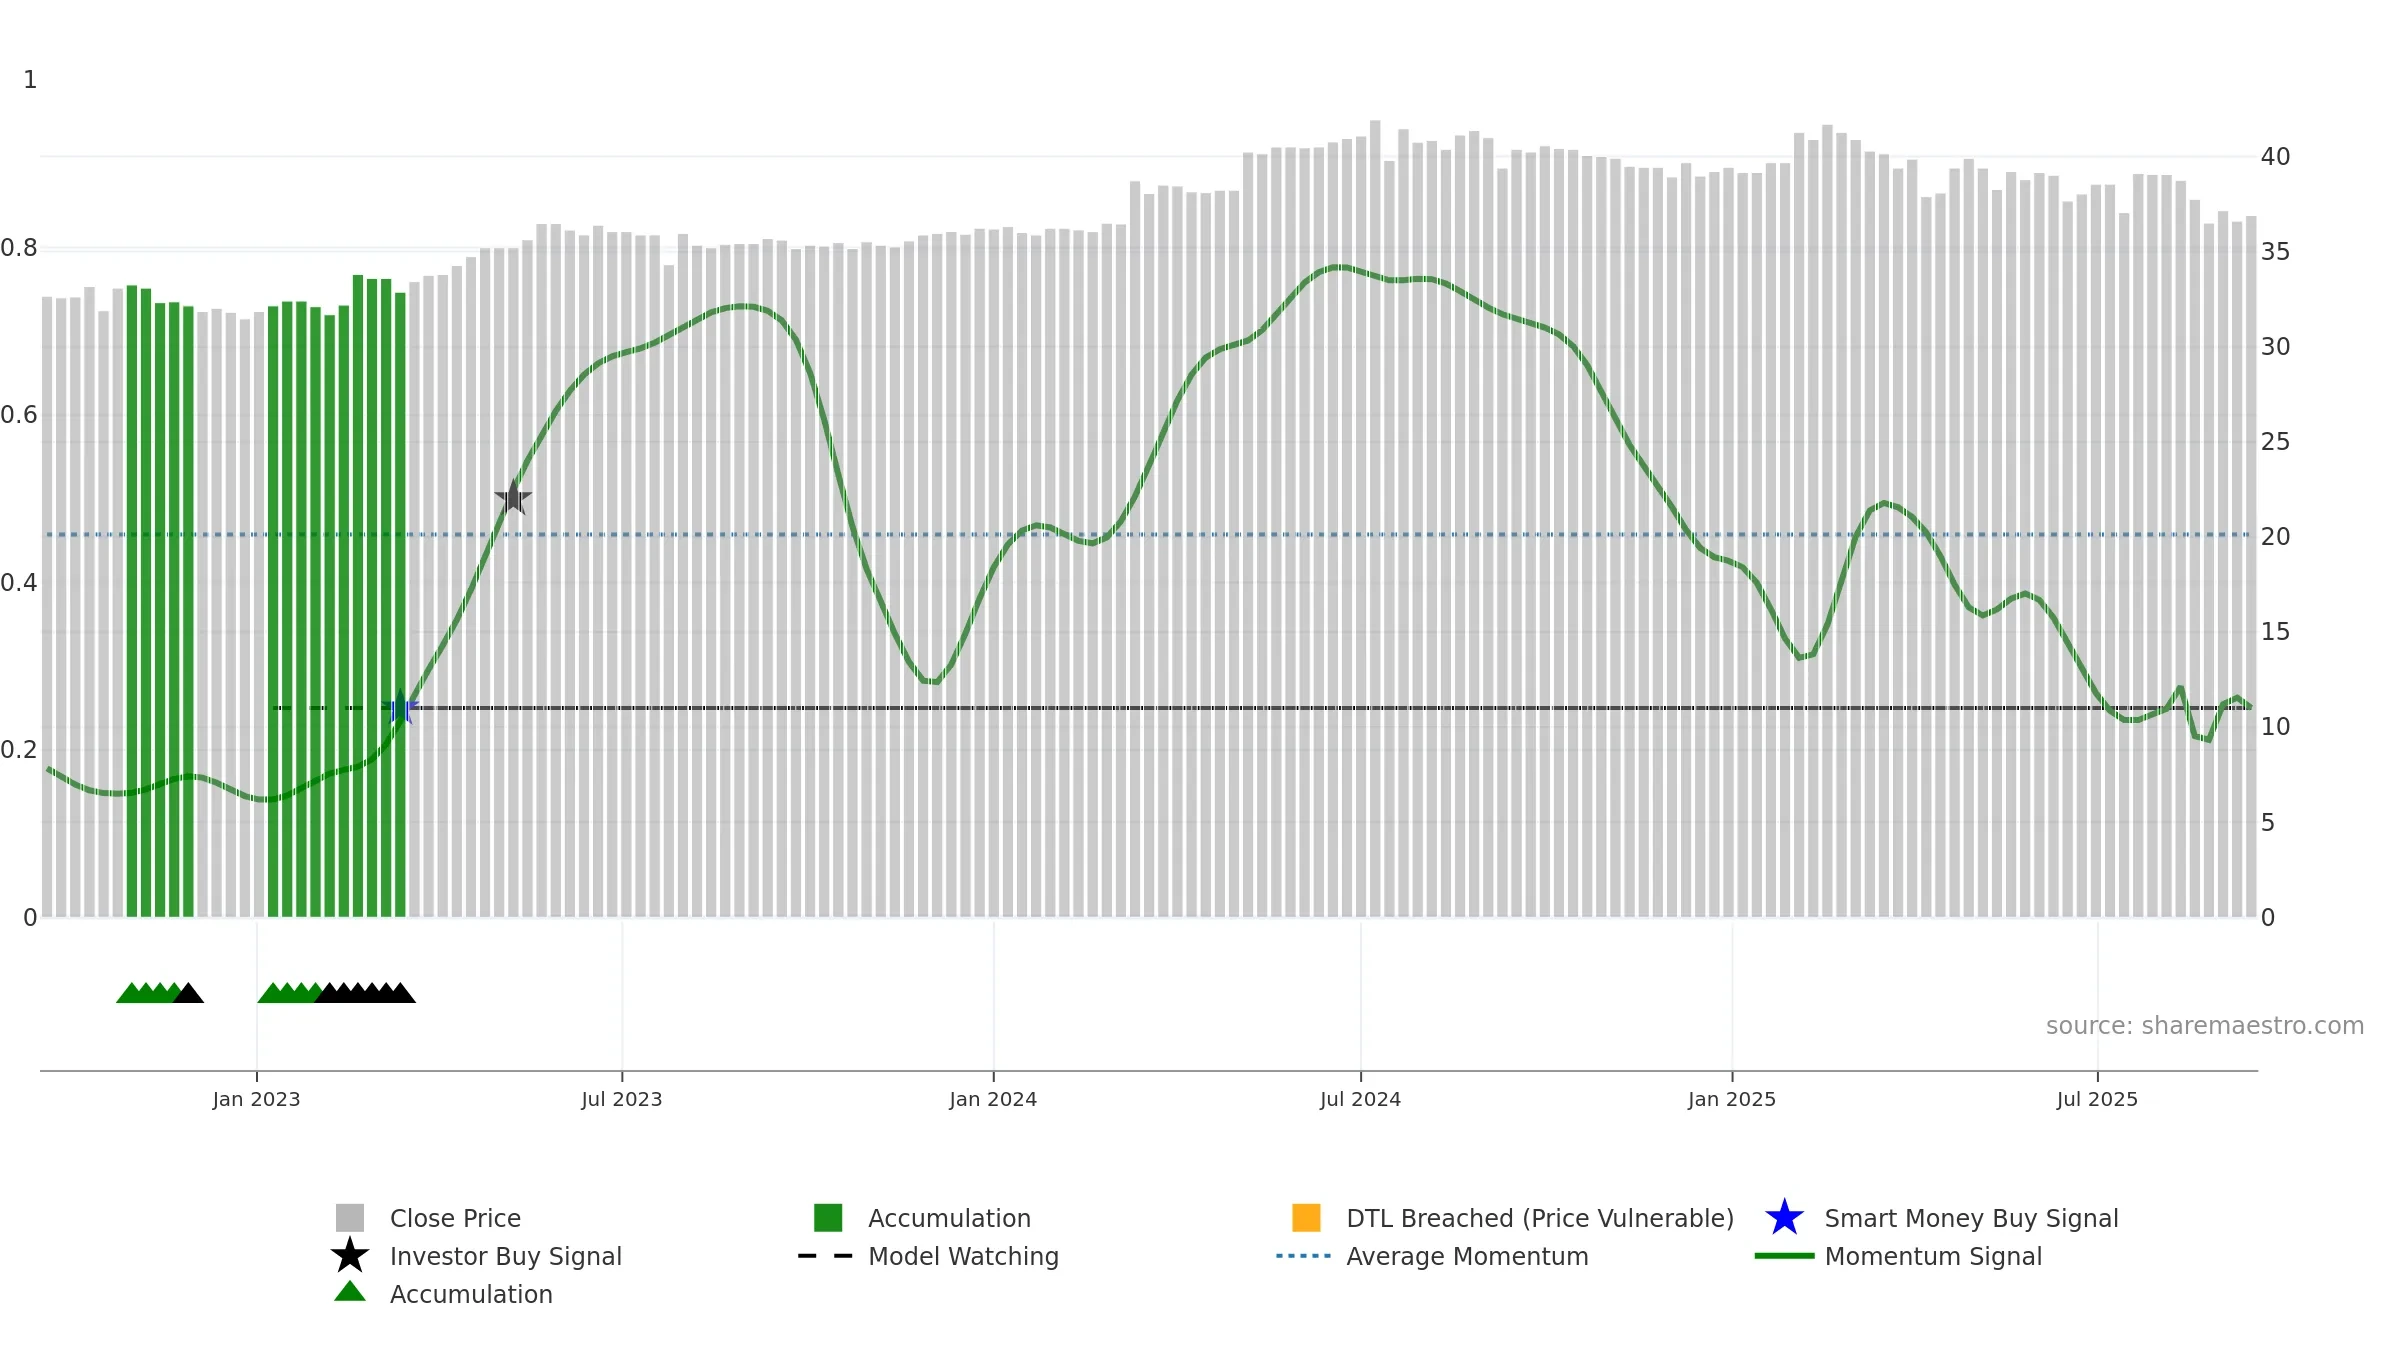
Weekly Report
San Neng Group Holdings Co., LTD. closed at 36.9000 (0.00% WoW) . Data window ends Mon, 15 Sep 2025.
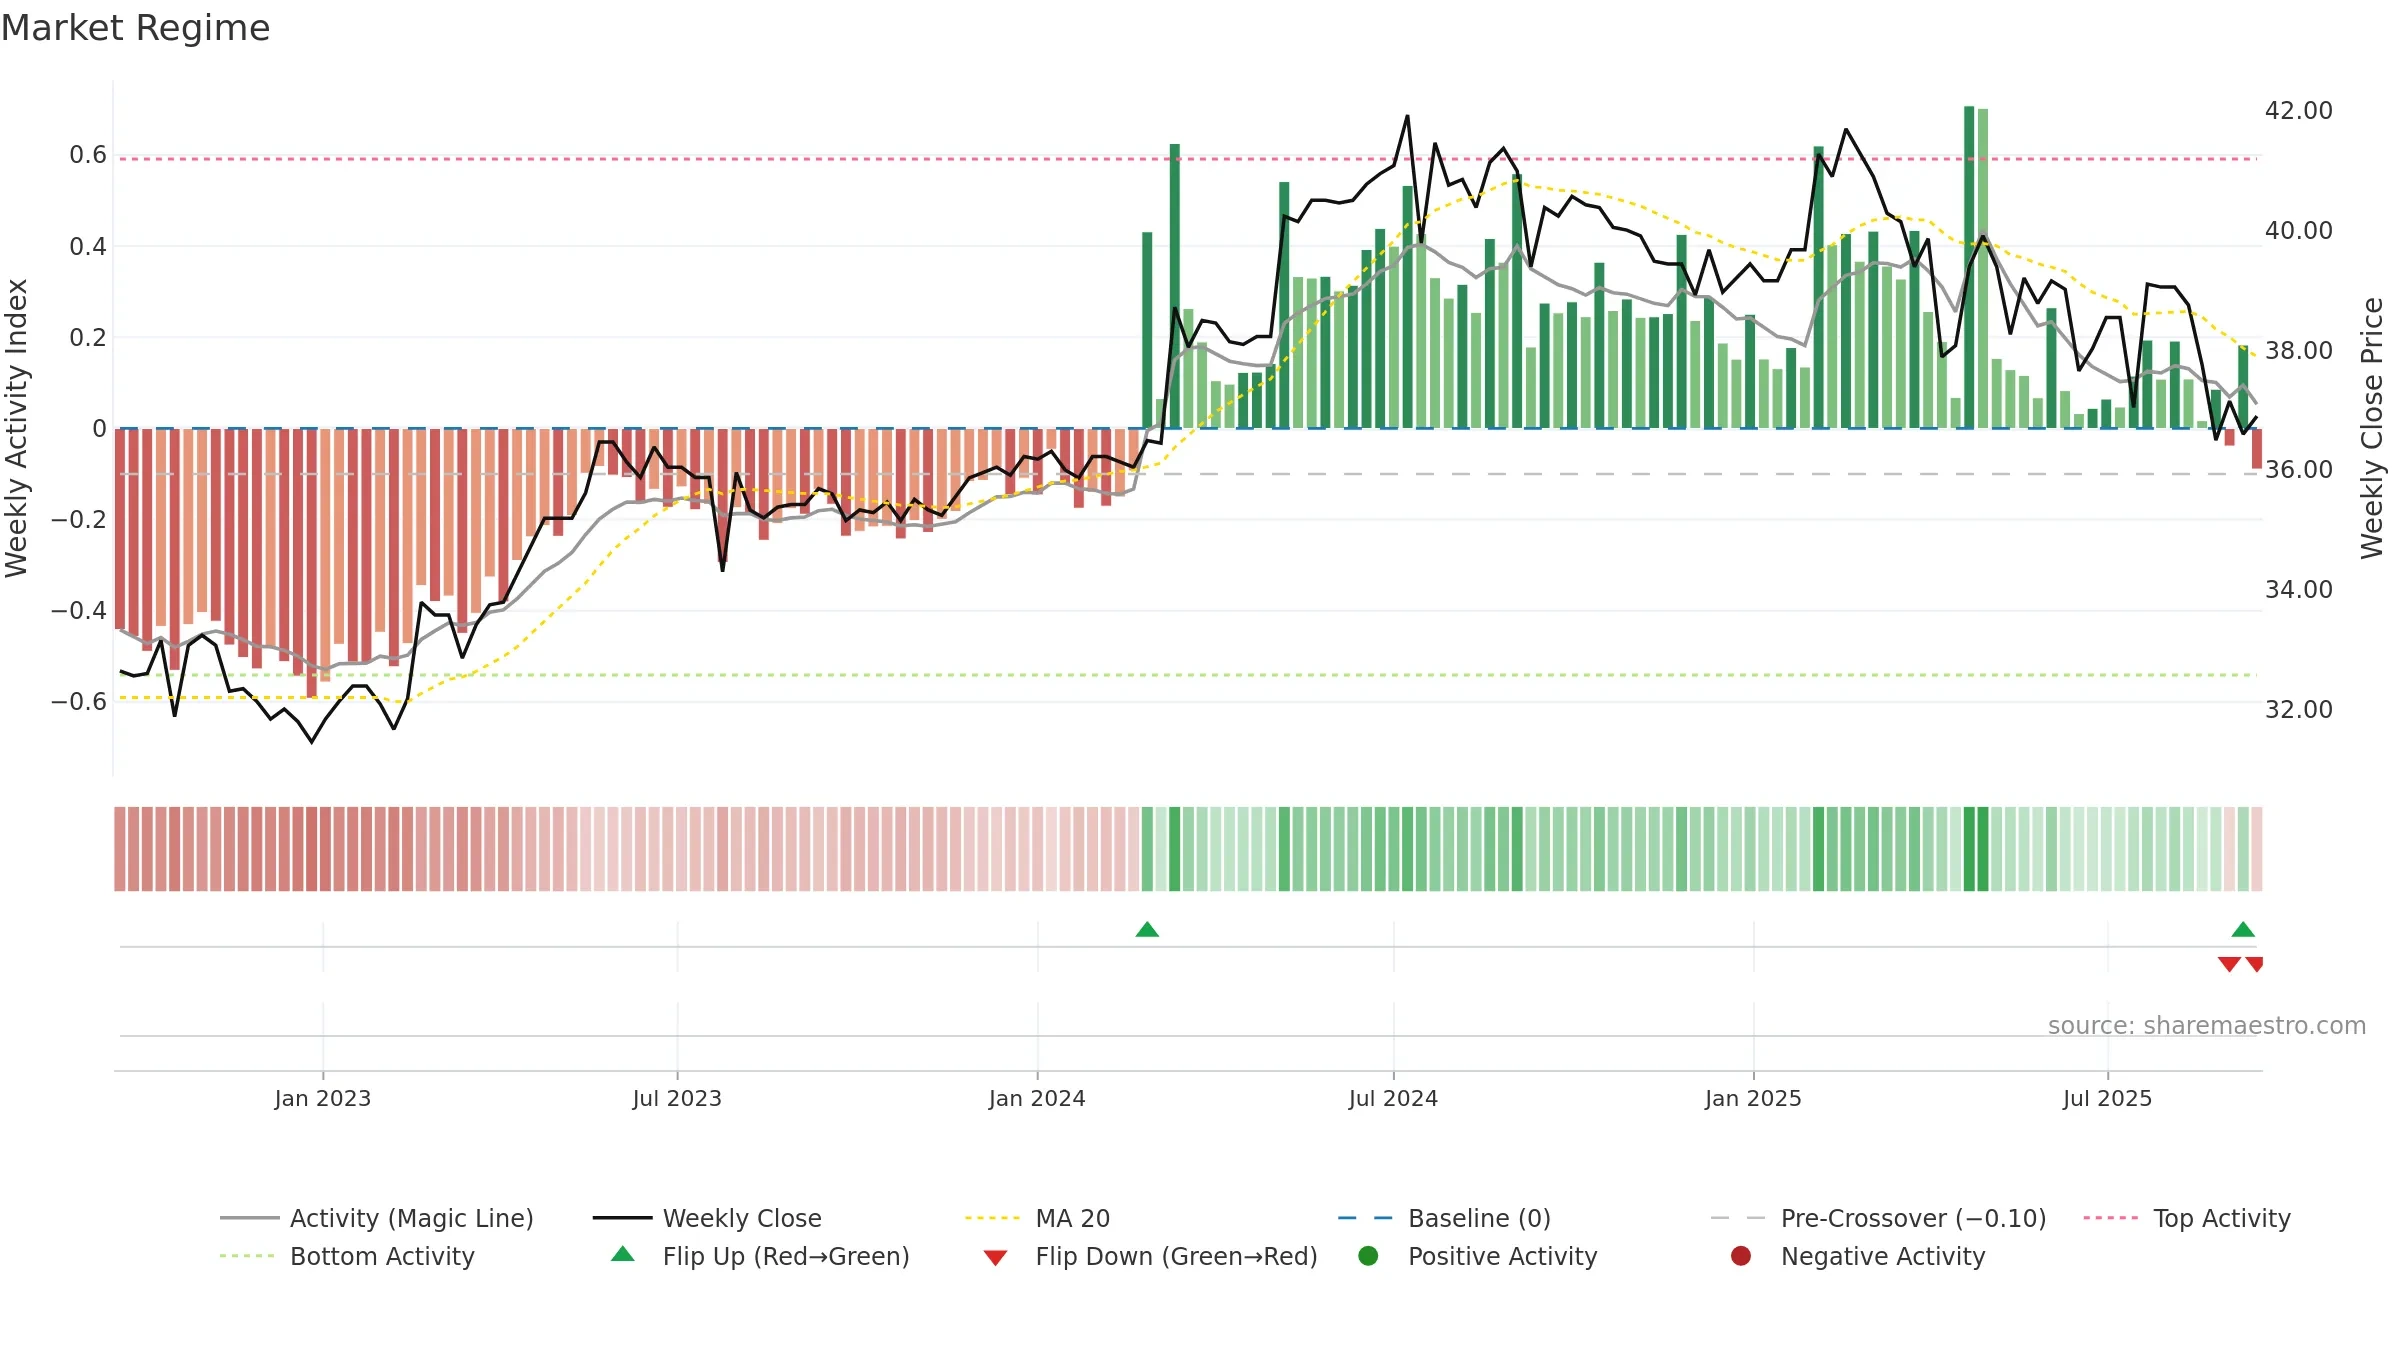
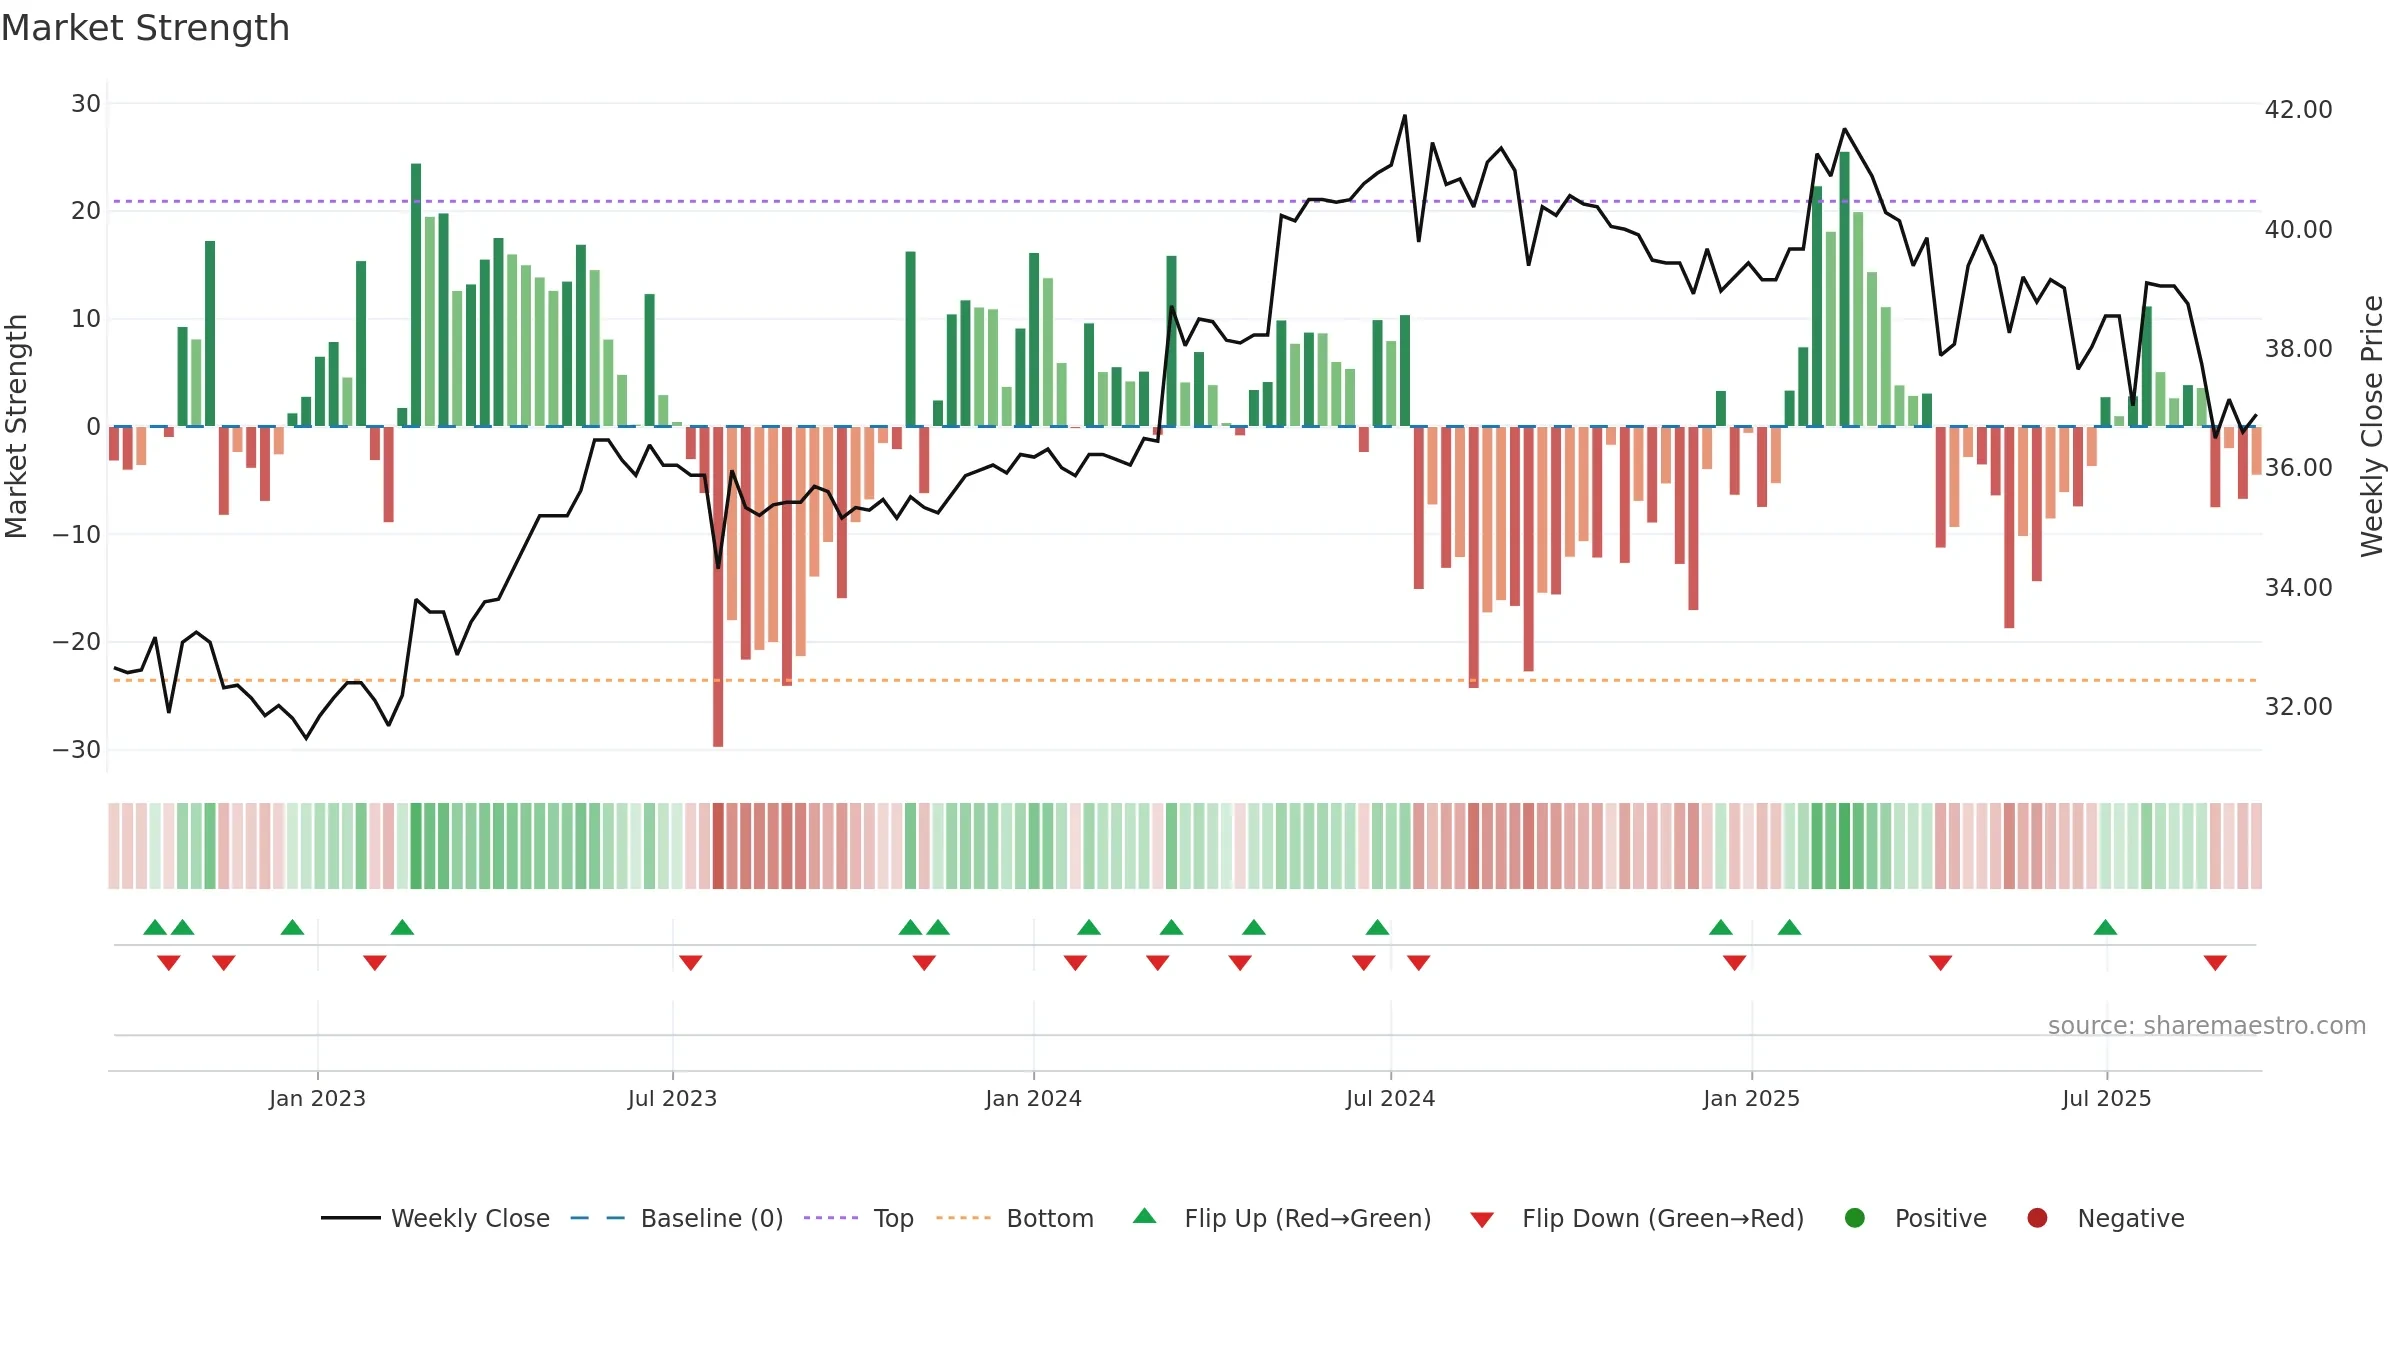
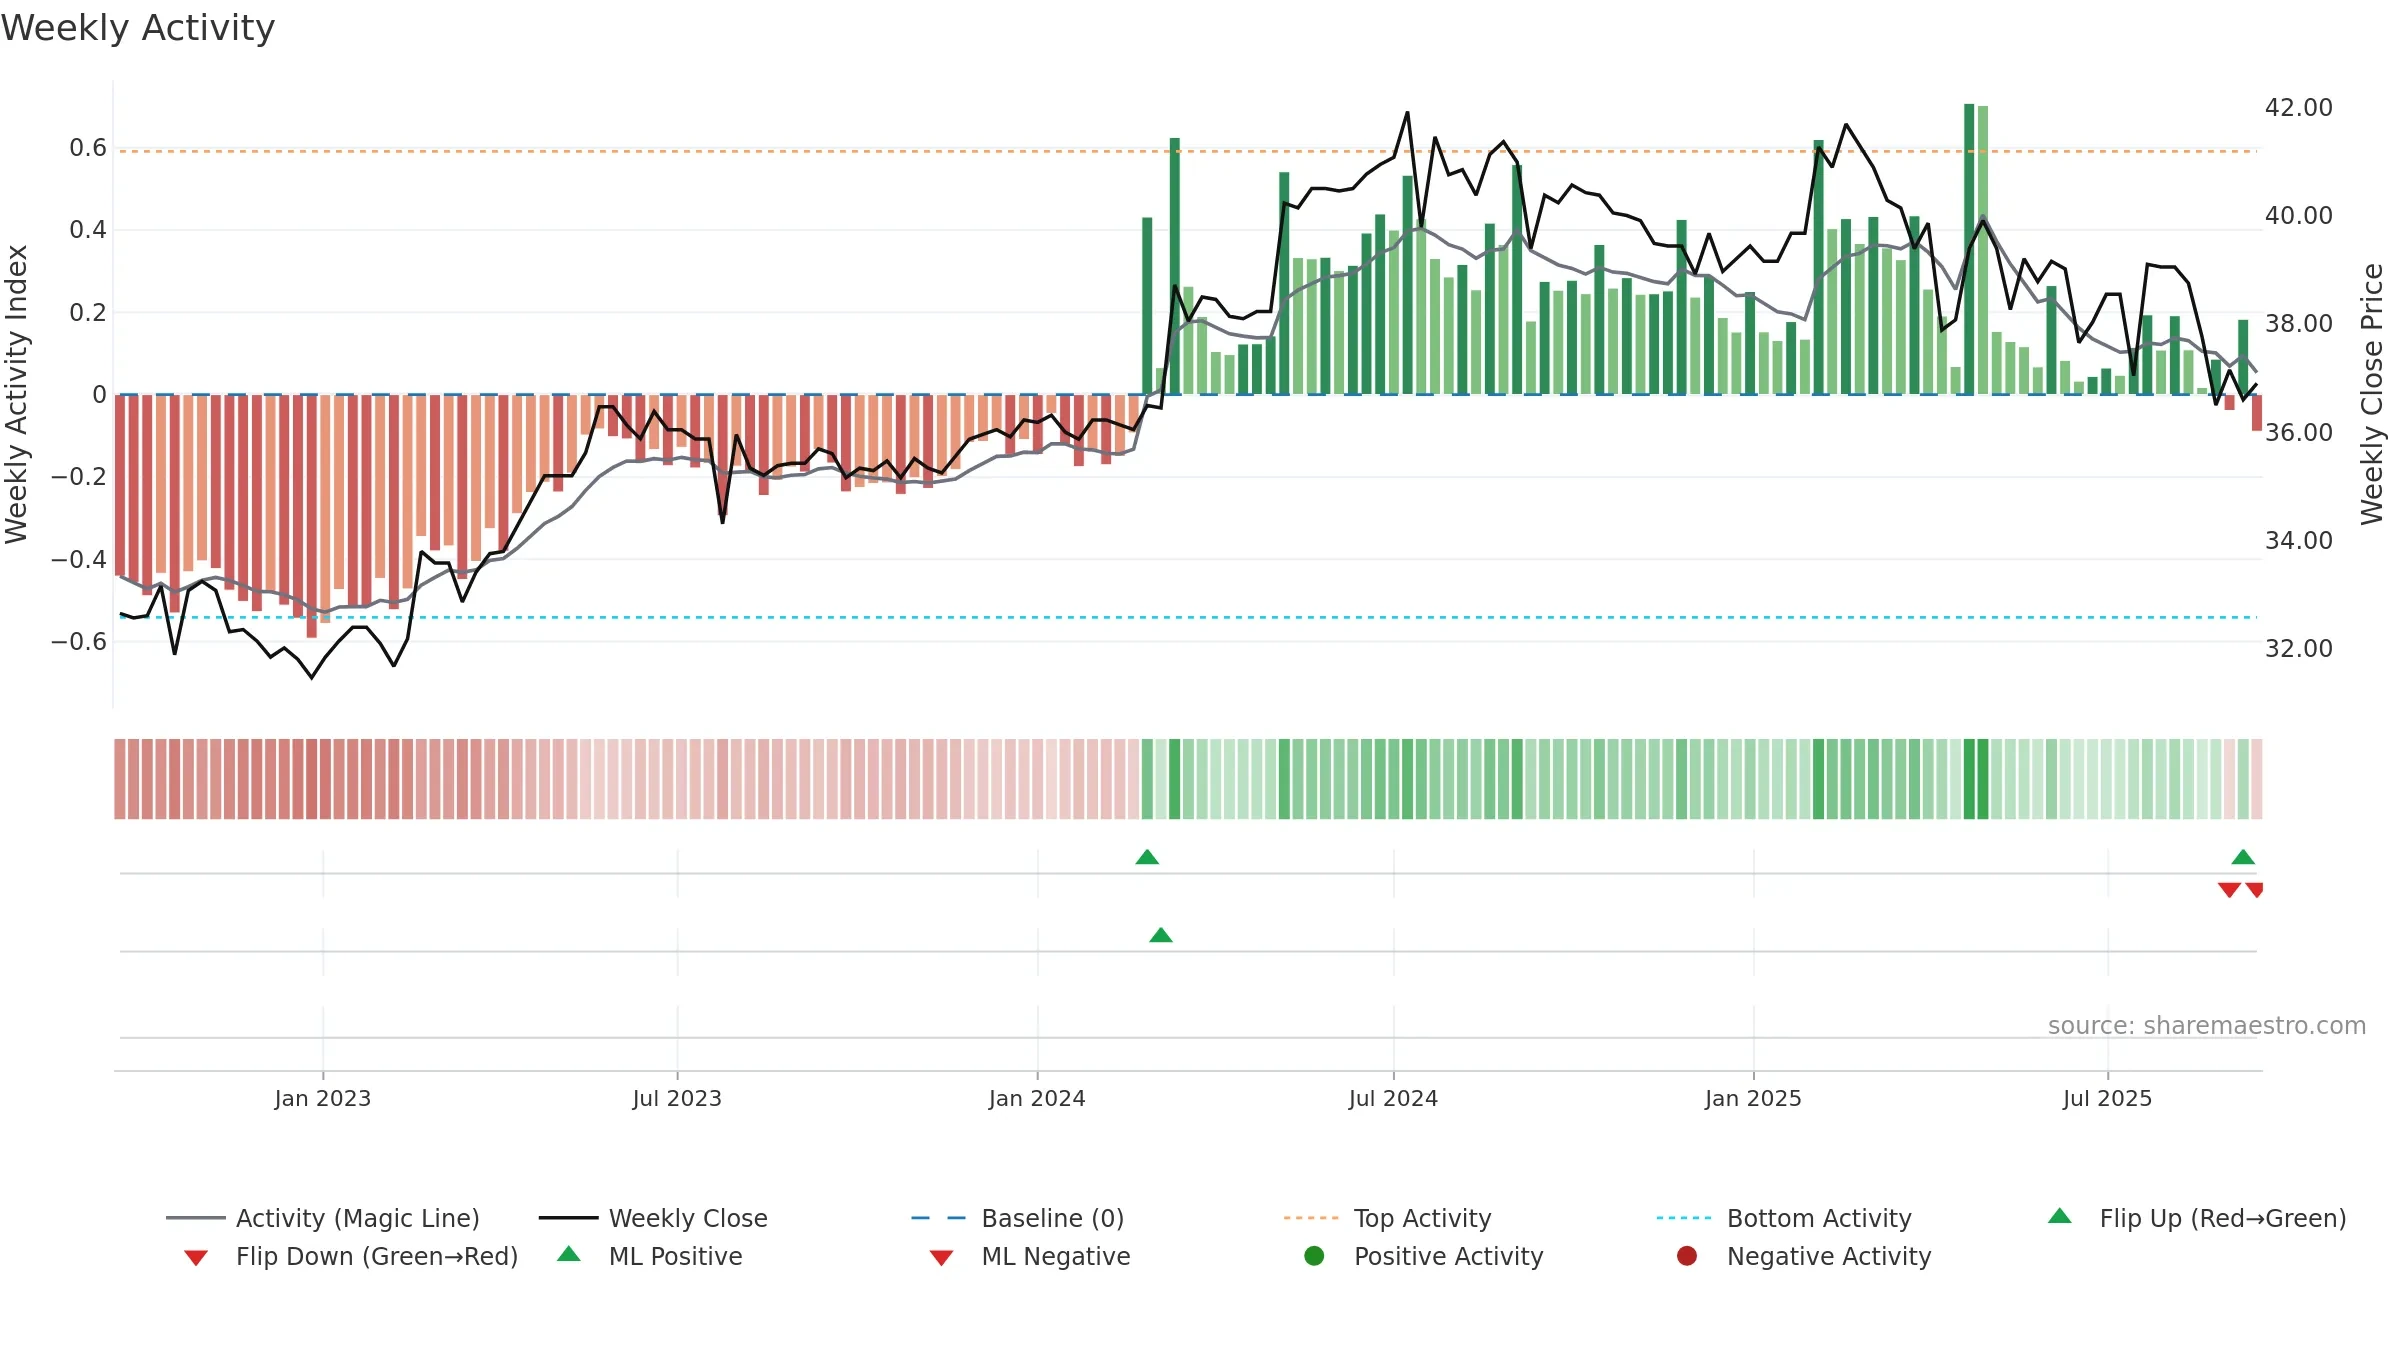
How to read this — Price slope is downward, indicating persistent supply pressure. Low weekly volatility favours steadier follow-through. Volume trend diverges from price — watch for fatigue or rotation. Returns are negatively correlated with volume — strength may come on lighter activity. Distance to baseline is narrowing — reverting closer to its fair-value track. Weak MA stack argues for caution; rallies can fail near the 8–13 week region. Price sits below key averages, keeping pressure on the tape.
Down-slope argues for patience; rallies can fade sooner unless participation improves. Because liquidity isn’t confirming, prefer evidence of fresh demand before chasing moves.
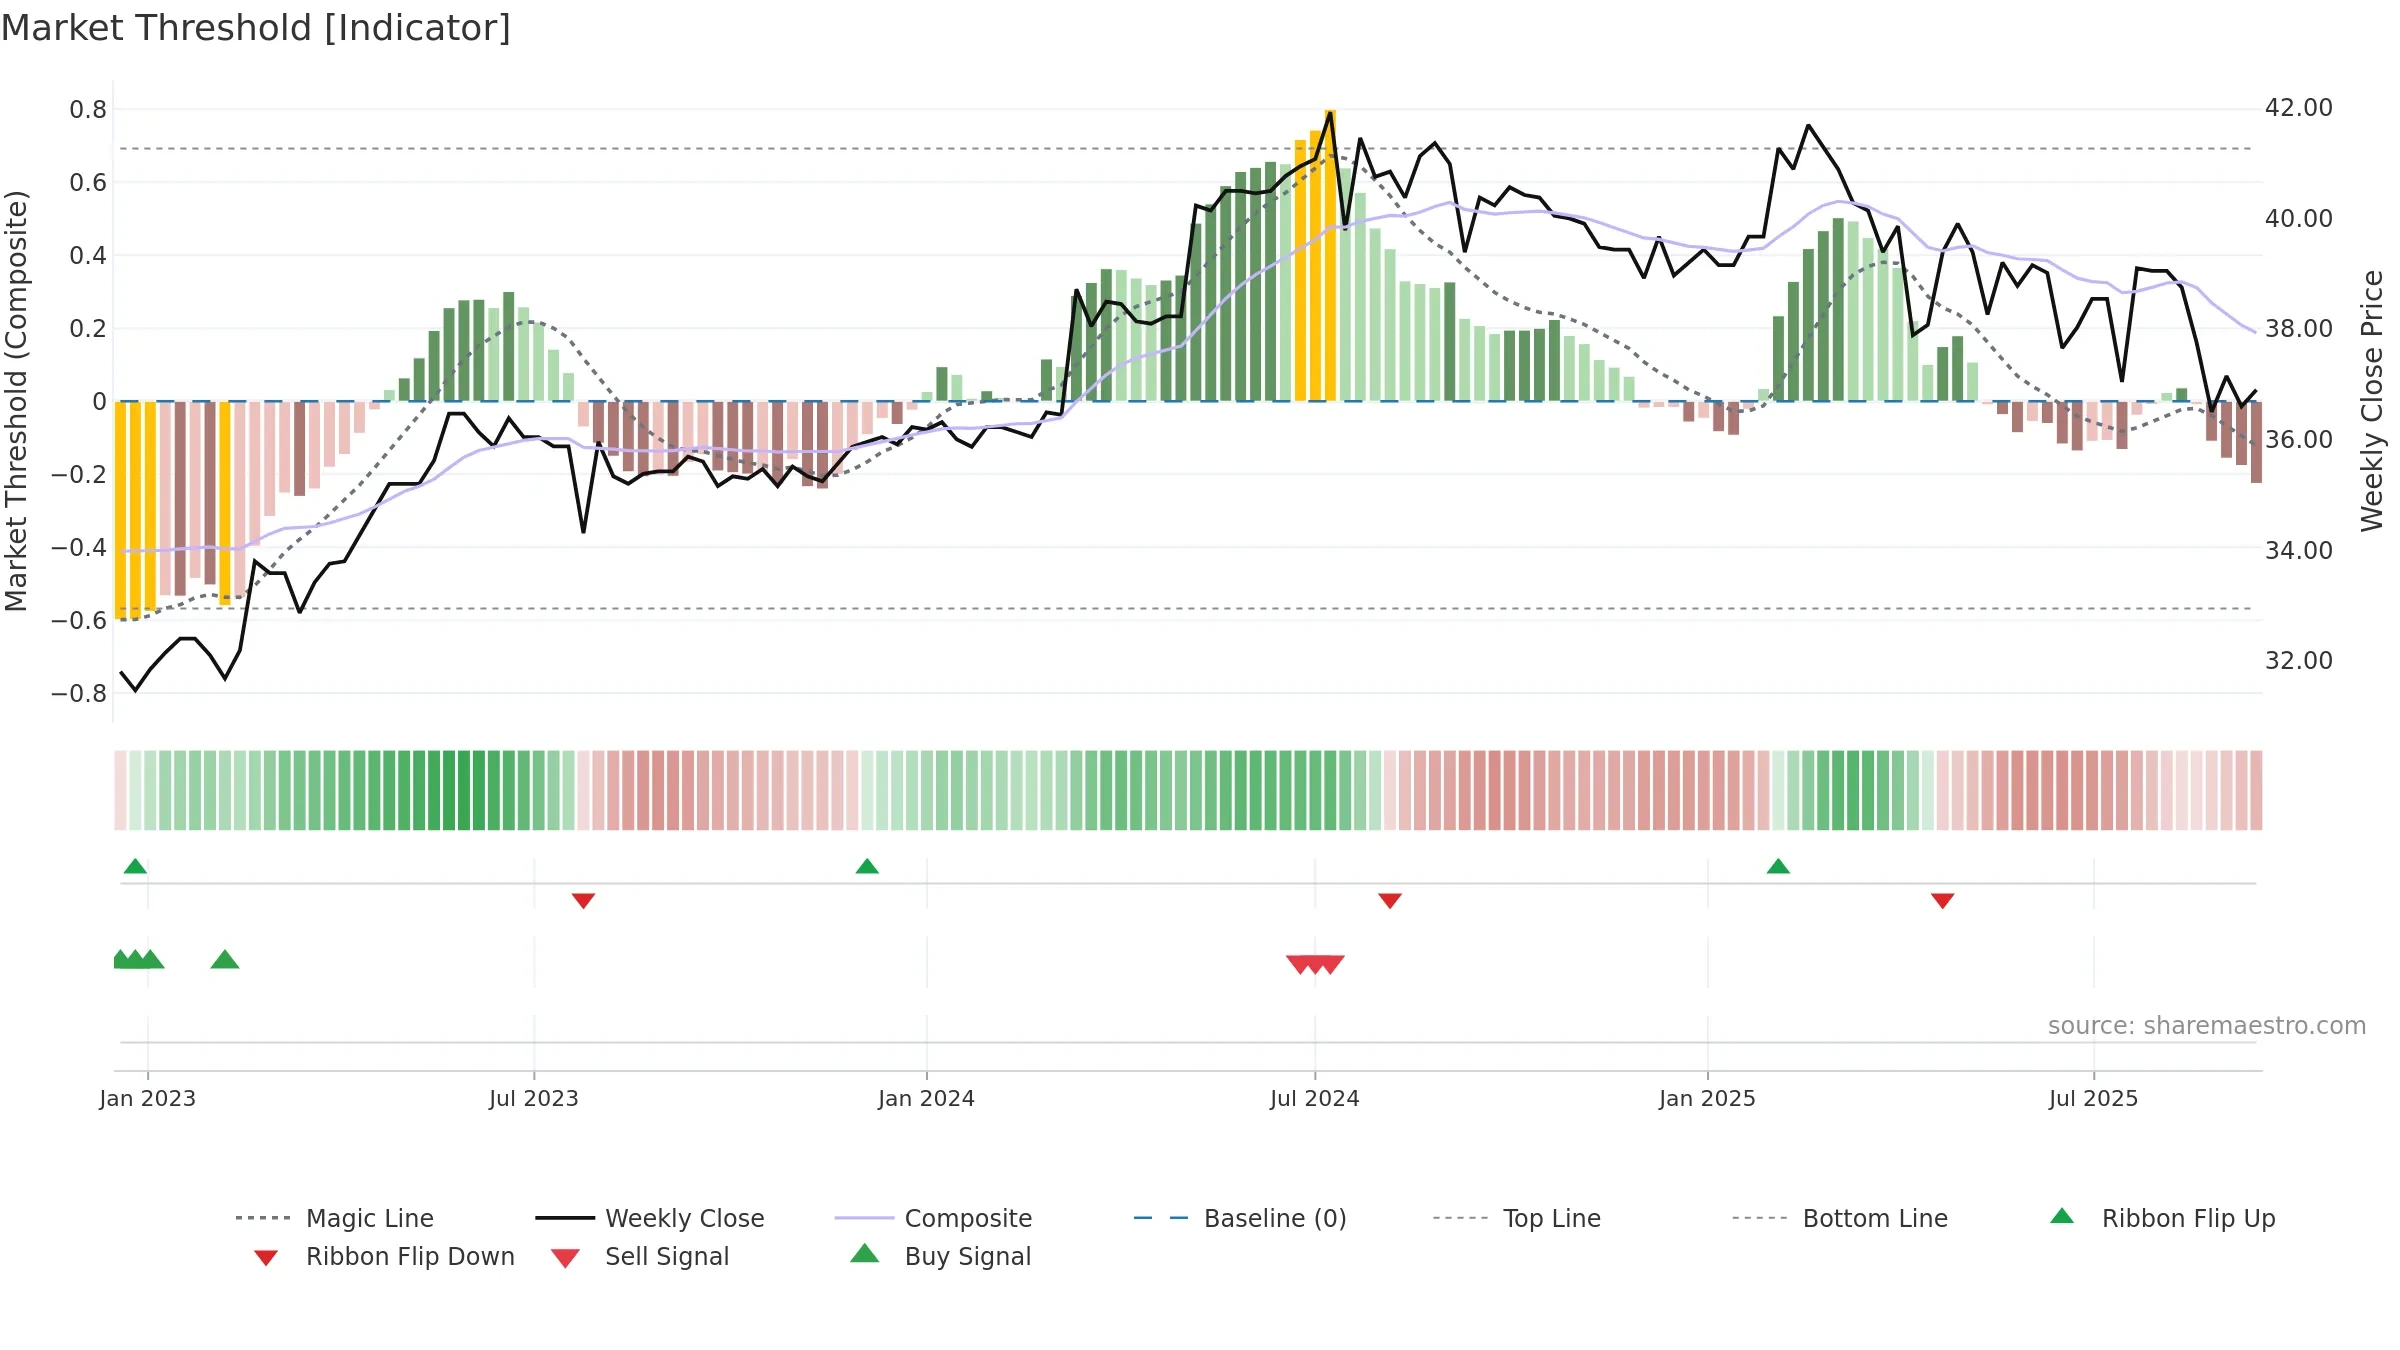
Gauge maps the trend signal to a 0–100 scale.
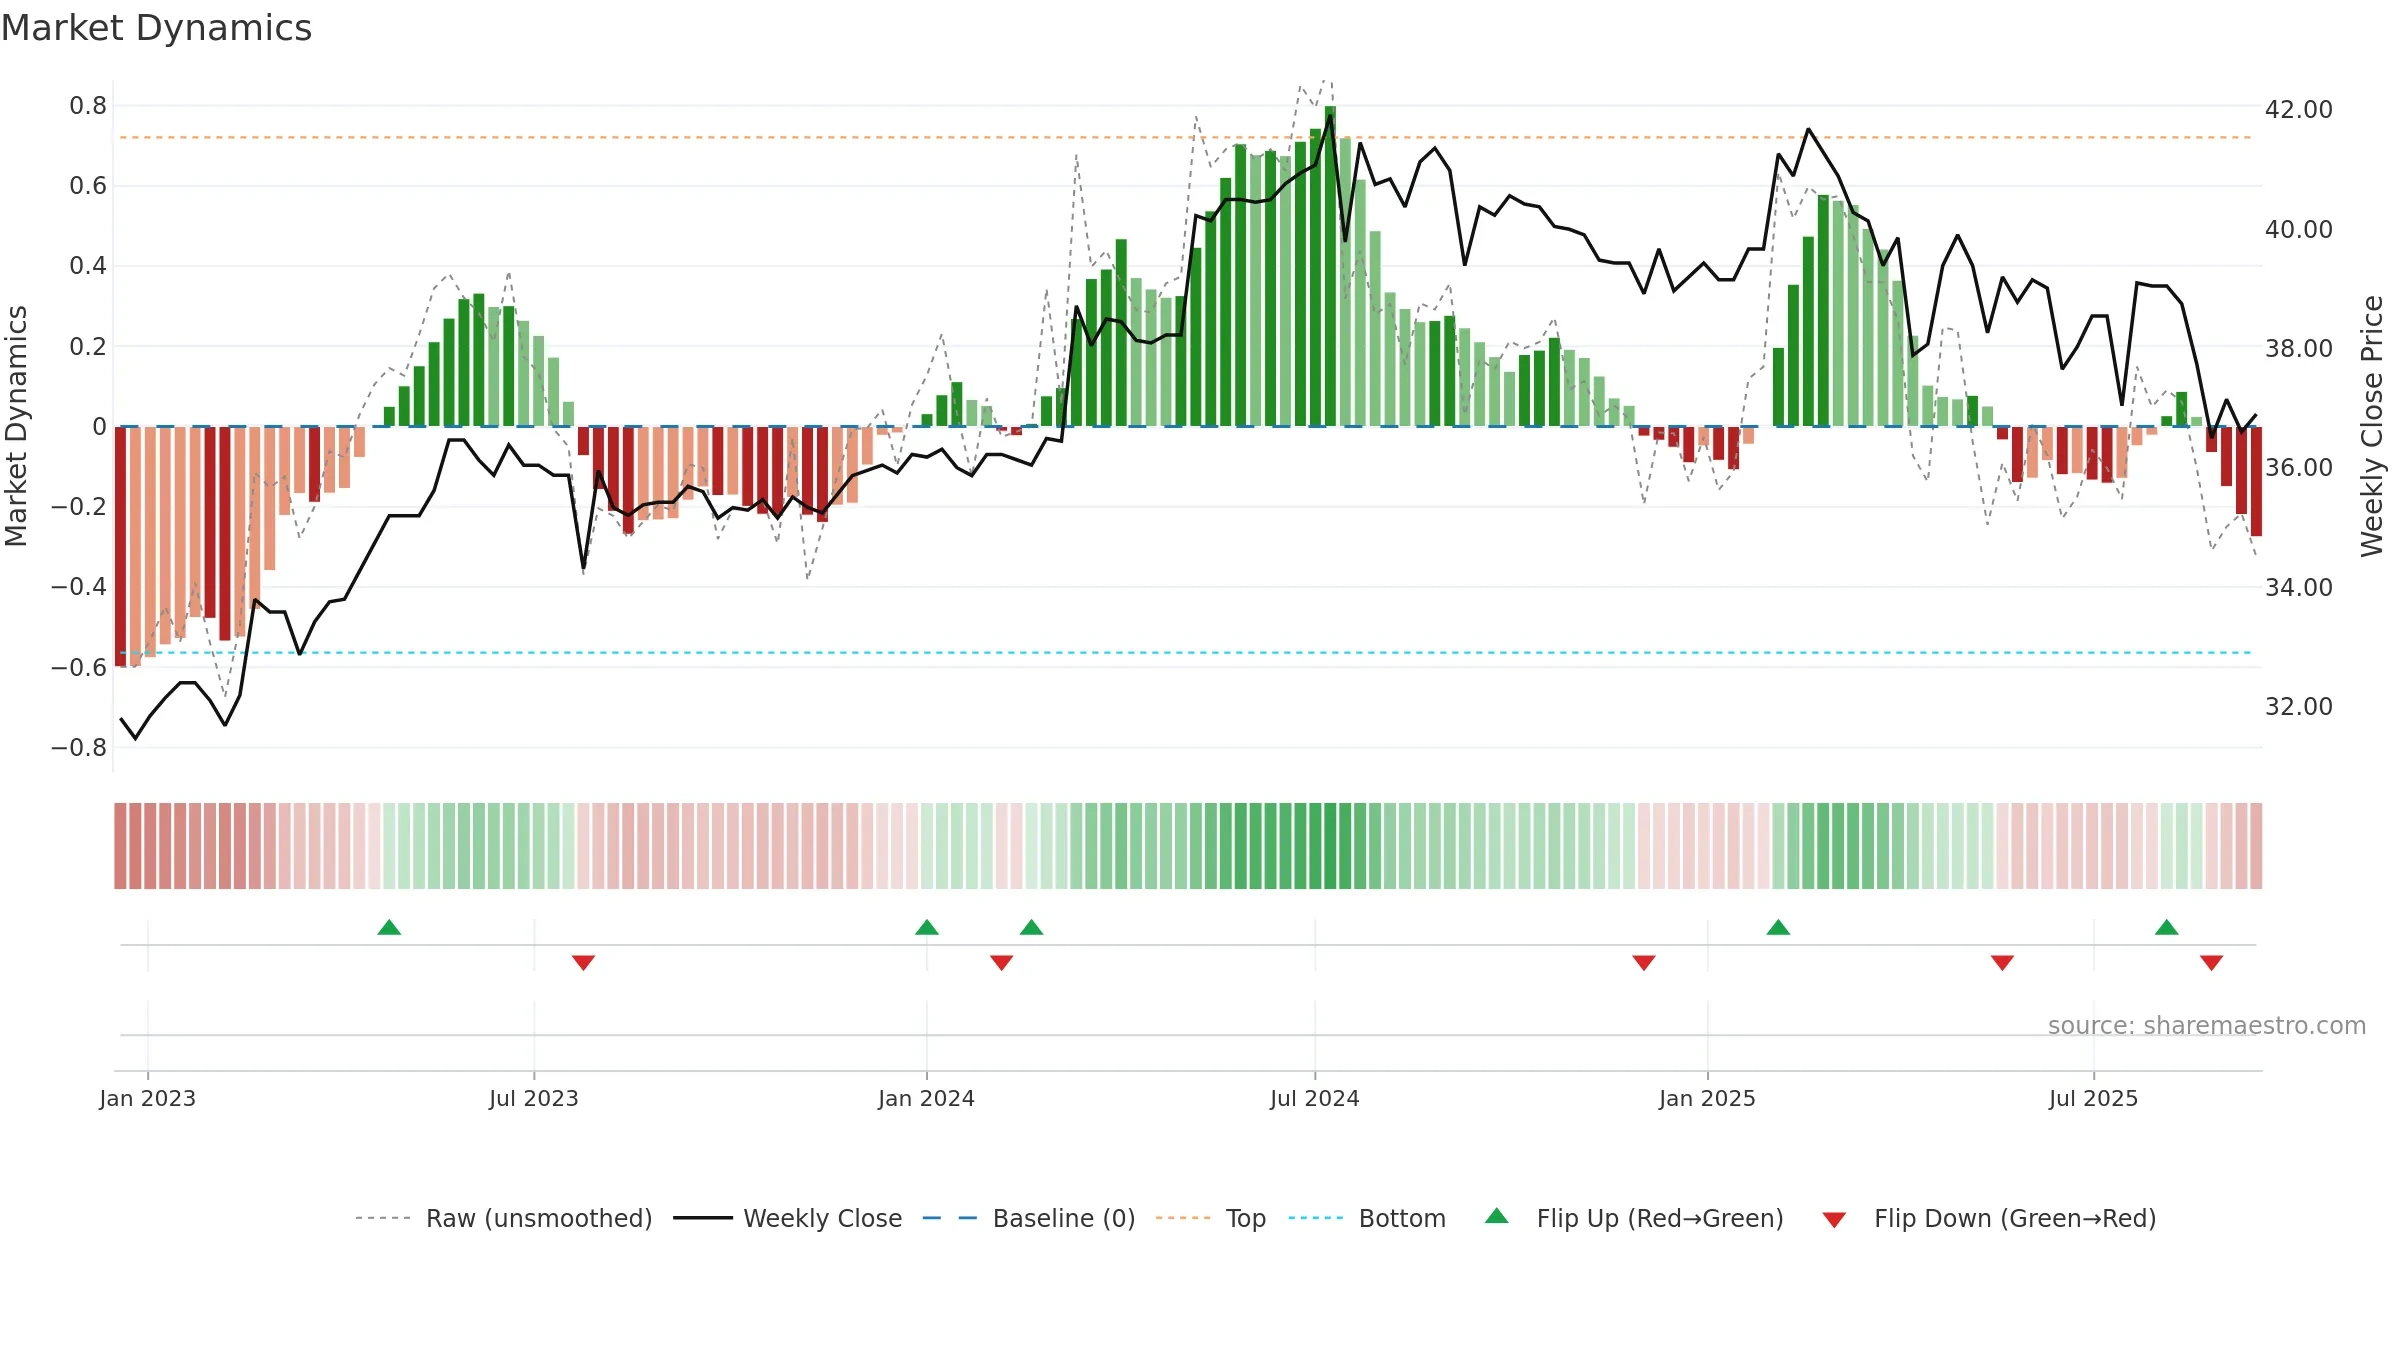
How to read this — Bearish backdrop but short-term momentum is improving; confirmation still needed.
Early improvement — look for a reclaim of 0.50→0.60 to validate.
The flag is positive: favourable upside skew with supportive conditions.
Conclusion
Negative setup. ★★☆☆☆ confidence. Price window: -5. Trend: Bottoming Attempt; gauge 25. In combination, liquidity diverges from price.
- Early improvement from bearish zone (bottoming attempt)
- Low return volatility supports durability
- Buyers step in at depressed levels (accumulation)
- Momentum is weak/falling
- Price is not above key averages
- Weak moving-average stack
- Liquidity diverges from price
Why: Price window -5.51% over 8w. Close is -5.51% below the prior-window high. Return volatility 1.26%. Volume trend rising. Liquidity divergence with price. Trend state bottoming attempt. Low-regime (≤0.25) upticks 3/4 (75.0%) • Accumulating. MA stack weak. Momentum bearish and rising. Valuation stance positive.
Tip: Most metrics include a hover tooltip where they appear in the report.