ADAMA Ltd.
000553 SHE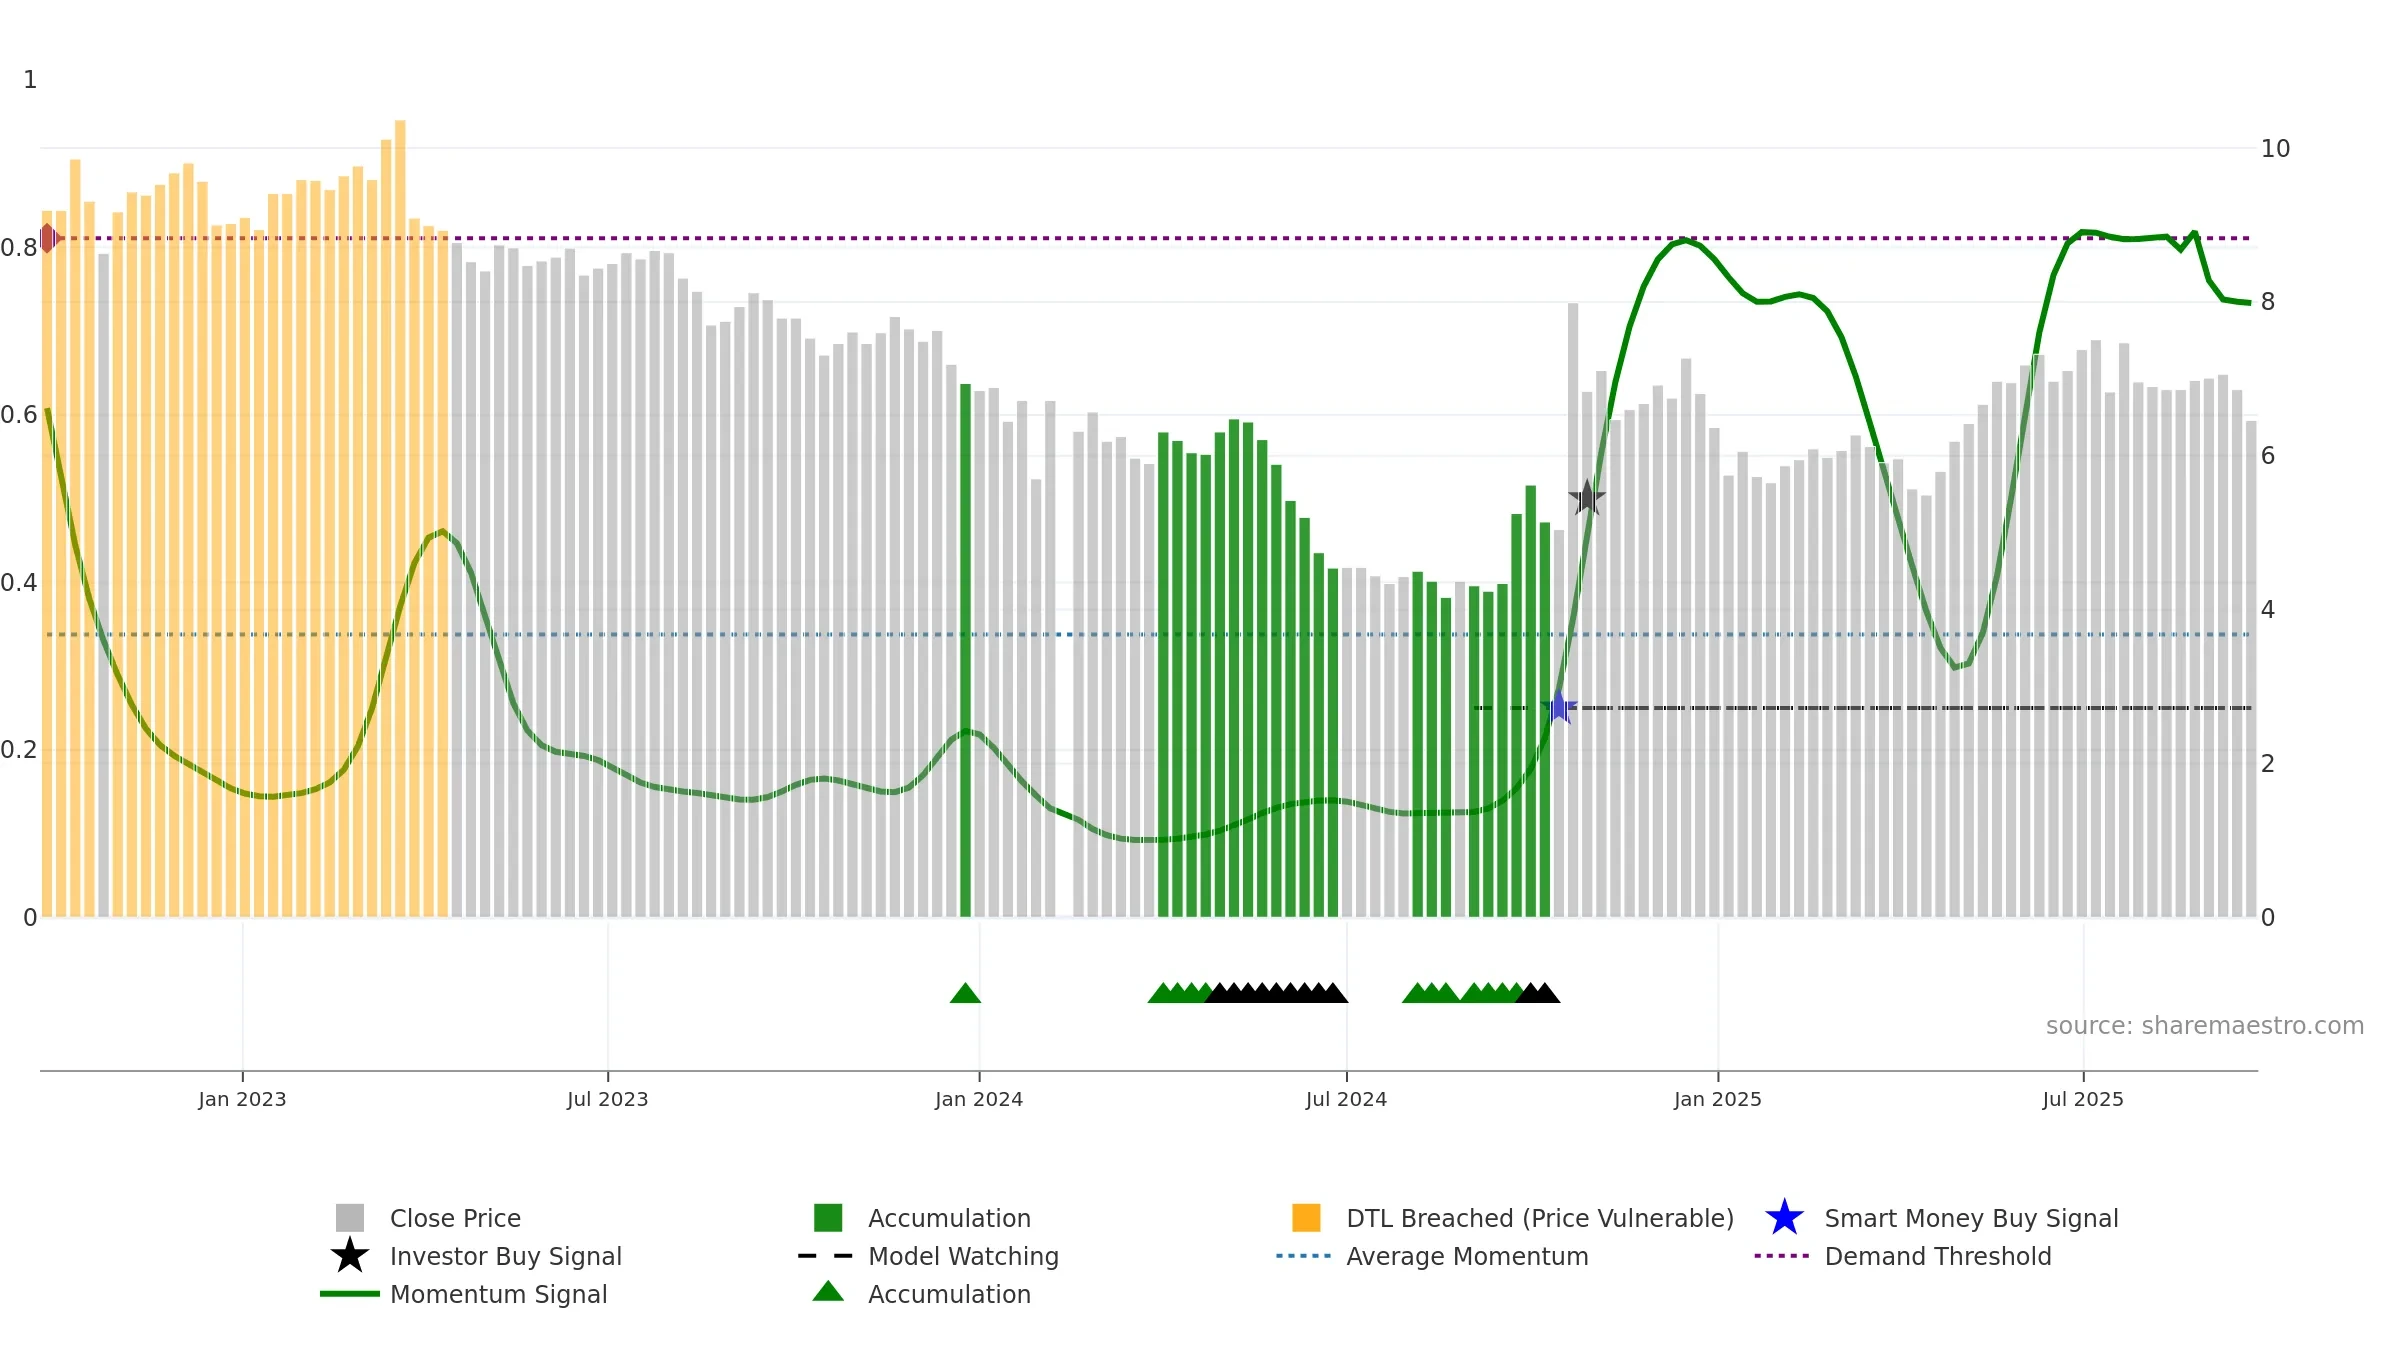
Weekly Summary
ADAMA Ltd. closed at 6.4600 (-2.42% WoW) . Data window ends Mon, 22 Sep 2025.
How to read this — Price slope is downward, indicating persistent supply pressure. Low weekly volatility favours steadier follow-through. Volume and price are moving in the same direction — a constructive confirmation. Fresh short-term downside crossover weakens near-term tone. Price sits below key averages, keeping pressure on the tape.
Down-slope argues for patience; rallies can fade sooner unless participation improves.
Gauge maps the trend signal to a 0–100 scale.
How to read this — Gauge is elevated but momentum is rolling over; topping risk is rising.
Stay alert: protect gains or seek confirmation before adding risk.

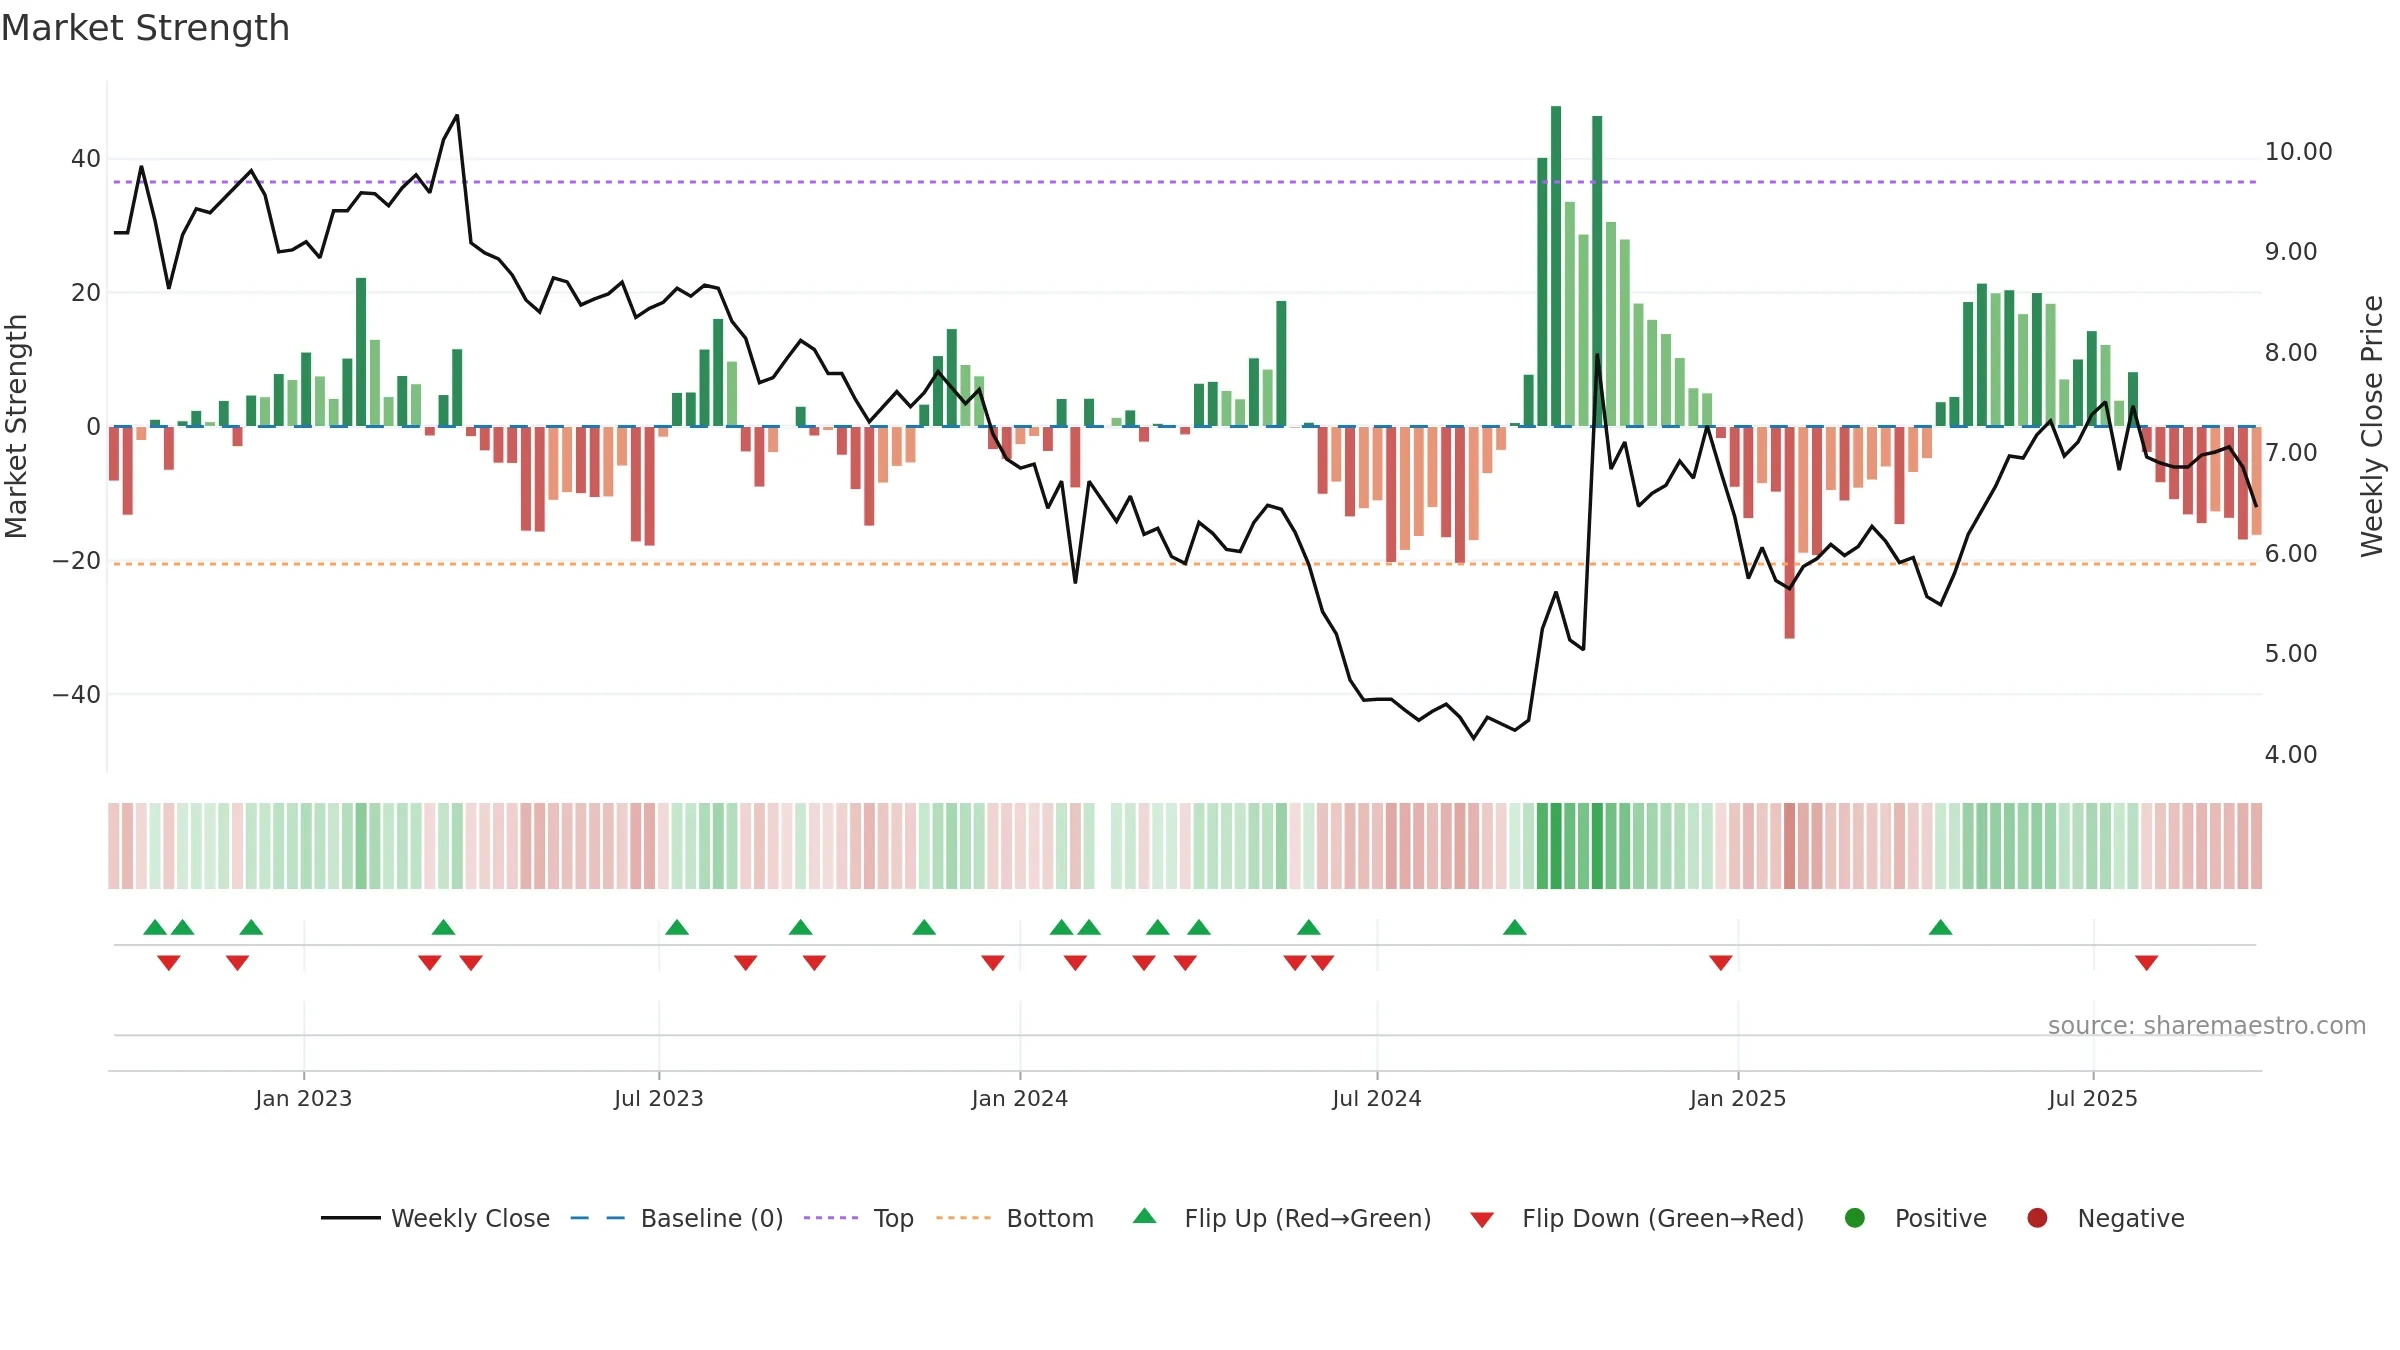
Relative strength is Negative
(< 0%, underperforming).
Latest MRS: -9.10% (week ending Fri, 19 Sep 2025).
Slope: Falling over 8w.
Notes:
- Below zero line indicates relative weakness vs benchmark.
- MRS slope falling over ~8 weeks.
Price is above fair value; upside may be capped without catalysts.
Conclusion
Negative setup. ★⯪☆☆☆ confidence. Trend: Uptrend at Risk · -6.38% over window · vol 1.56% · liquidity convergence · posture below · RS weak
- Liquidity confirms the price trend
- Low return volatility supports durability
- High level but momentum rolling over (topping risk)
- Momentum is weak/falling
- Price is not above key averages
- Negative multi-week performance
Why: Price window -6.38% over w. Close is -8.50% below the prior-window high. Return volatility 1.56%. Volume trend falling. Liquidity convergence with price. Trend state uptrend at risk. 4–8w crossover bearish. Momentum neutral and falling. Valuation limited upside without catalysts.
Tip: Most metrics include a hover tooltip where they appear in the report.