RPMGlobal Holdings Limited
RUL ASX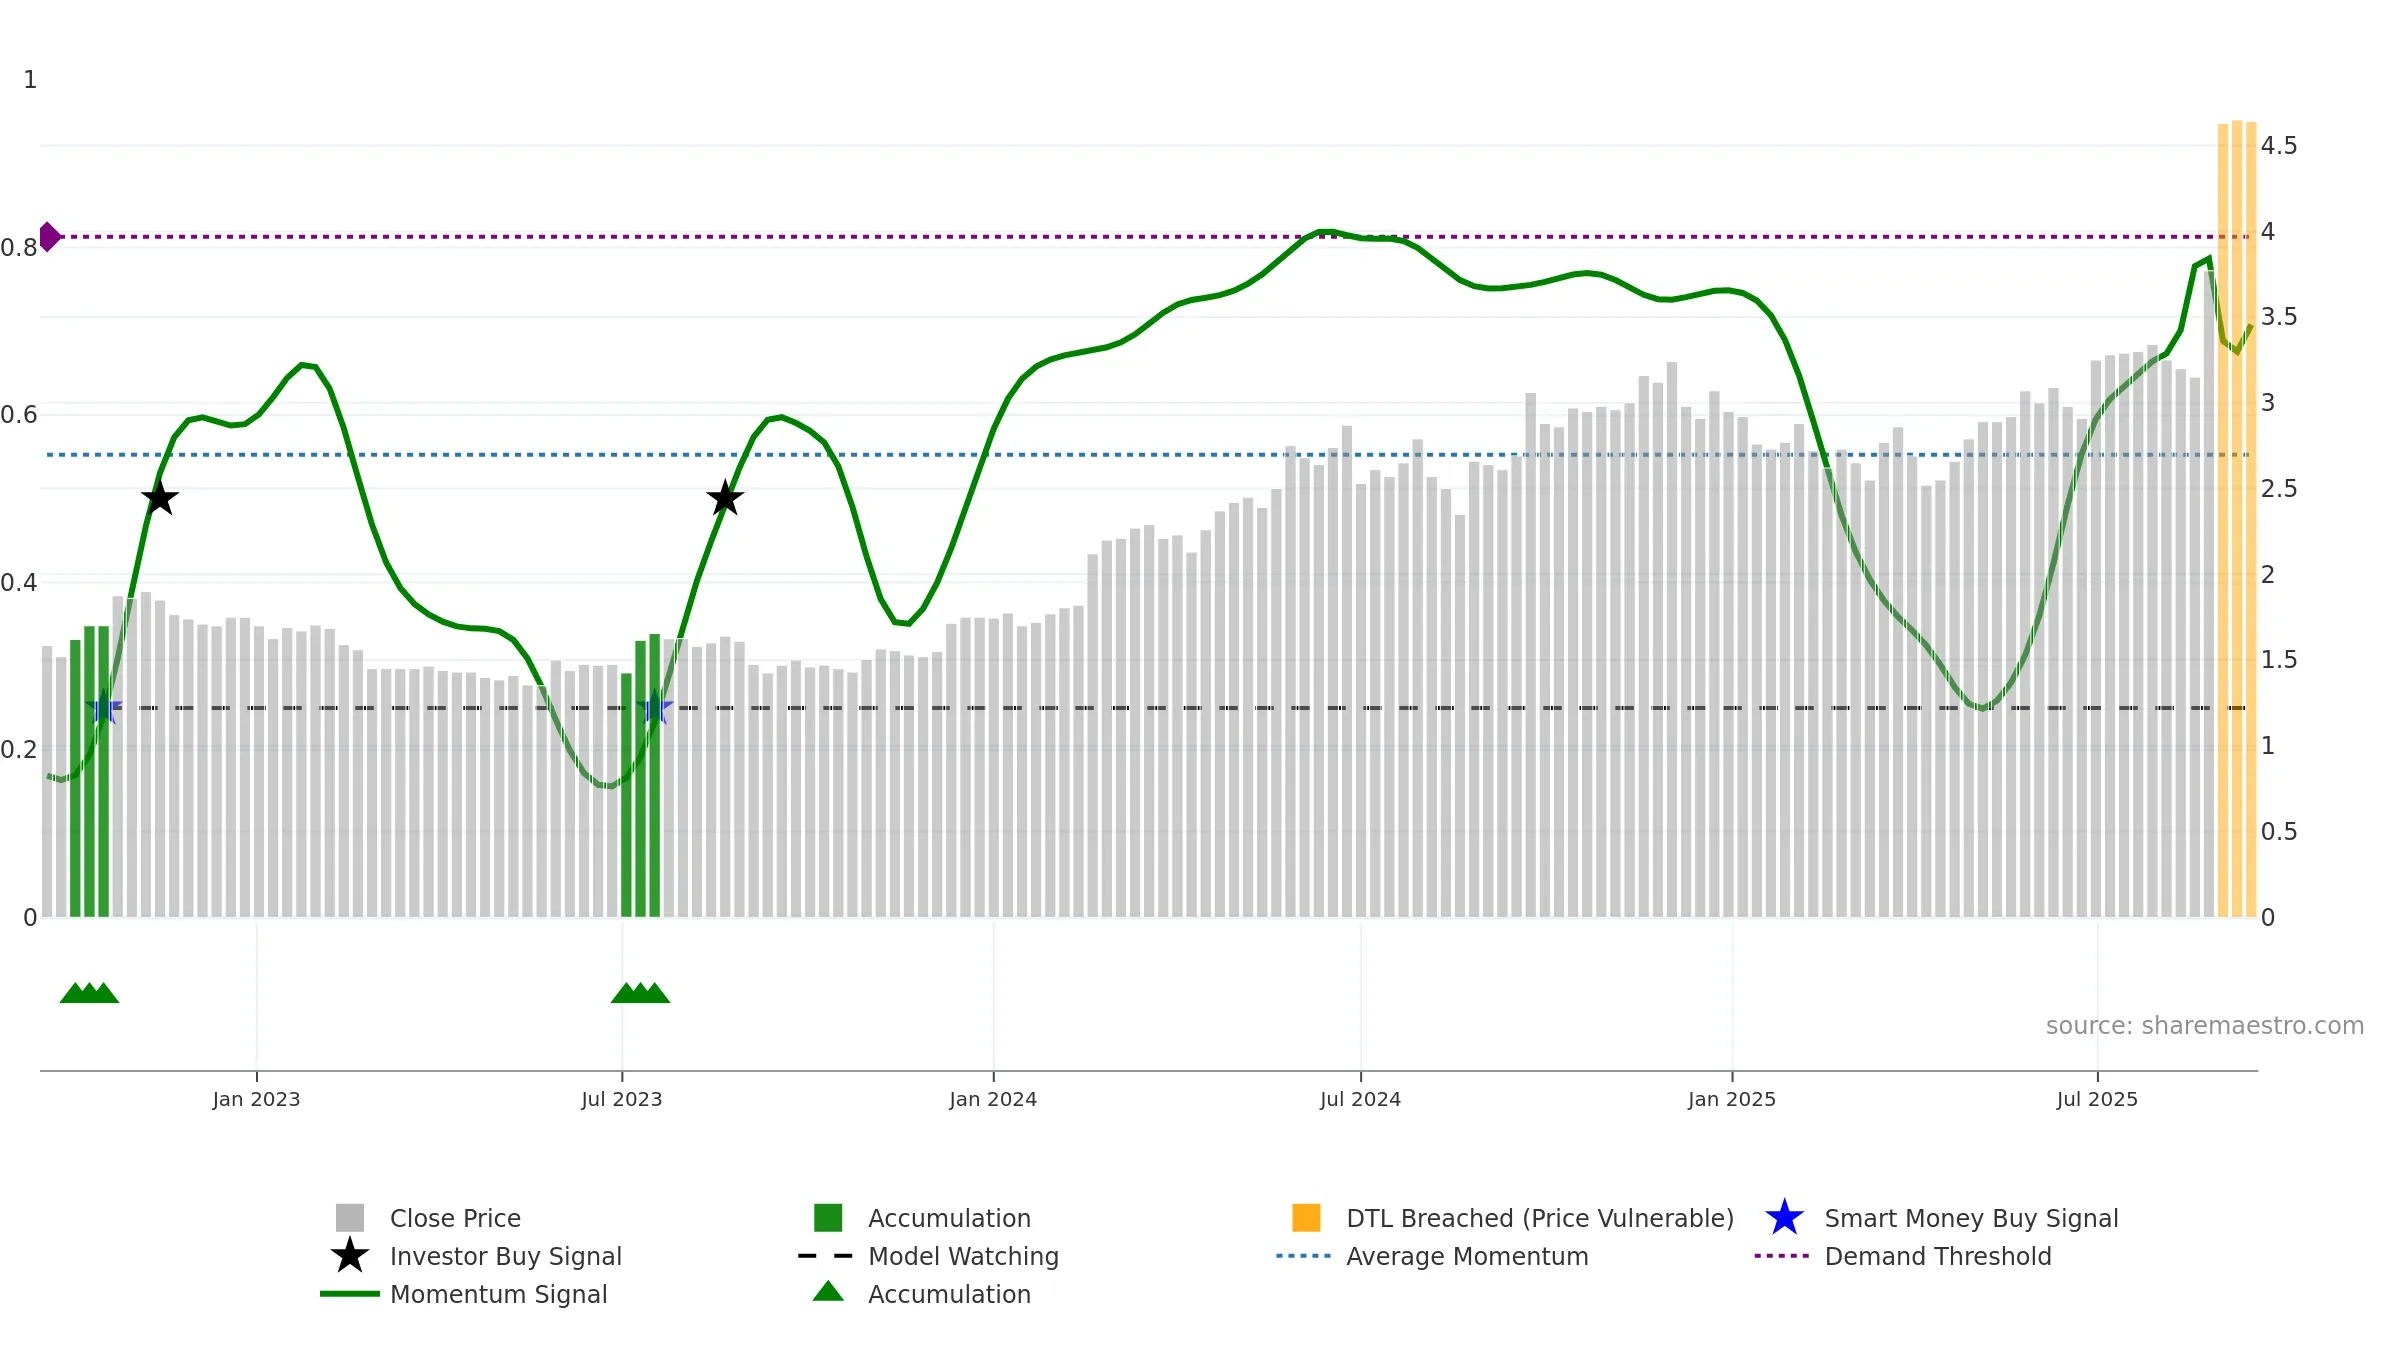
Weekly Report
RPMGlobal Holdings Limited closed at 4.6400 (0.00% WoW) . Data window ends Mon, 15 Sep 2025.
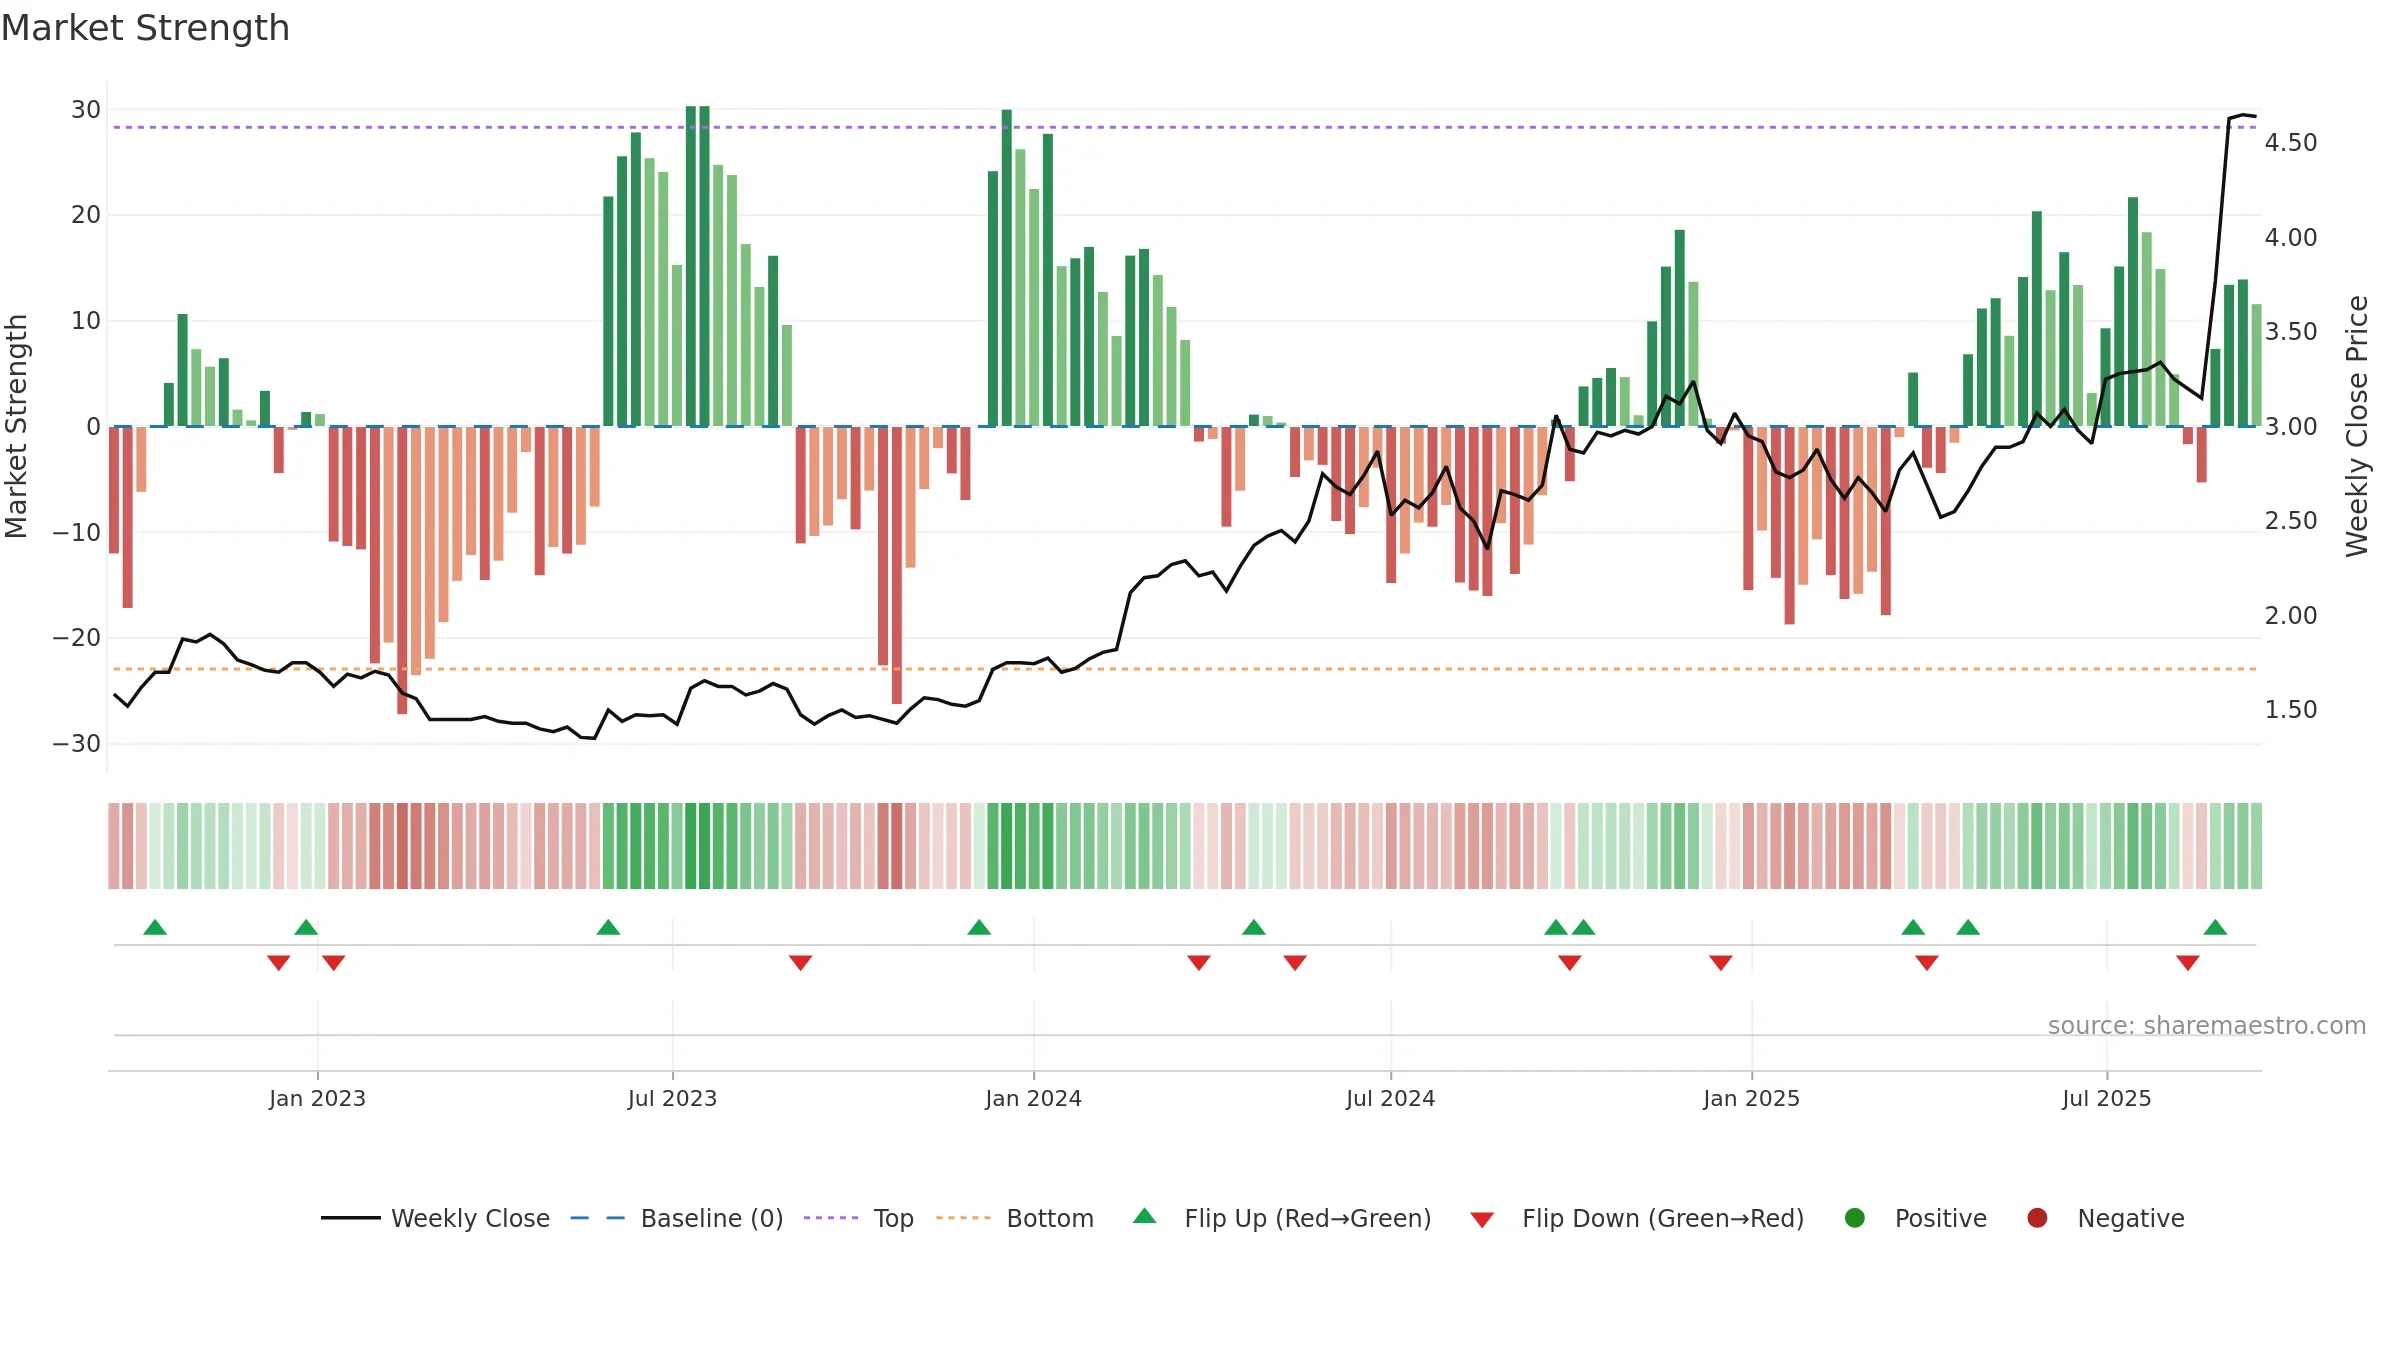
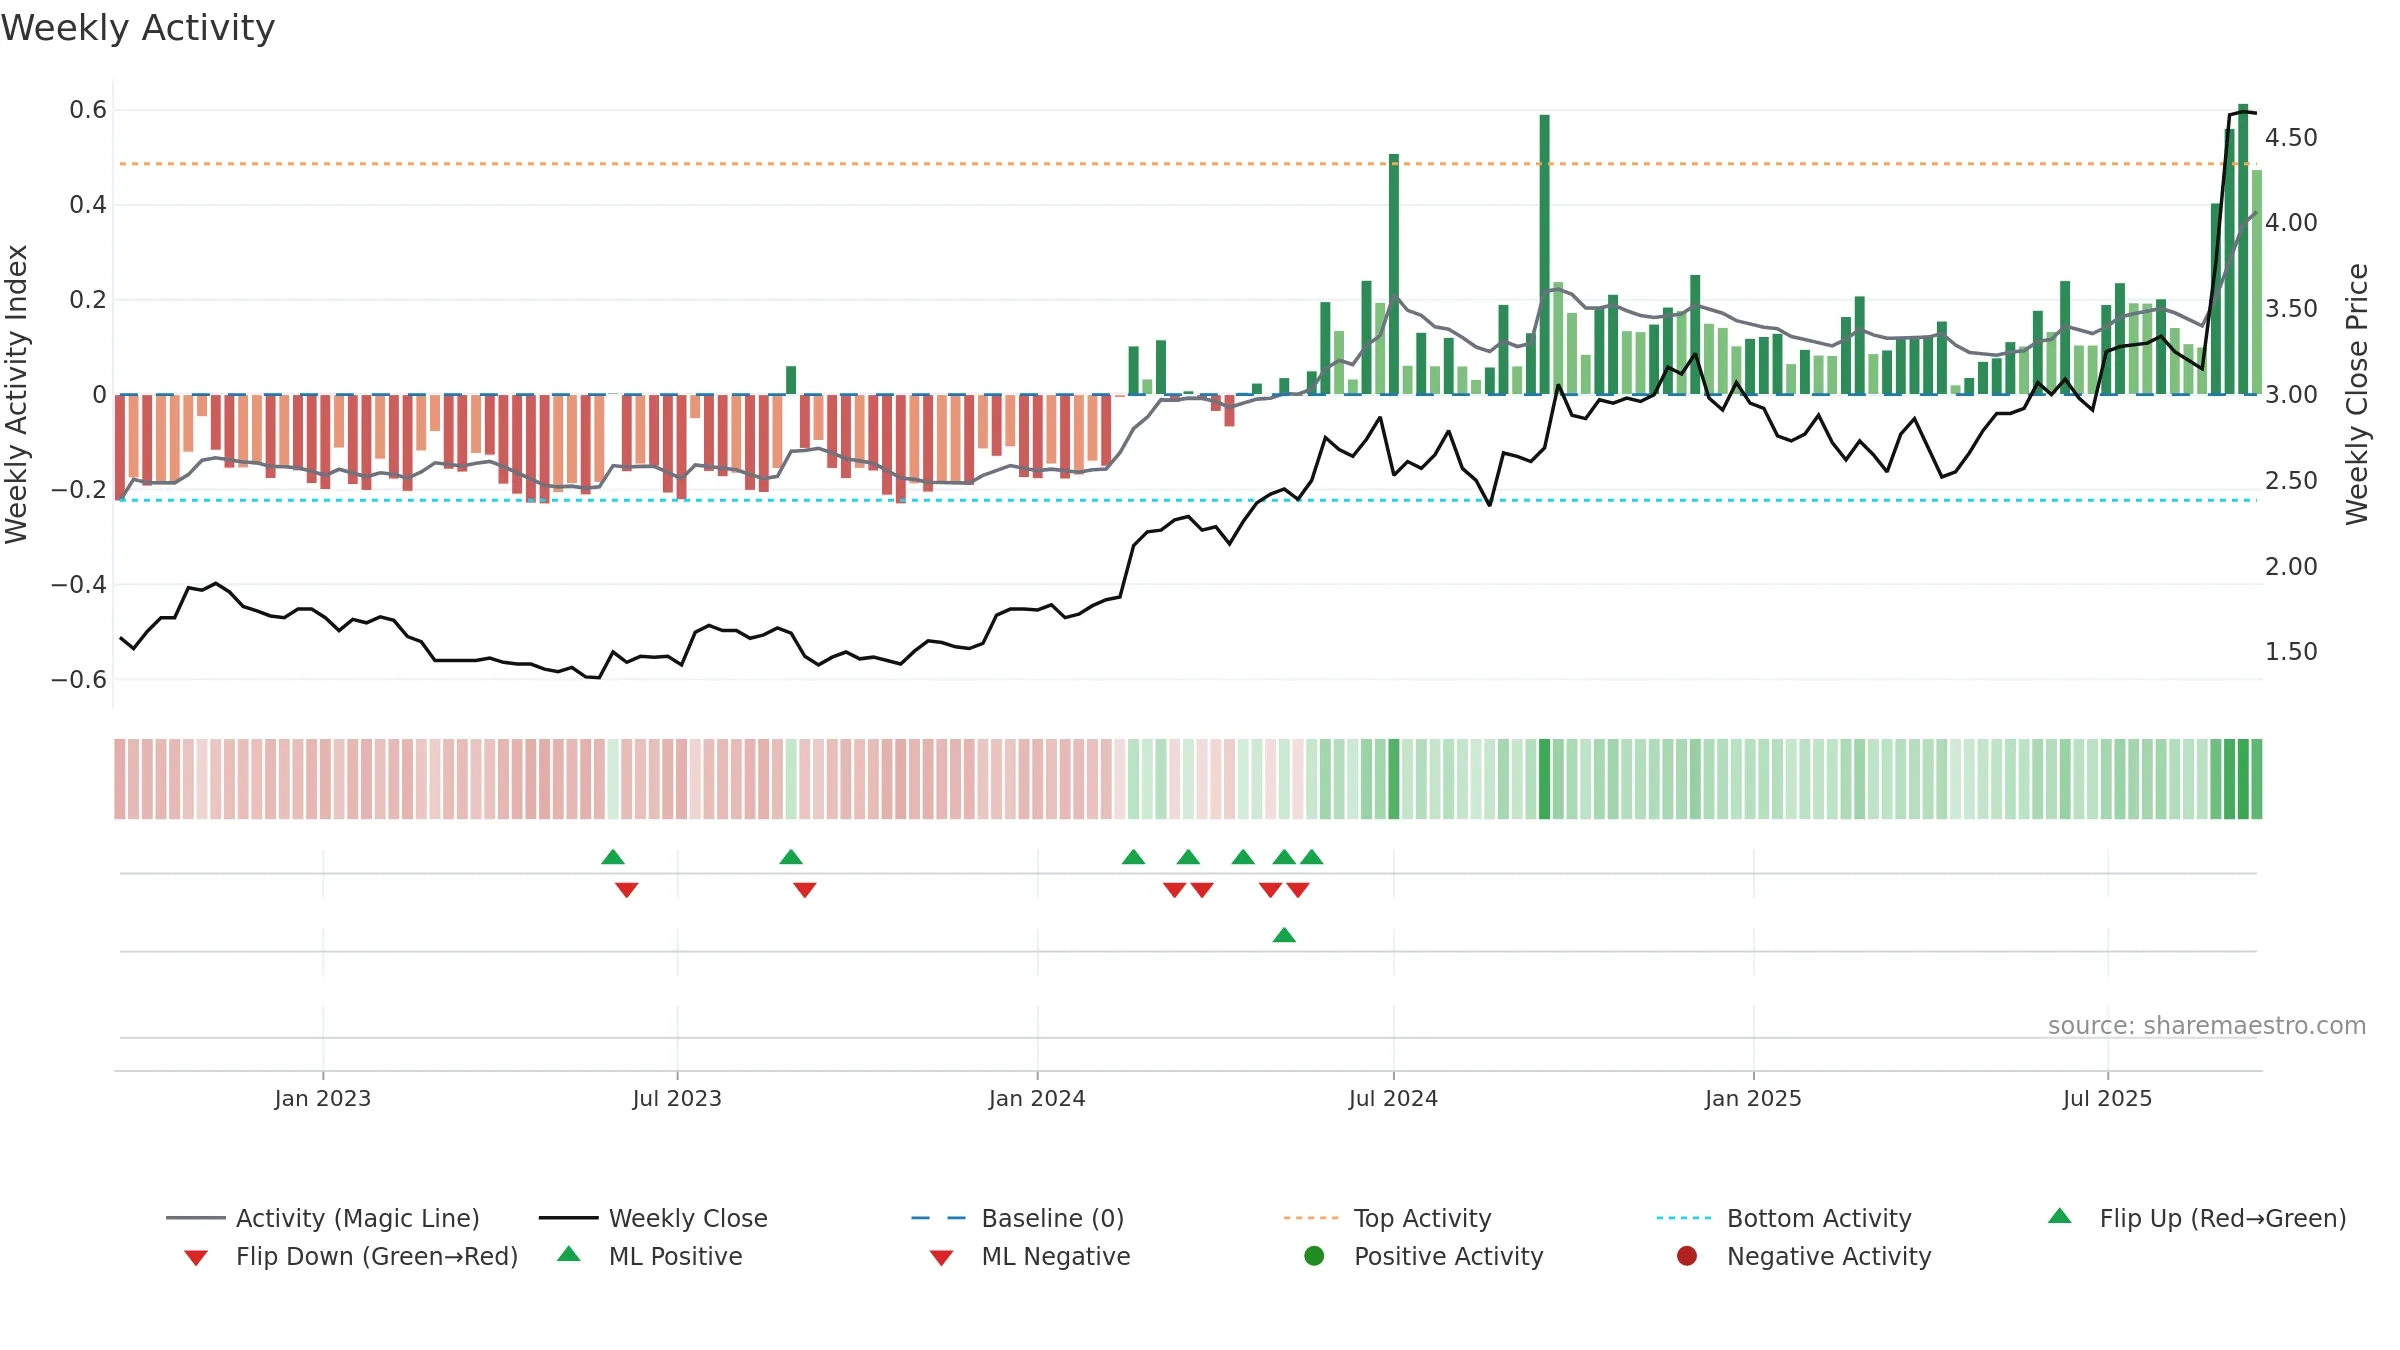
How to read this — Price slope is upward, indicating persistent buying over the window. Elevated weekly volatility increases whipsaw risk. Volume and price are moving in the same direction — a constructive confirmation. Returns are positively correlated with volume — strength tends to arrive on higher activity. Constructive MA stack supports the up-drift; pullbacks may find support at the 8–13 week region. Price holds above key averages, indicating constructive participation.
Up-slope supports buying interest; pullbacks may be contained if activity stays firm.
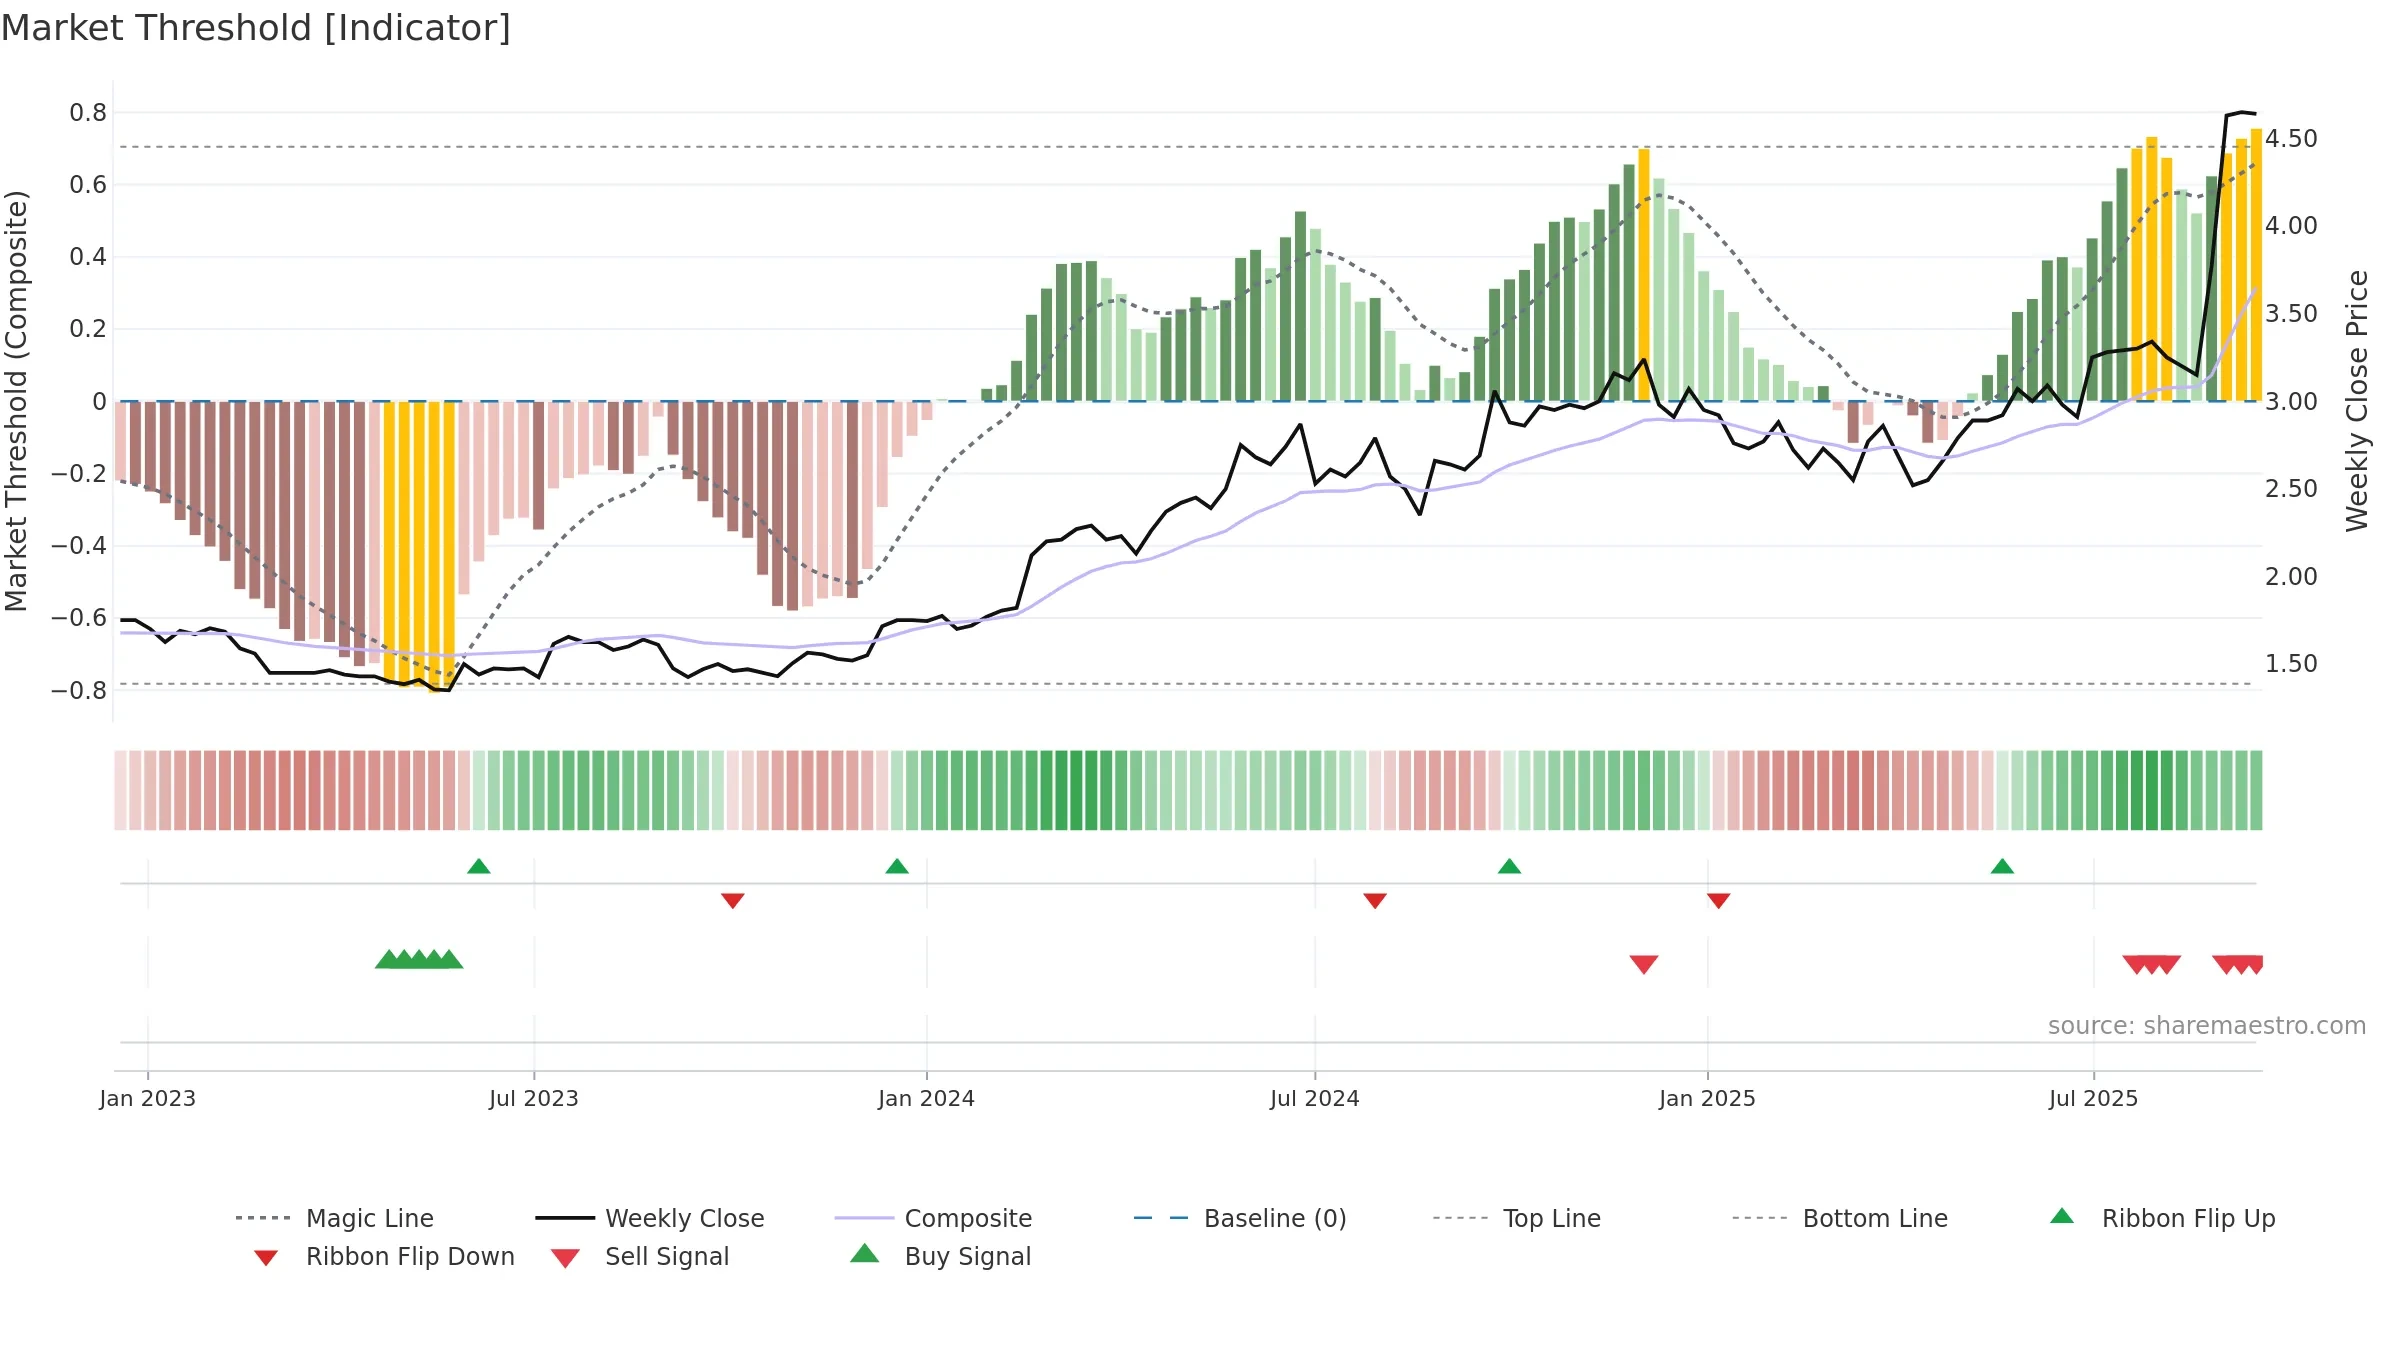
Gauge maps the trend signal to a 0–100 scale.
How to read this — Gauge is elevated but momentum is rolling over; topping risk is rising.
Stay alert: protect gains or seek confirmation before adding risk.
Price is above fair value; upside may be capped without catalysts.
Conclusion
Neutral setup. ★★★☆☆ confidence. Price window: 38. Trend: Uptrend at Risk; gauge 70. In combination, liquidity confirms the move.
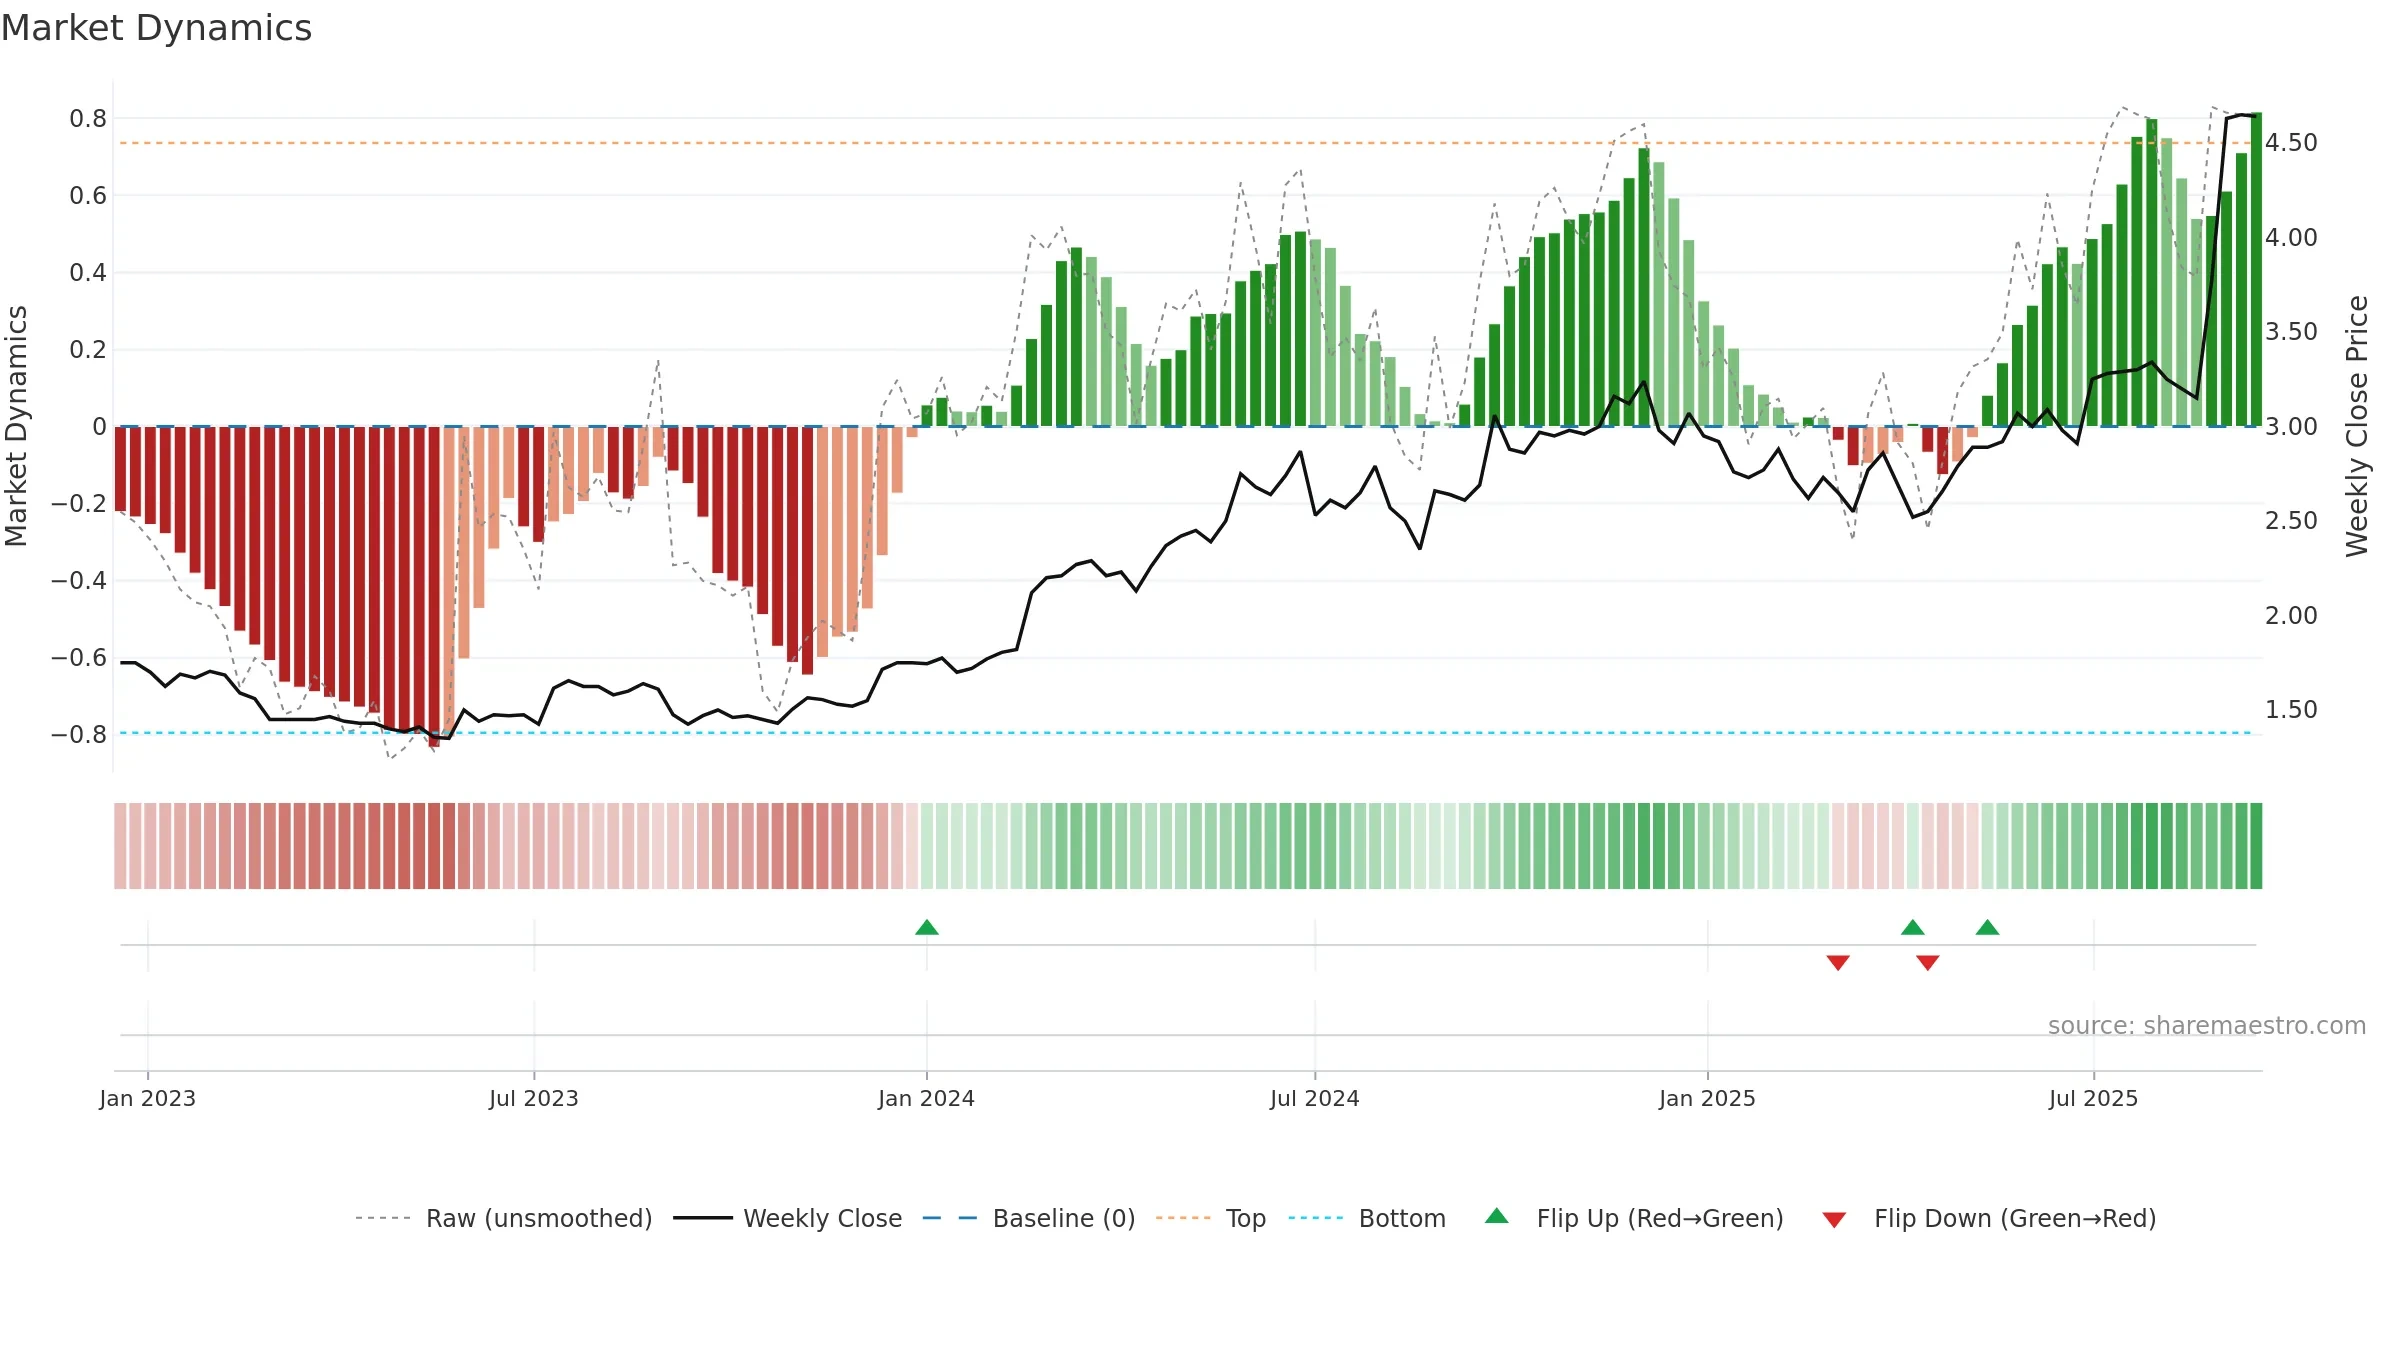
- Momentum is bullish and rising
- Price holds above 8w & 26w averages
- Constructive moving-average stack
- Liquidity confirms the price trend
- High-level but rolling over (topping risk)
- High return volatility raises whipsaw risk
Why: Price window 38.92% over 8w. Return volatility 6.49%. Volume trend rising. Liquidity convergence with price. Trend state uptrend at risk. MA stack constructive. Baseline deviation 1.05% (widening). Momentum bullish and rising. Valuation limited upside without catalysts.
Tip: Most metrics include a hover tooltip where they appear in the report.