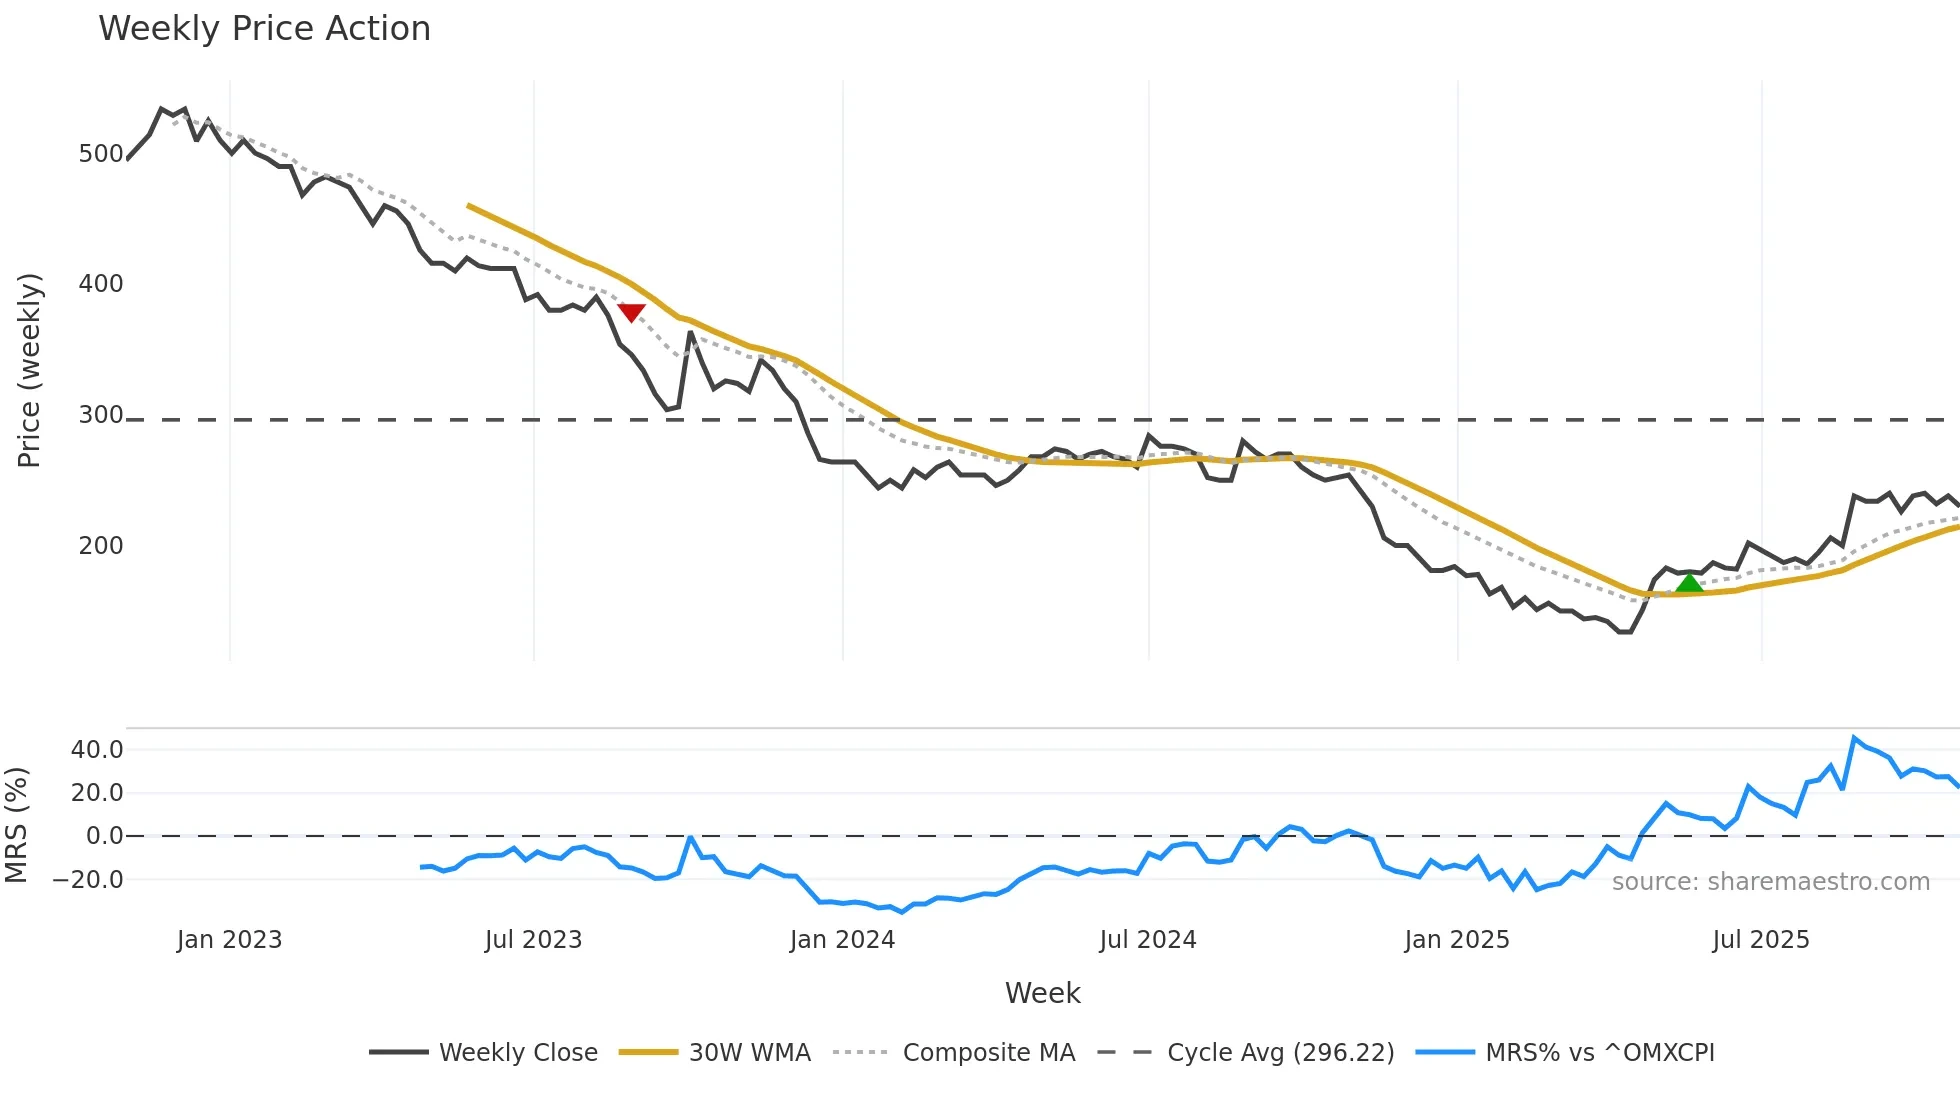
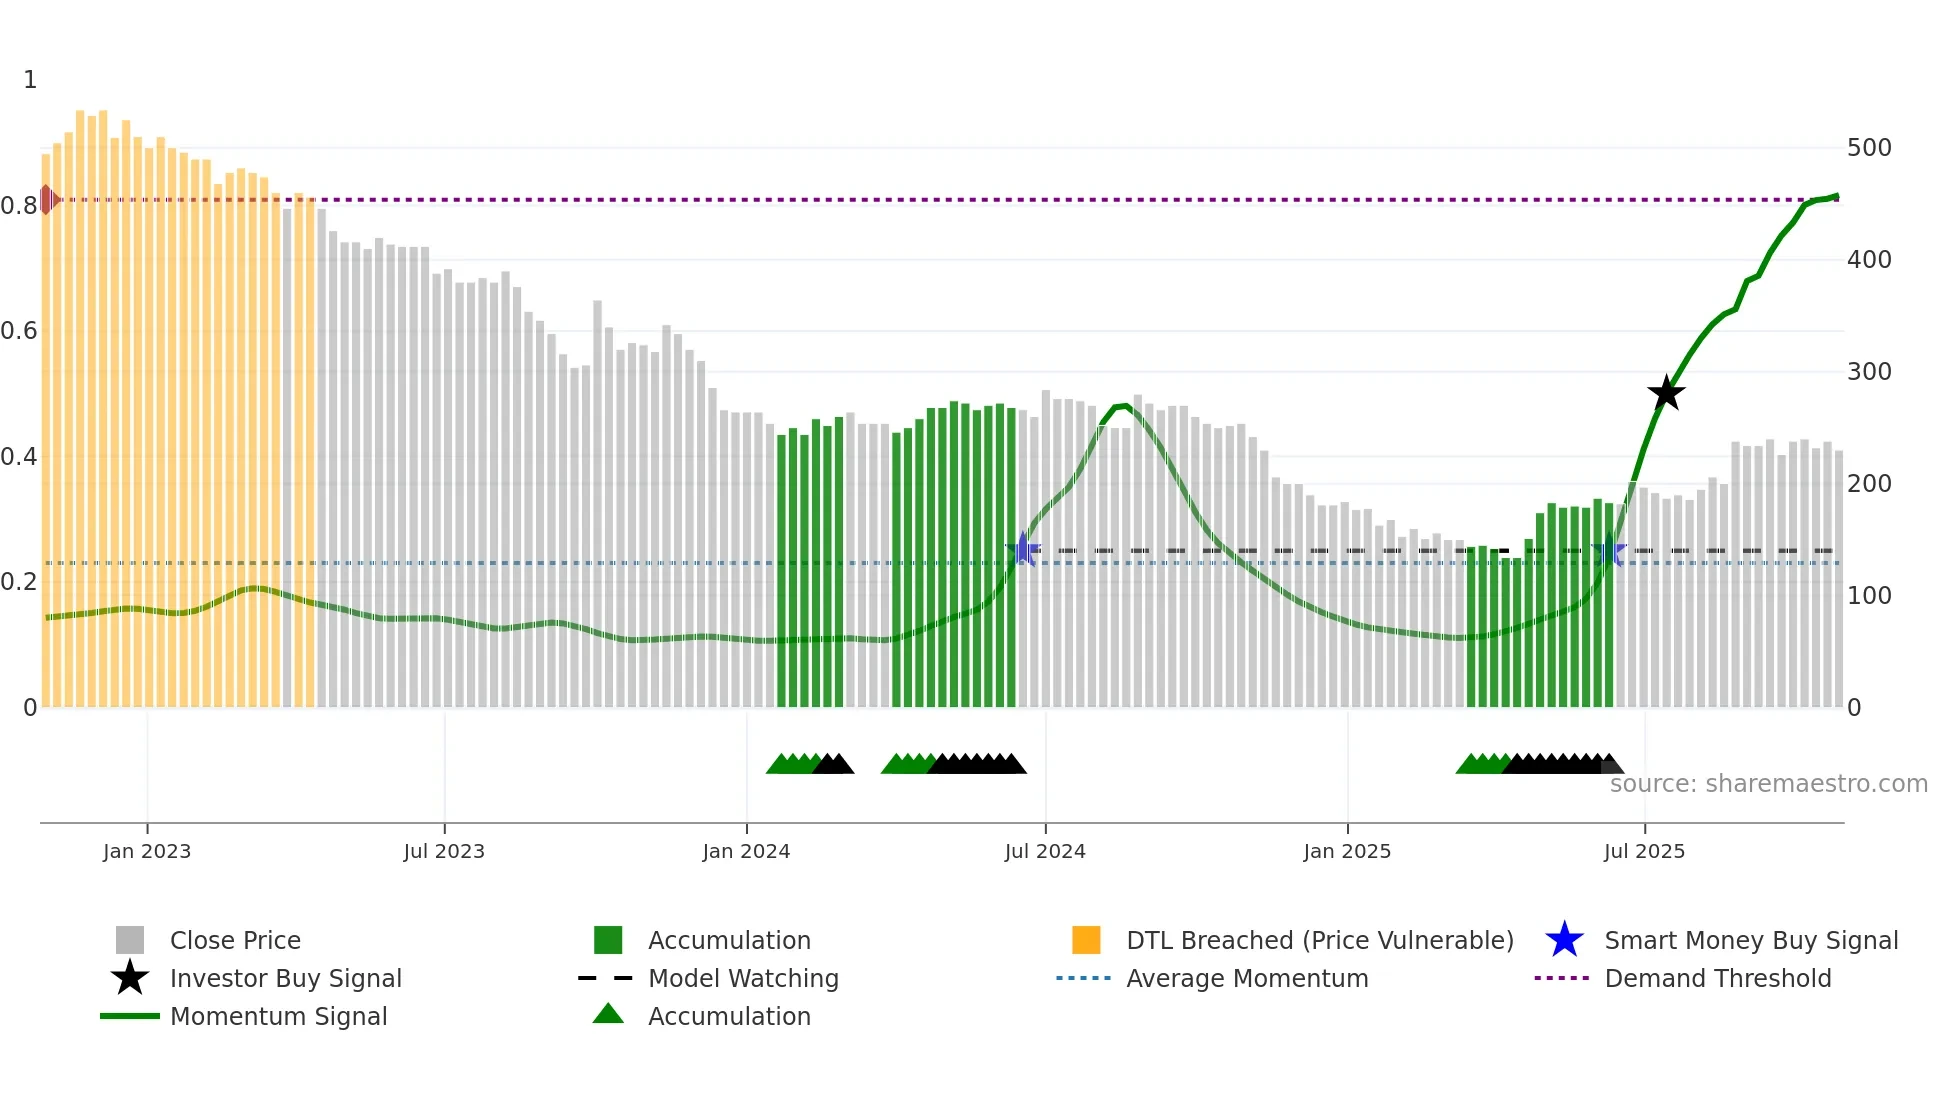
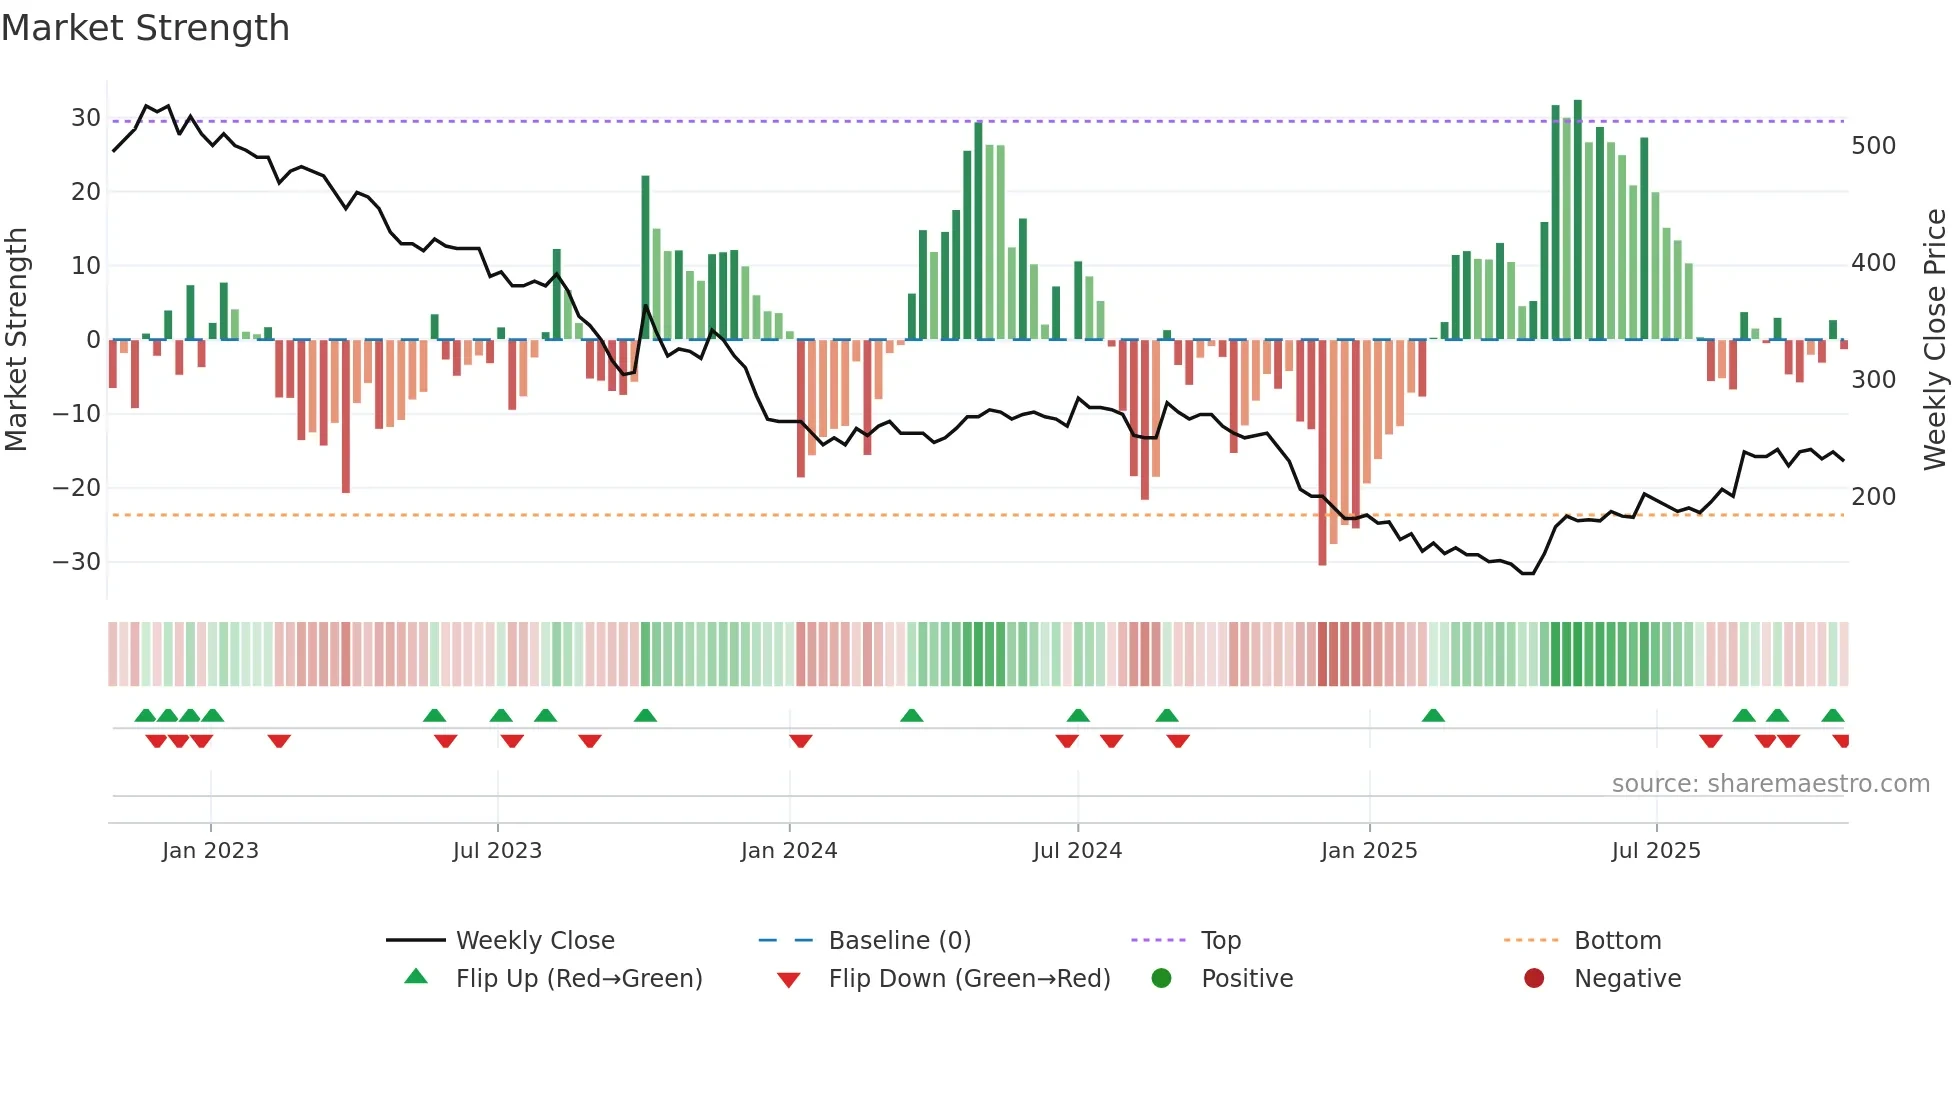
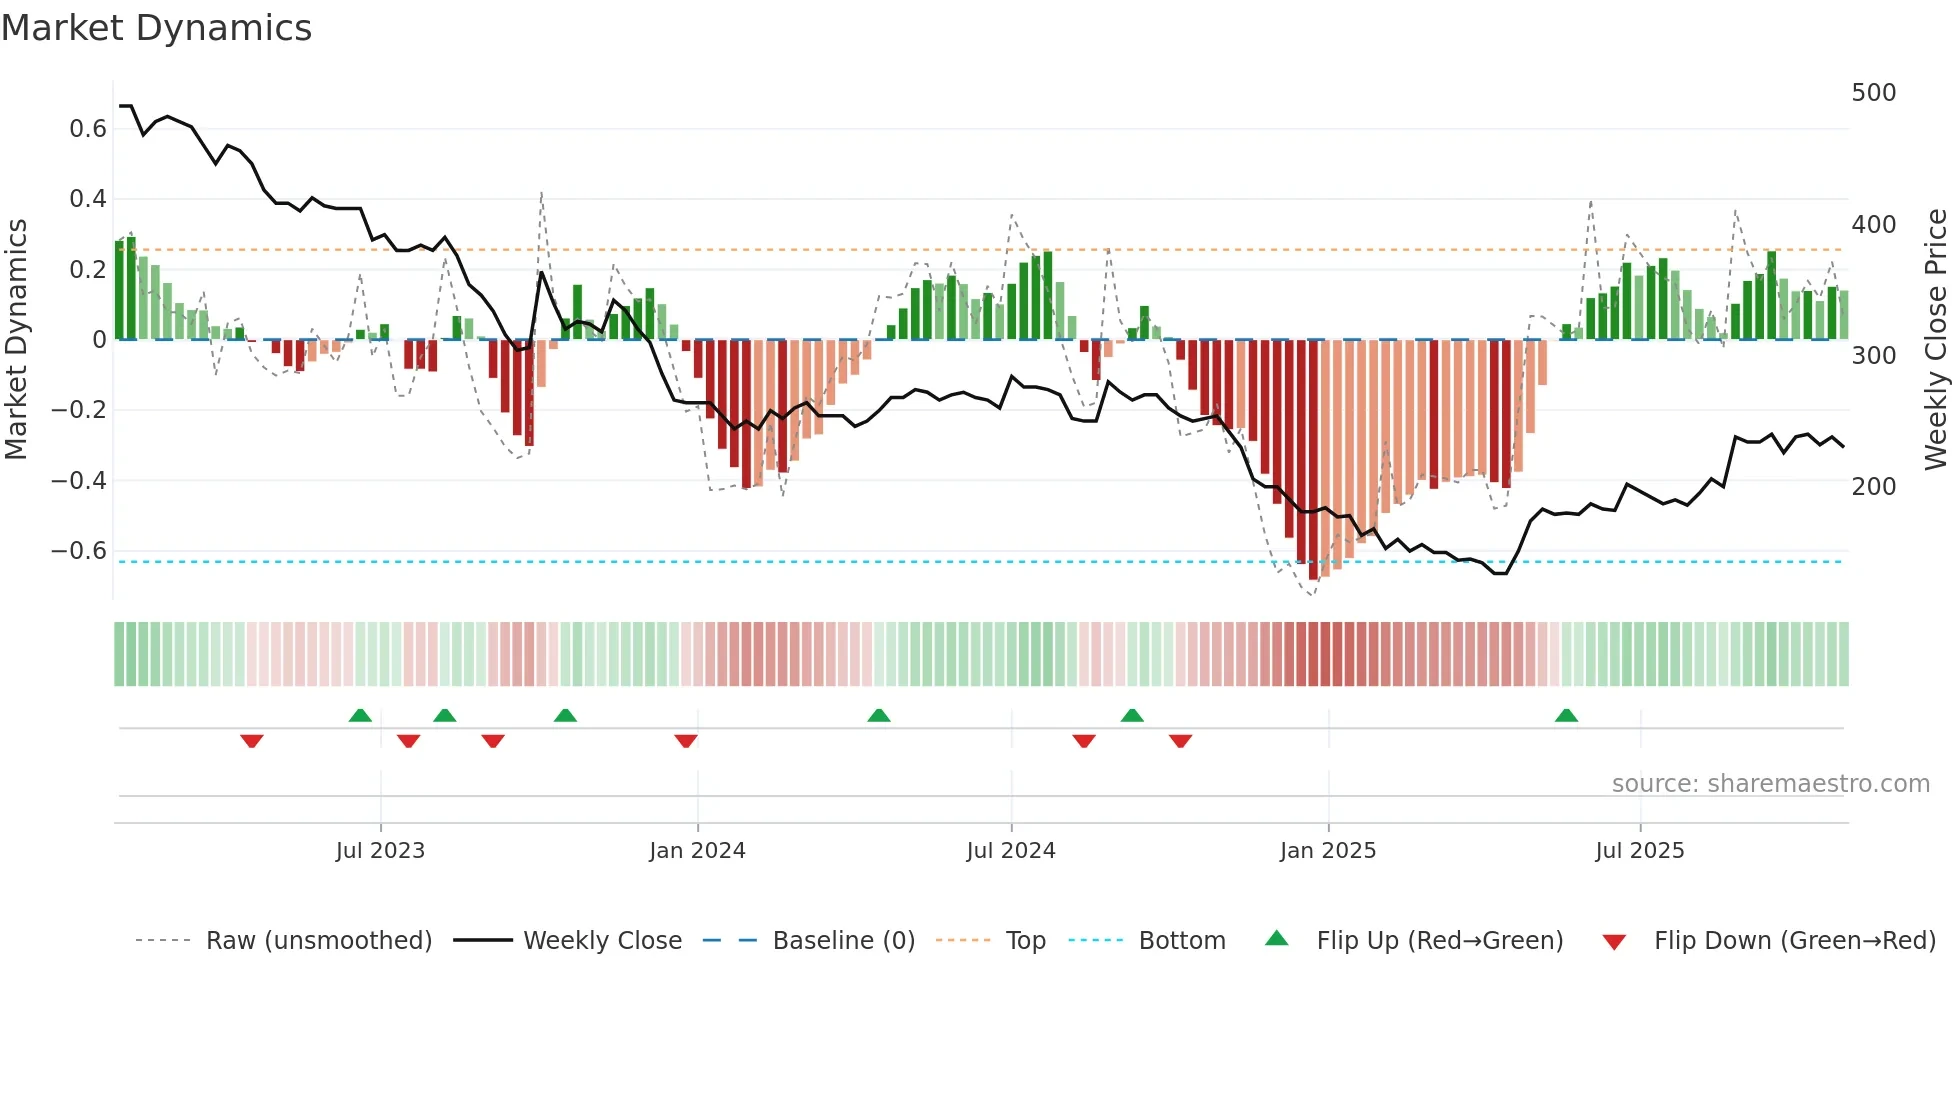
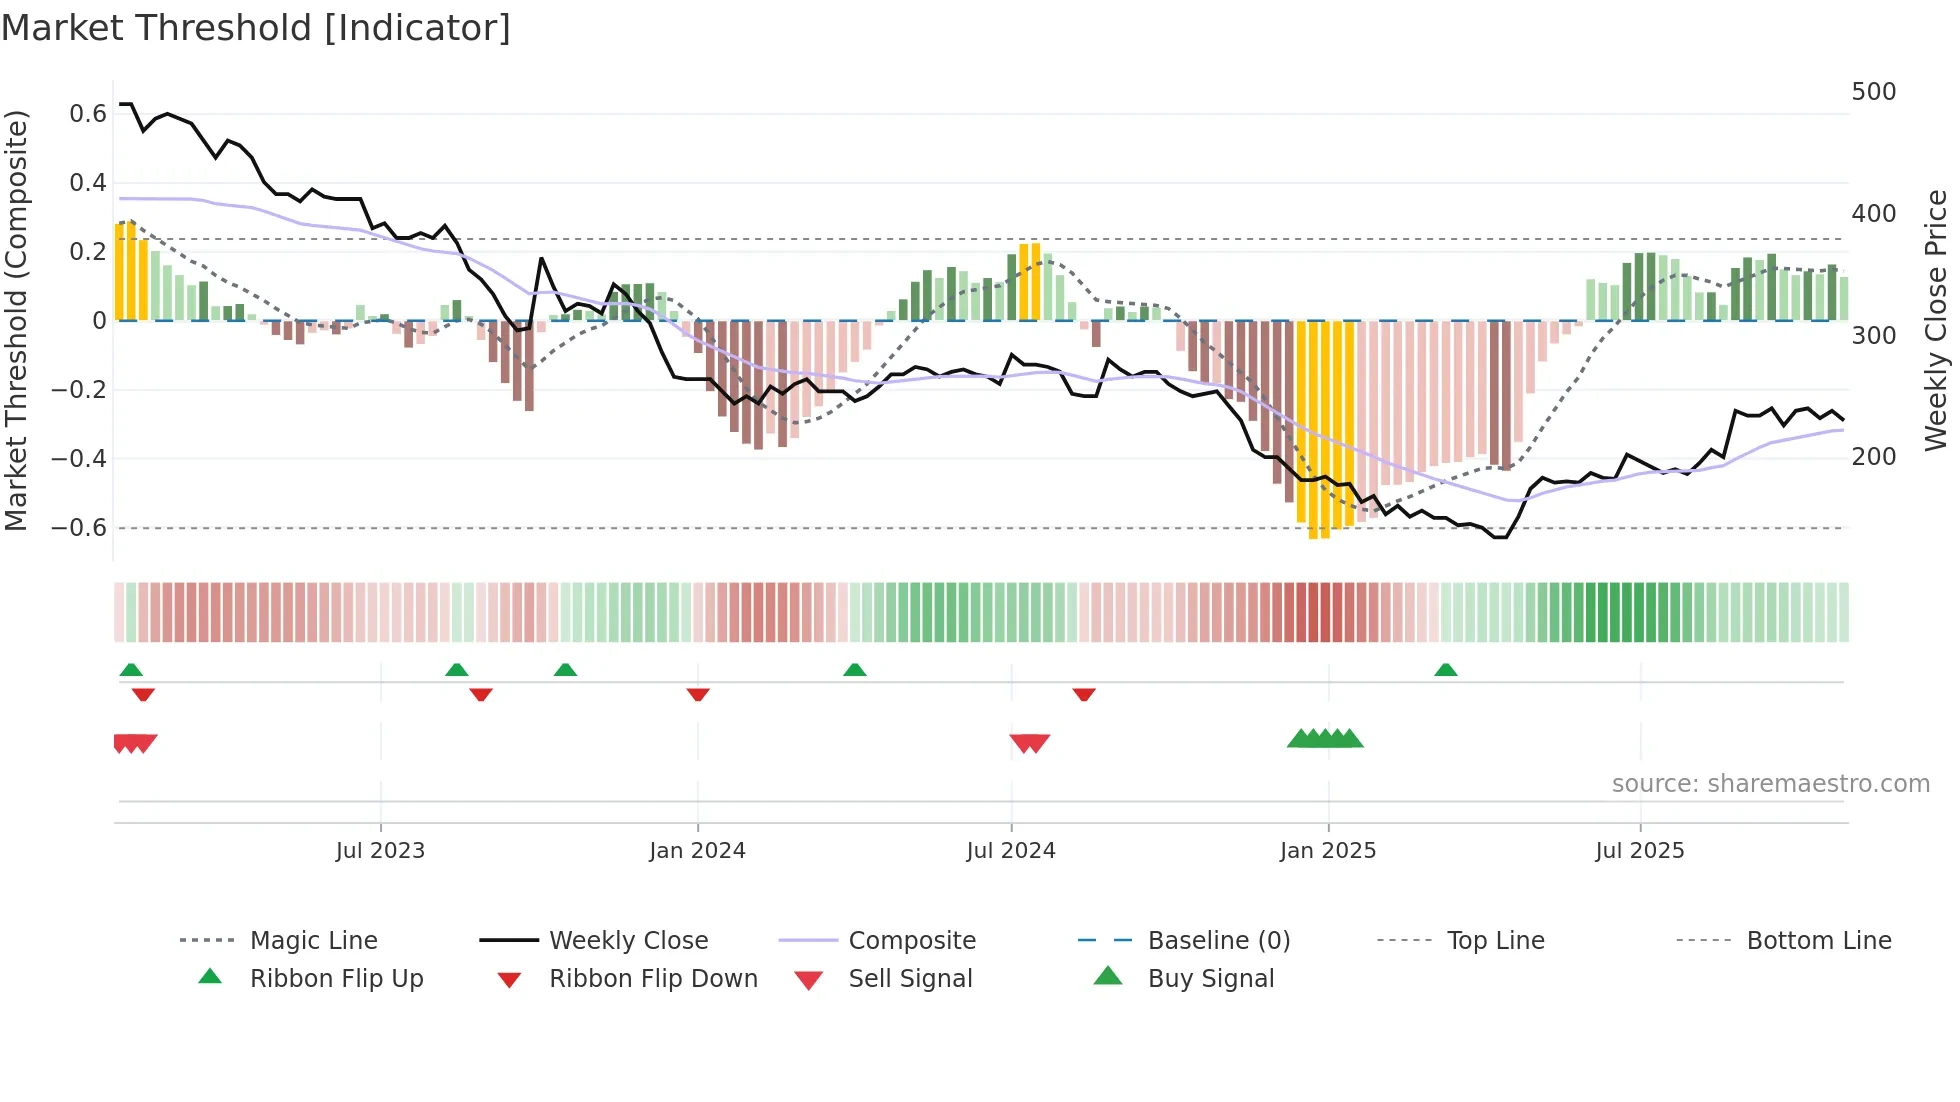
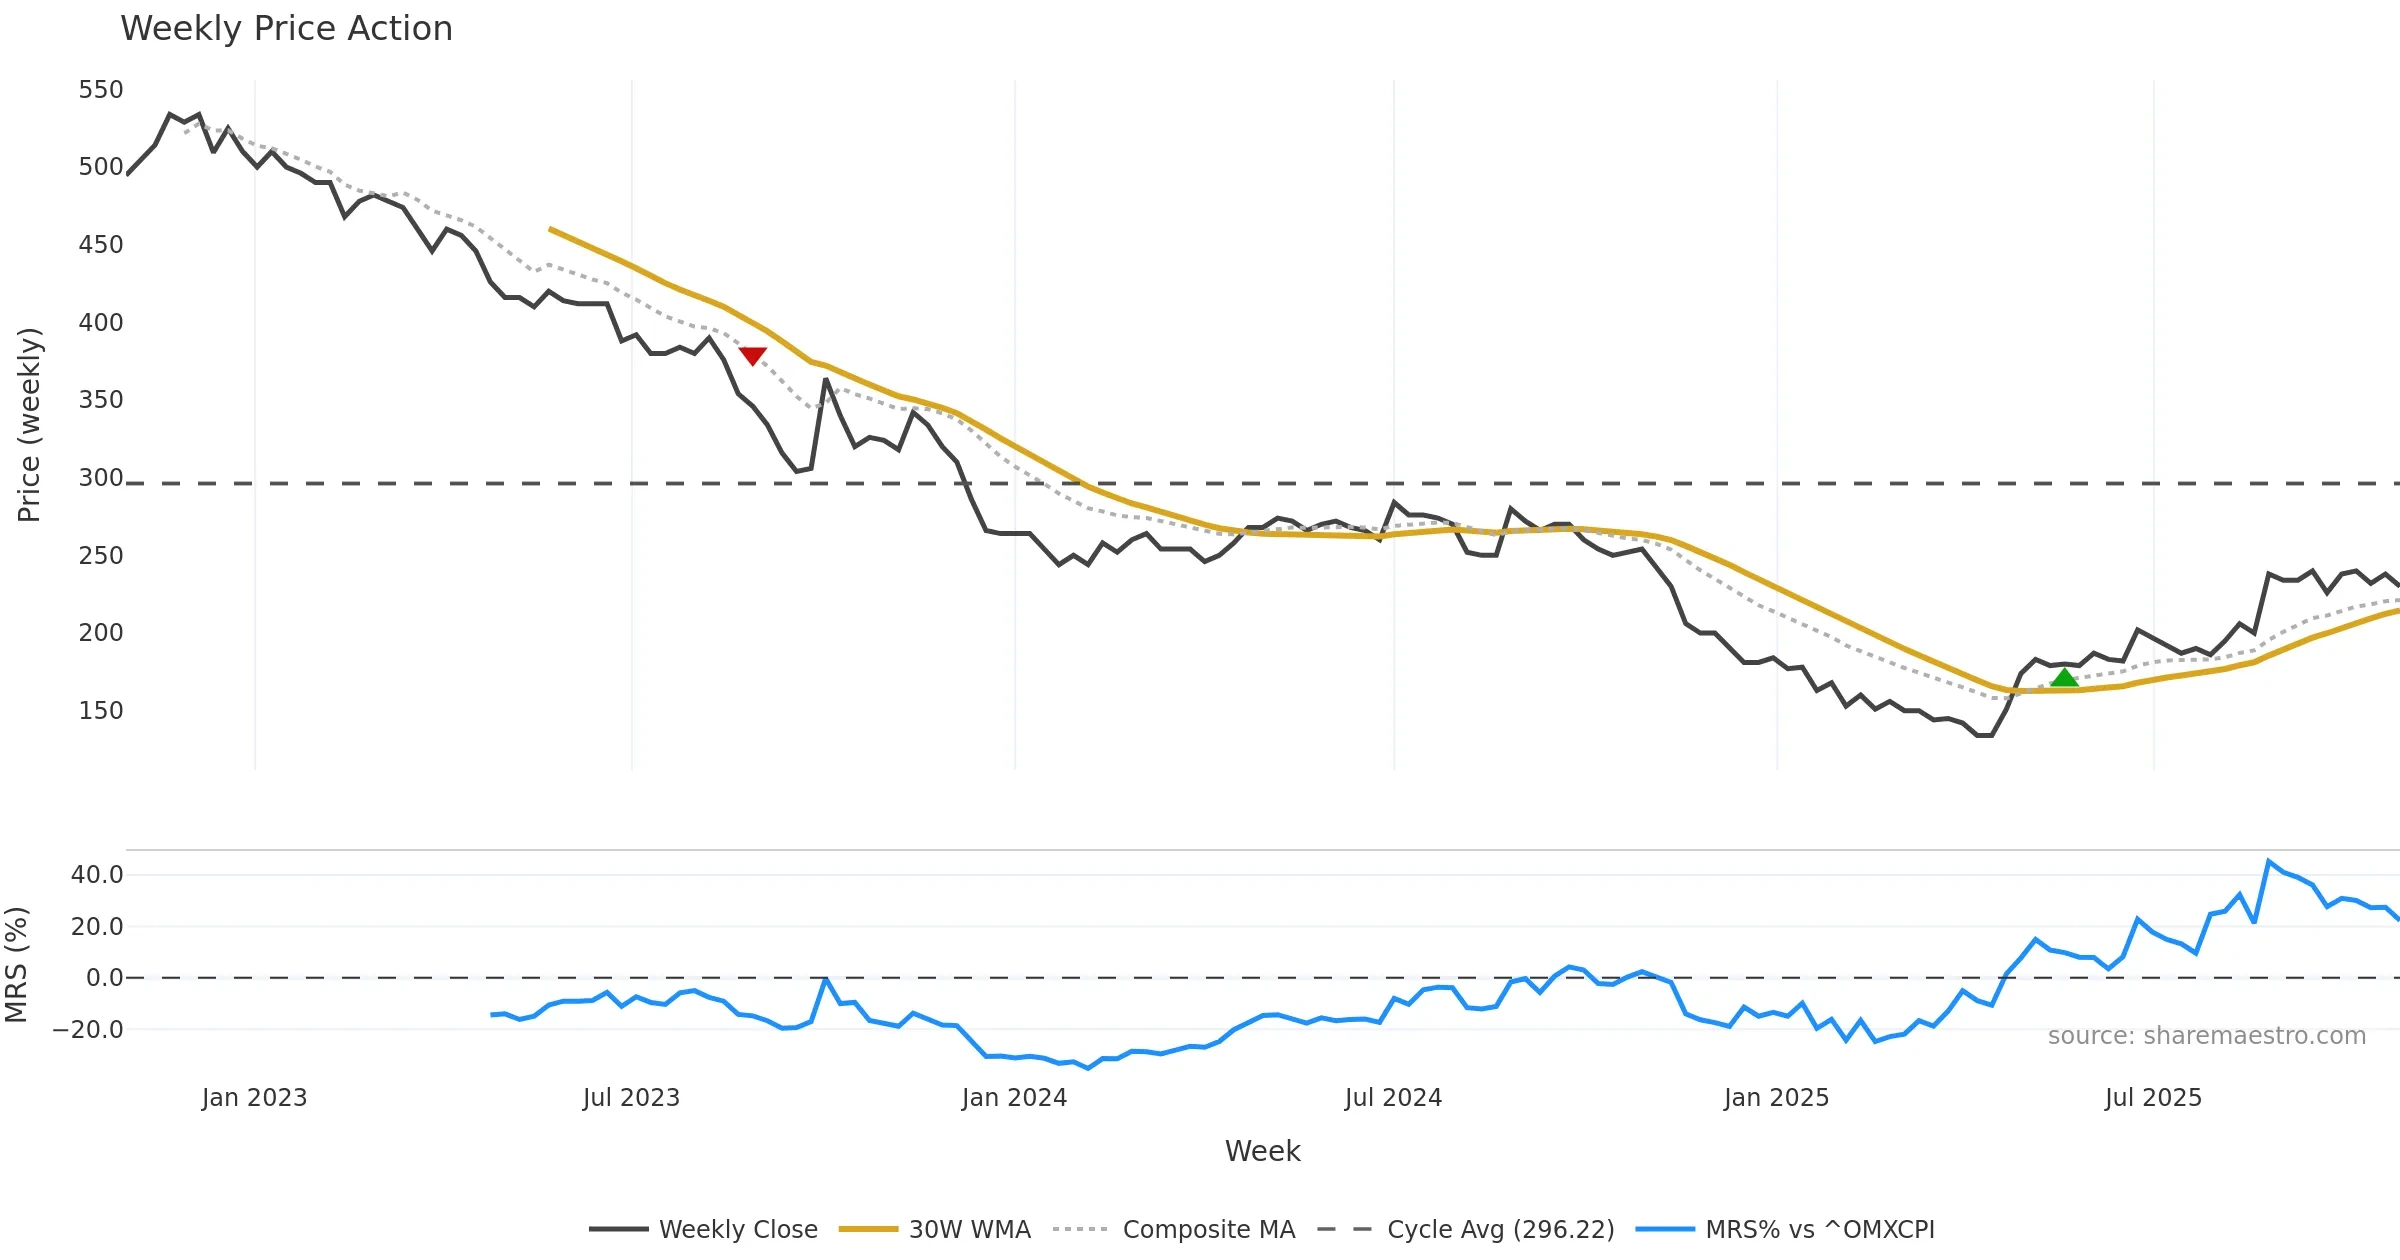
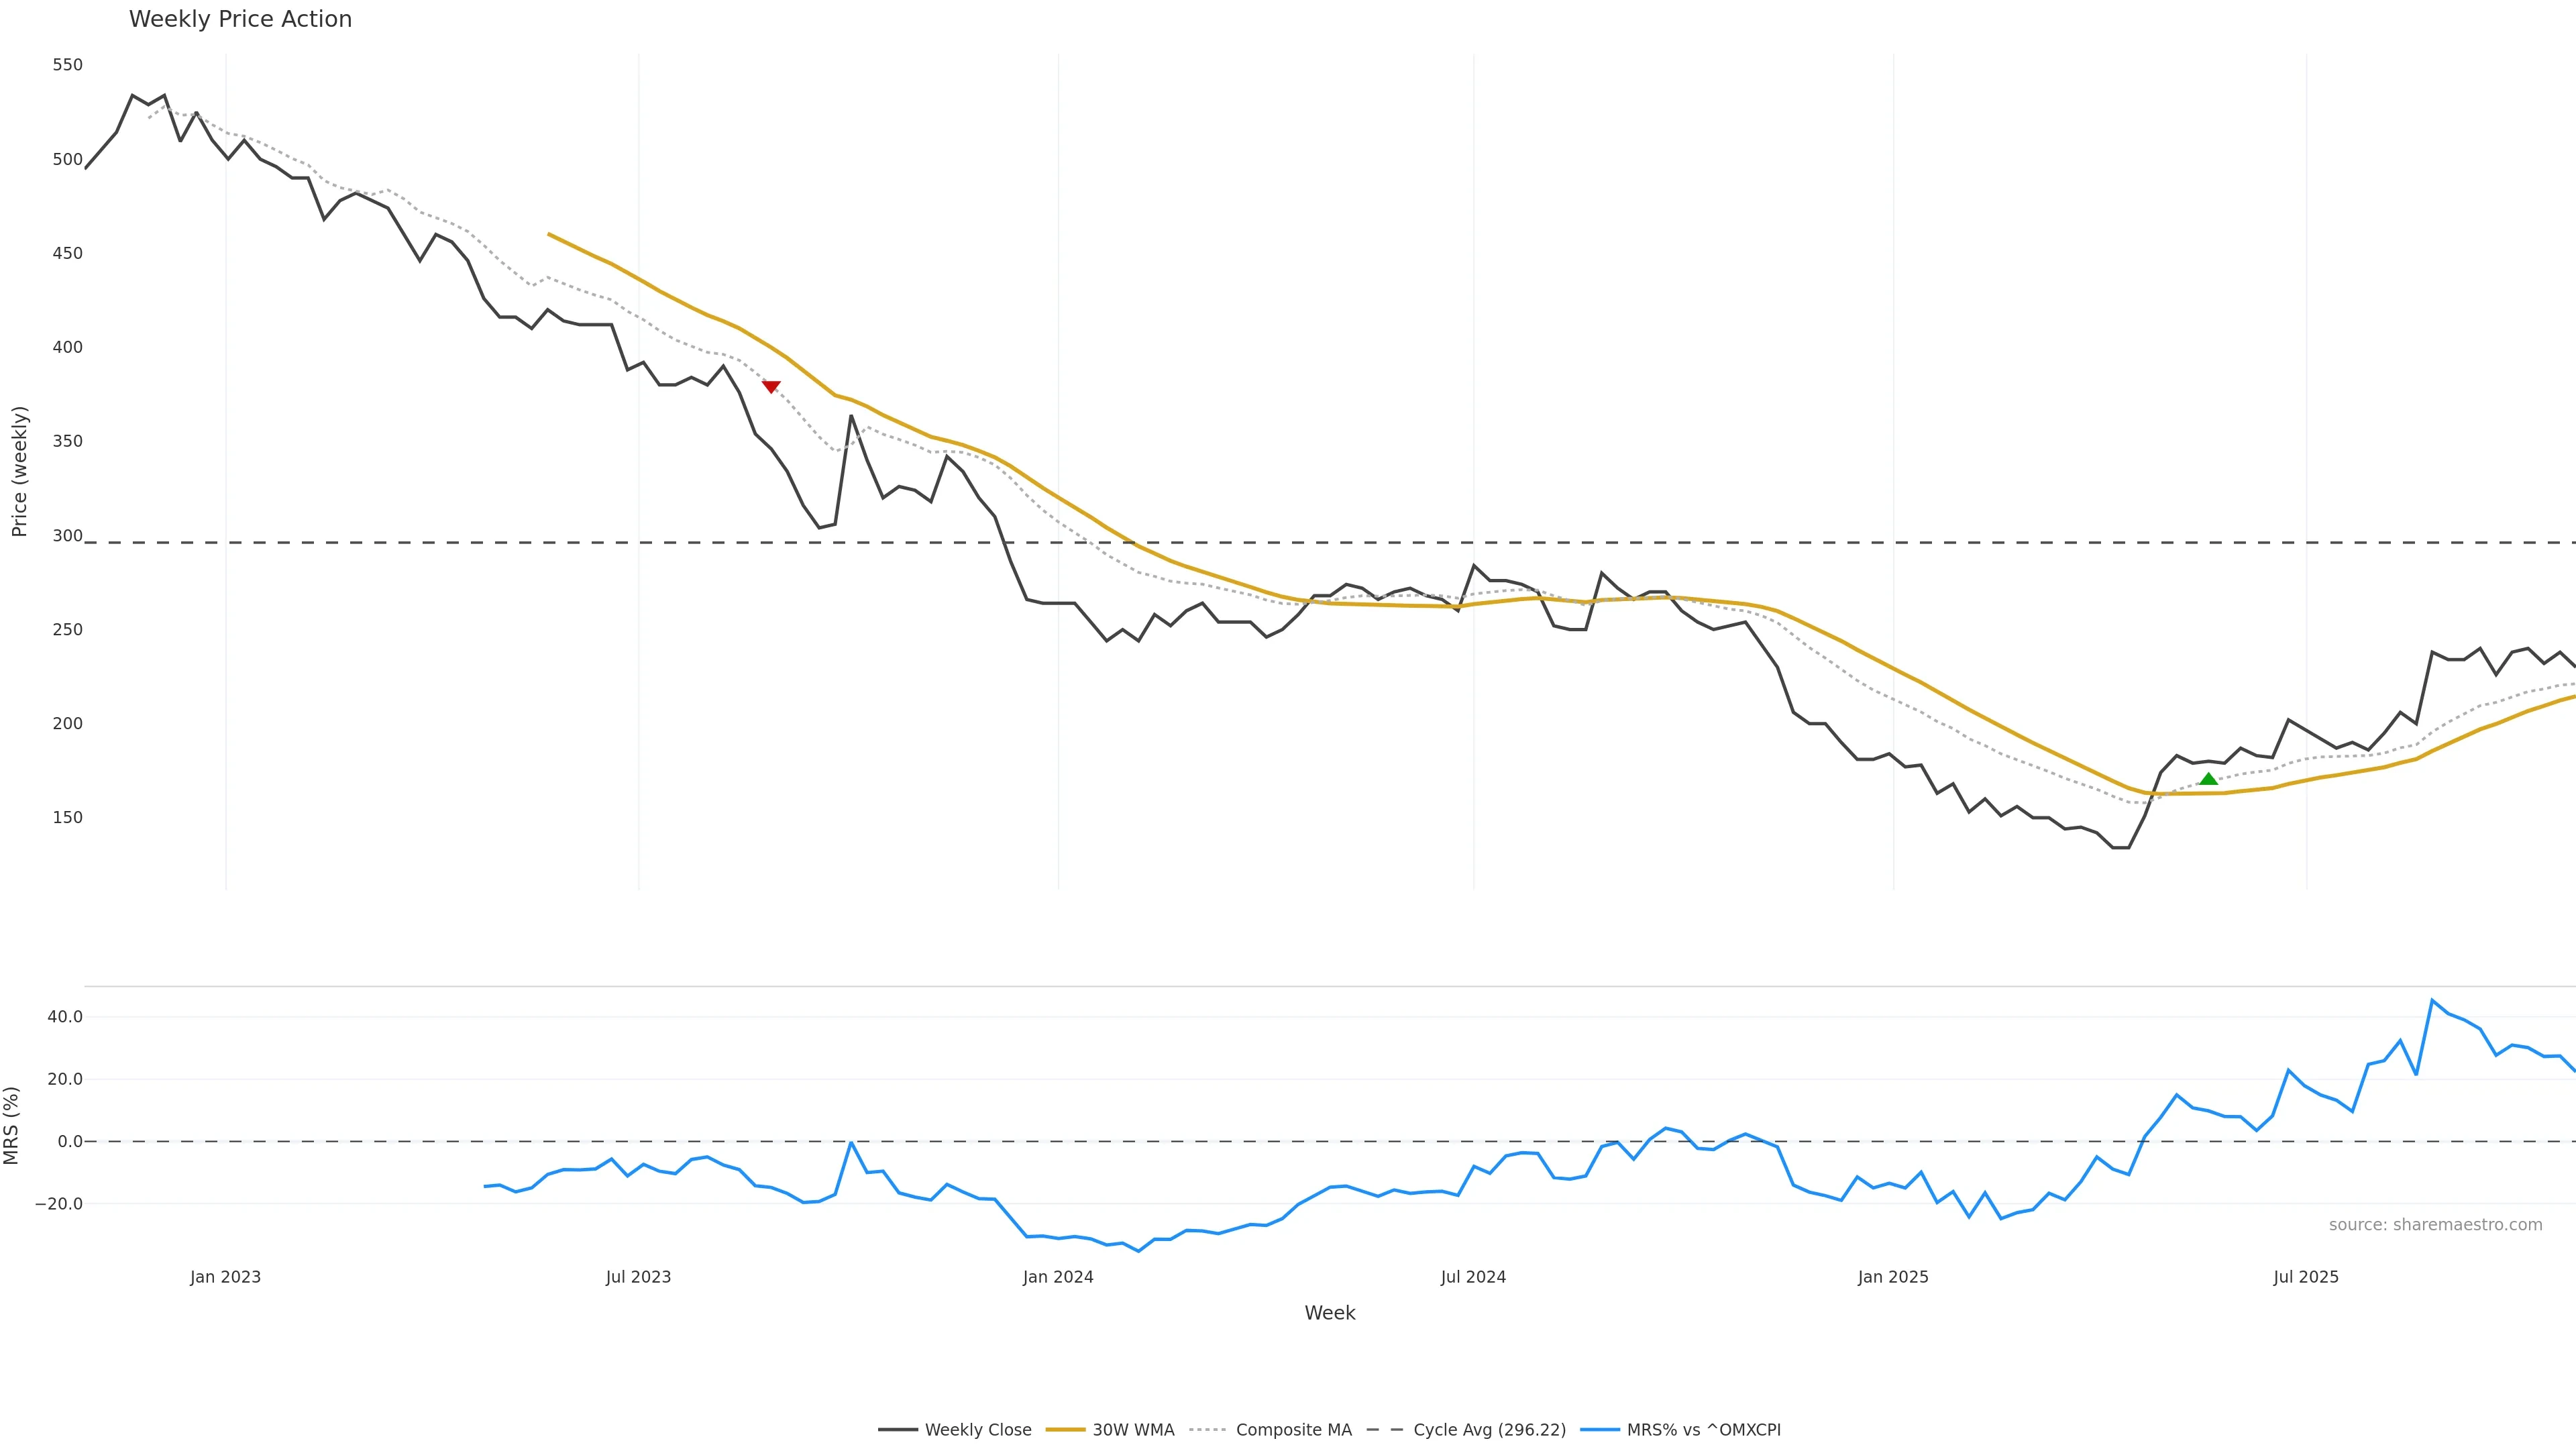
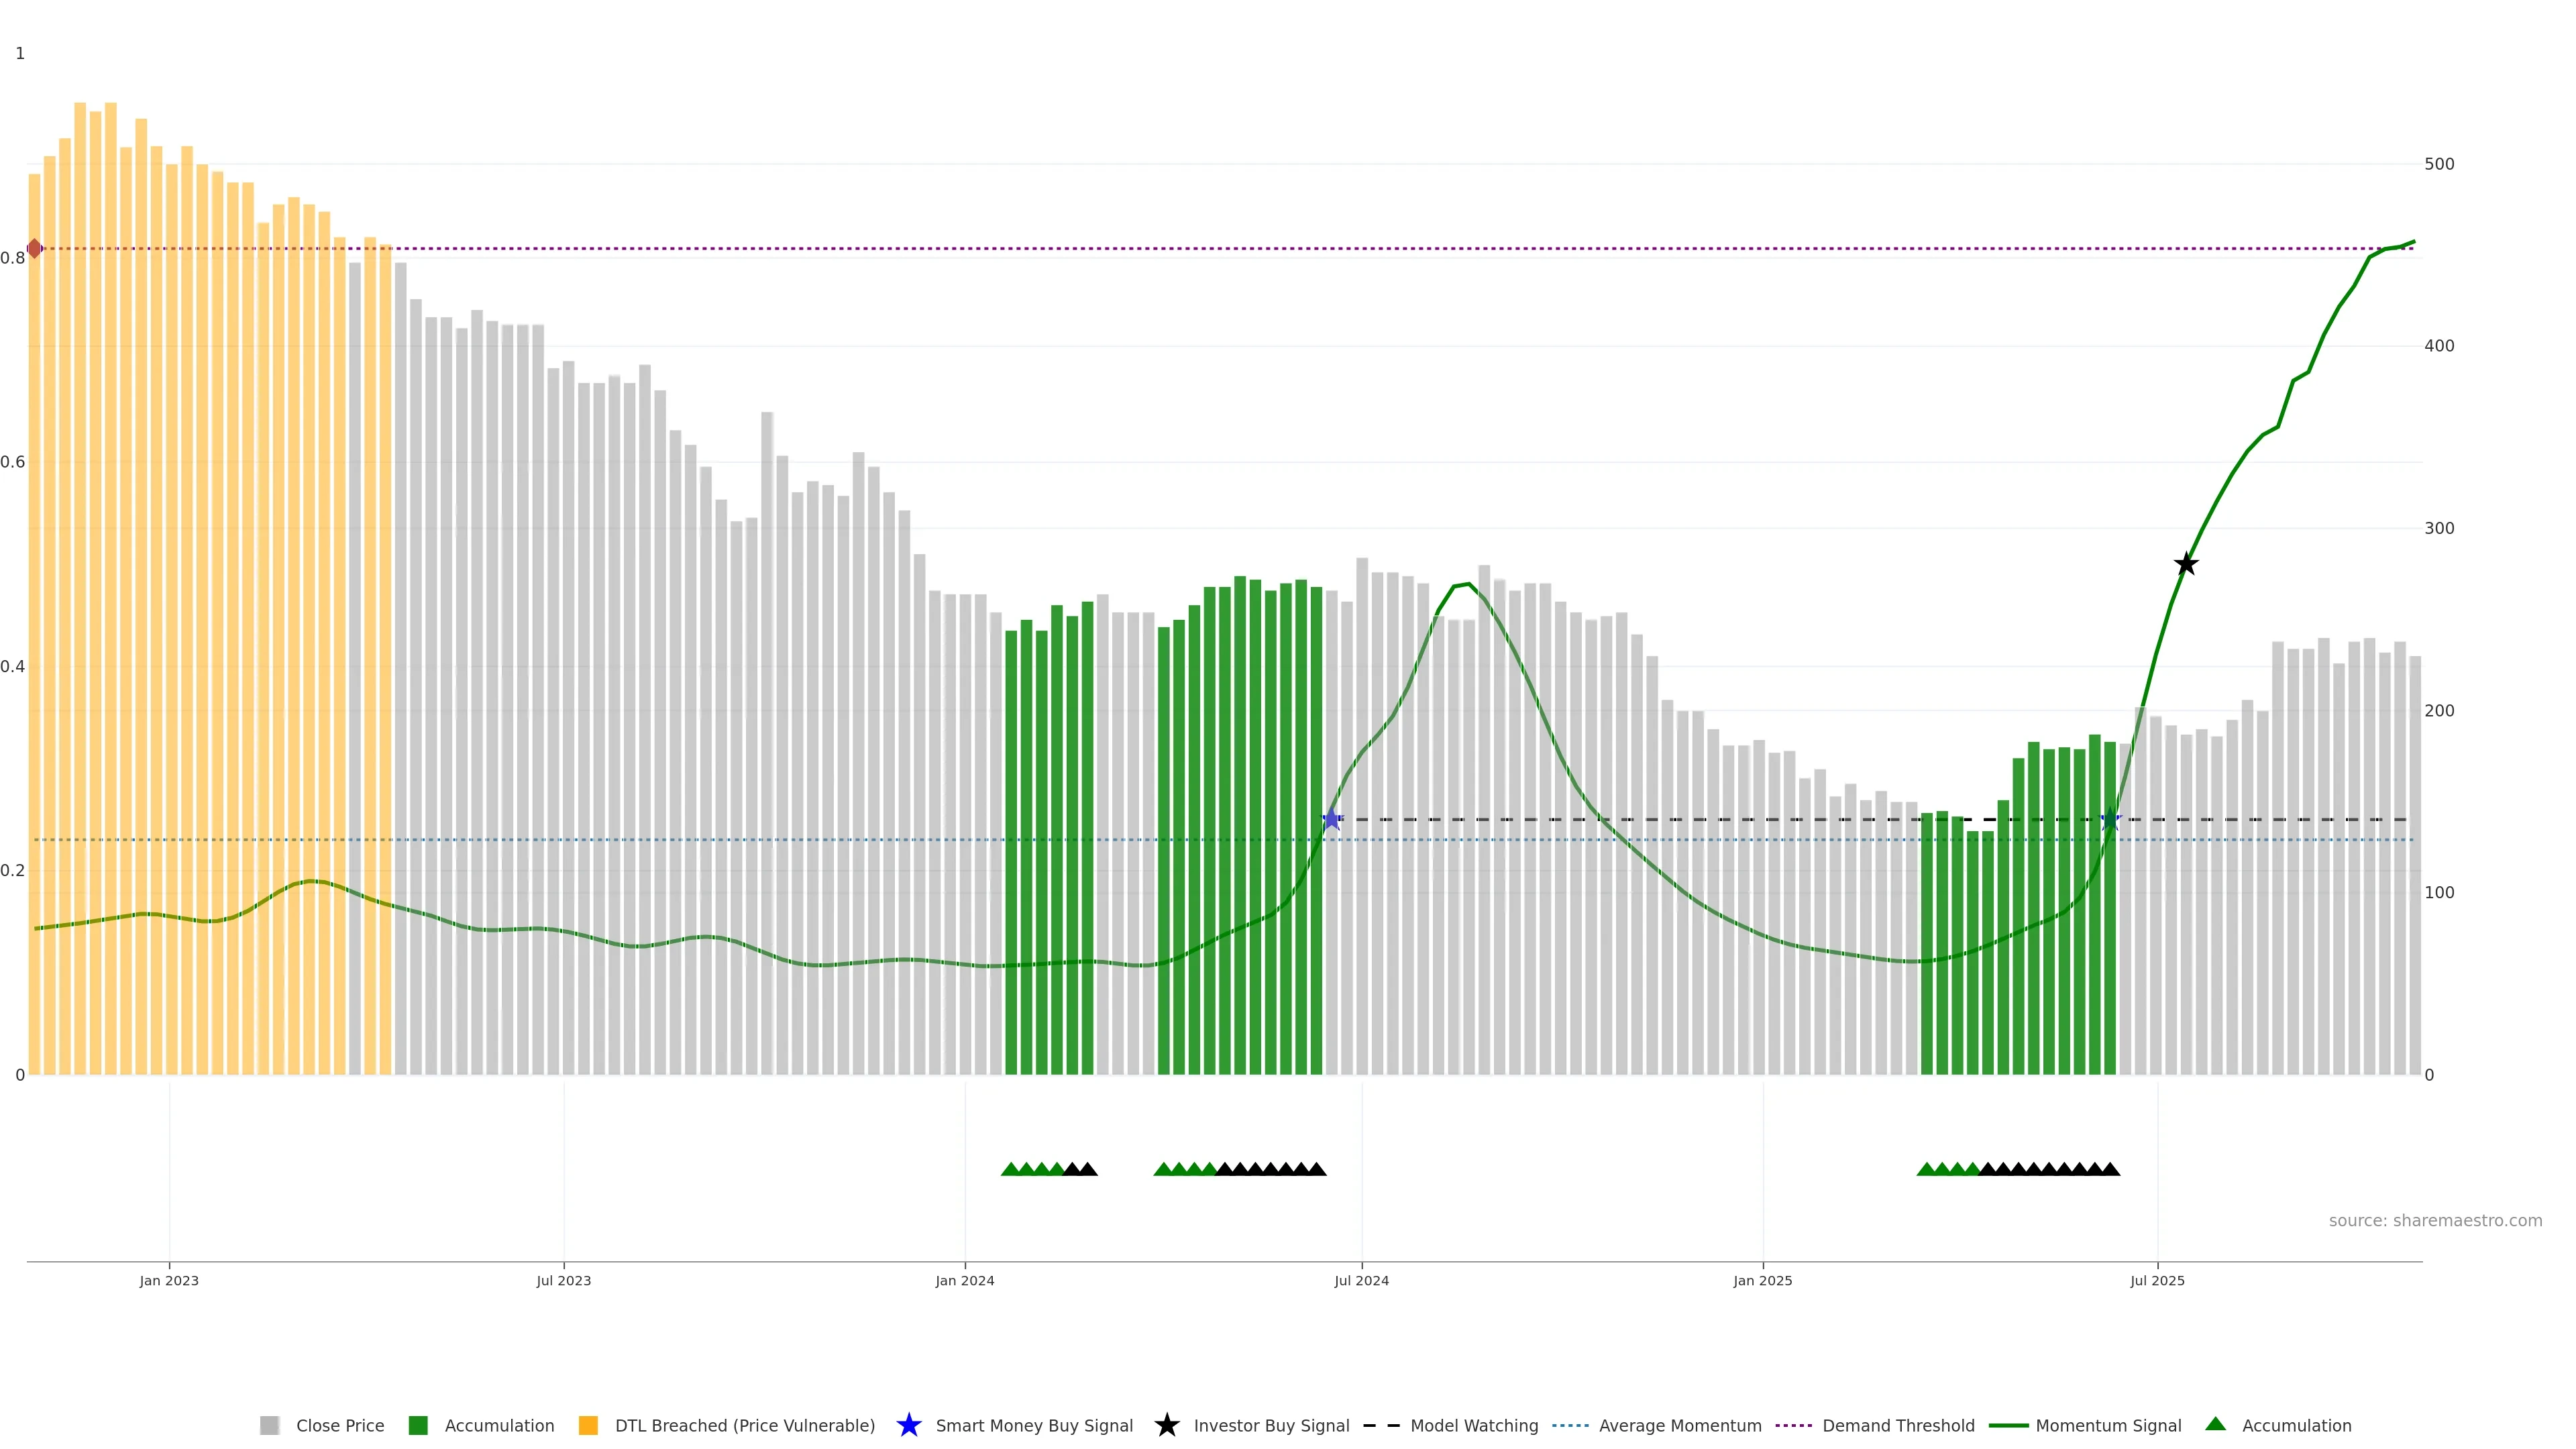
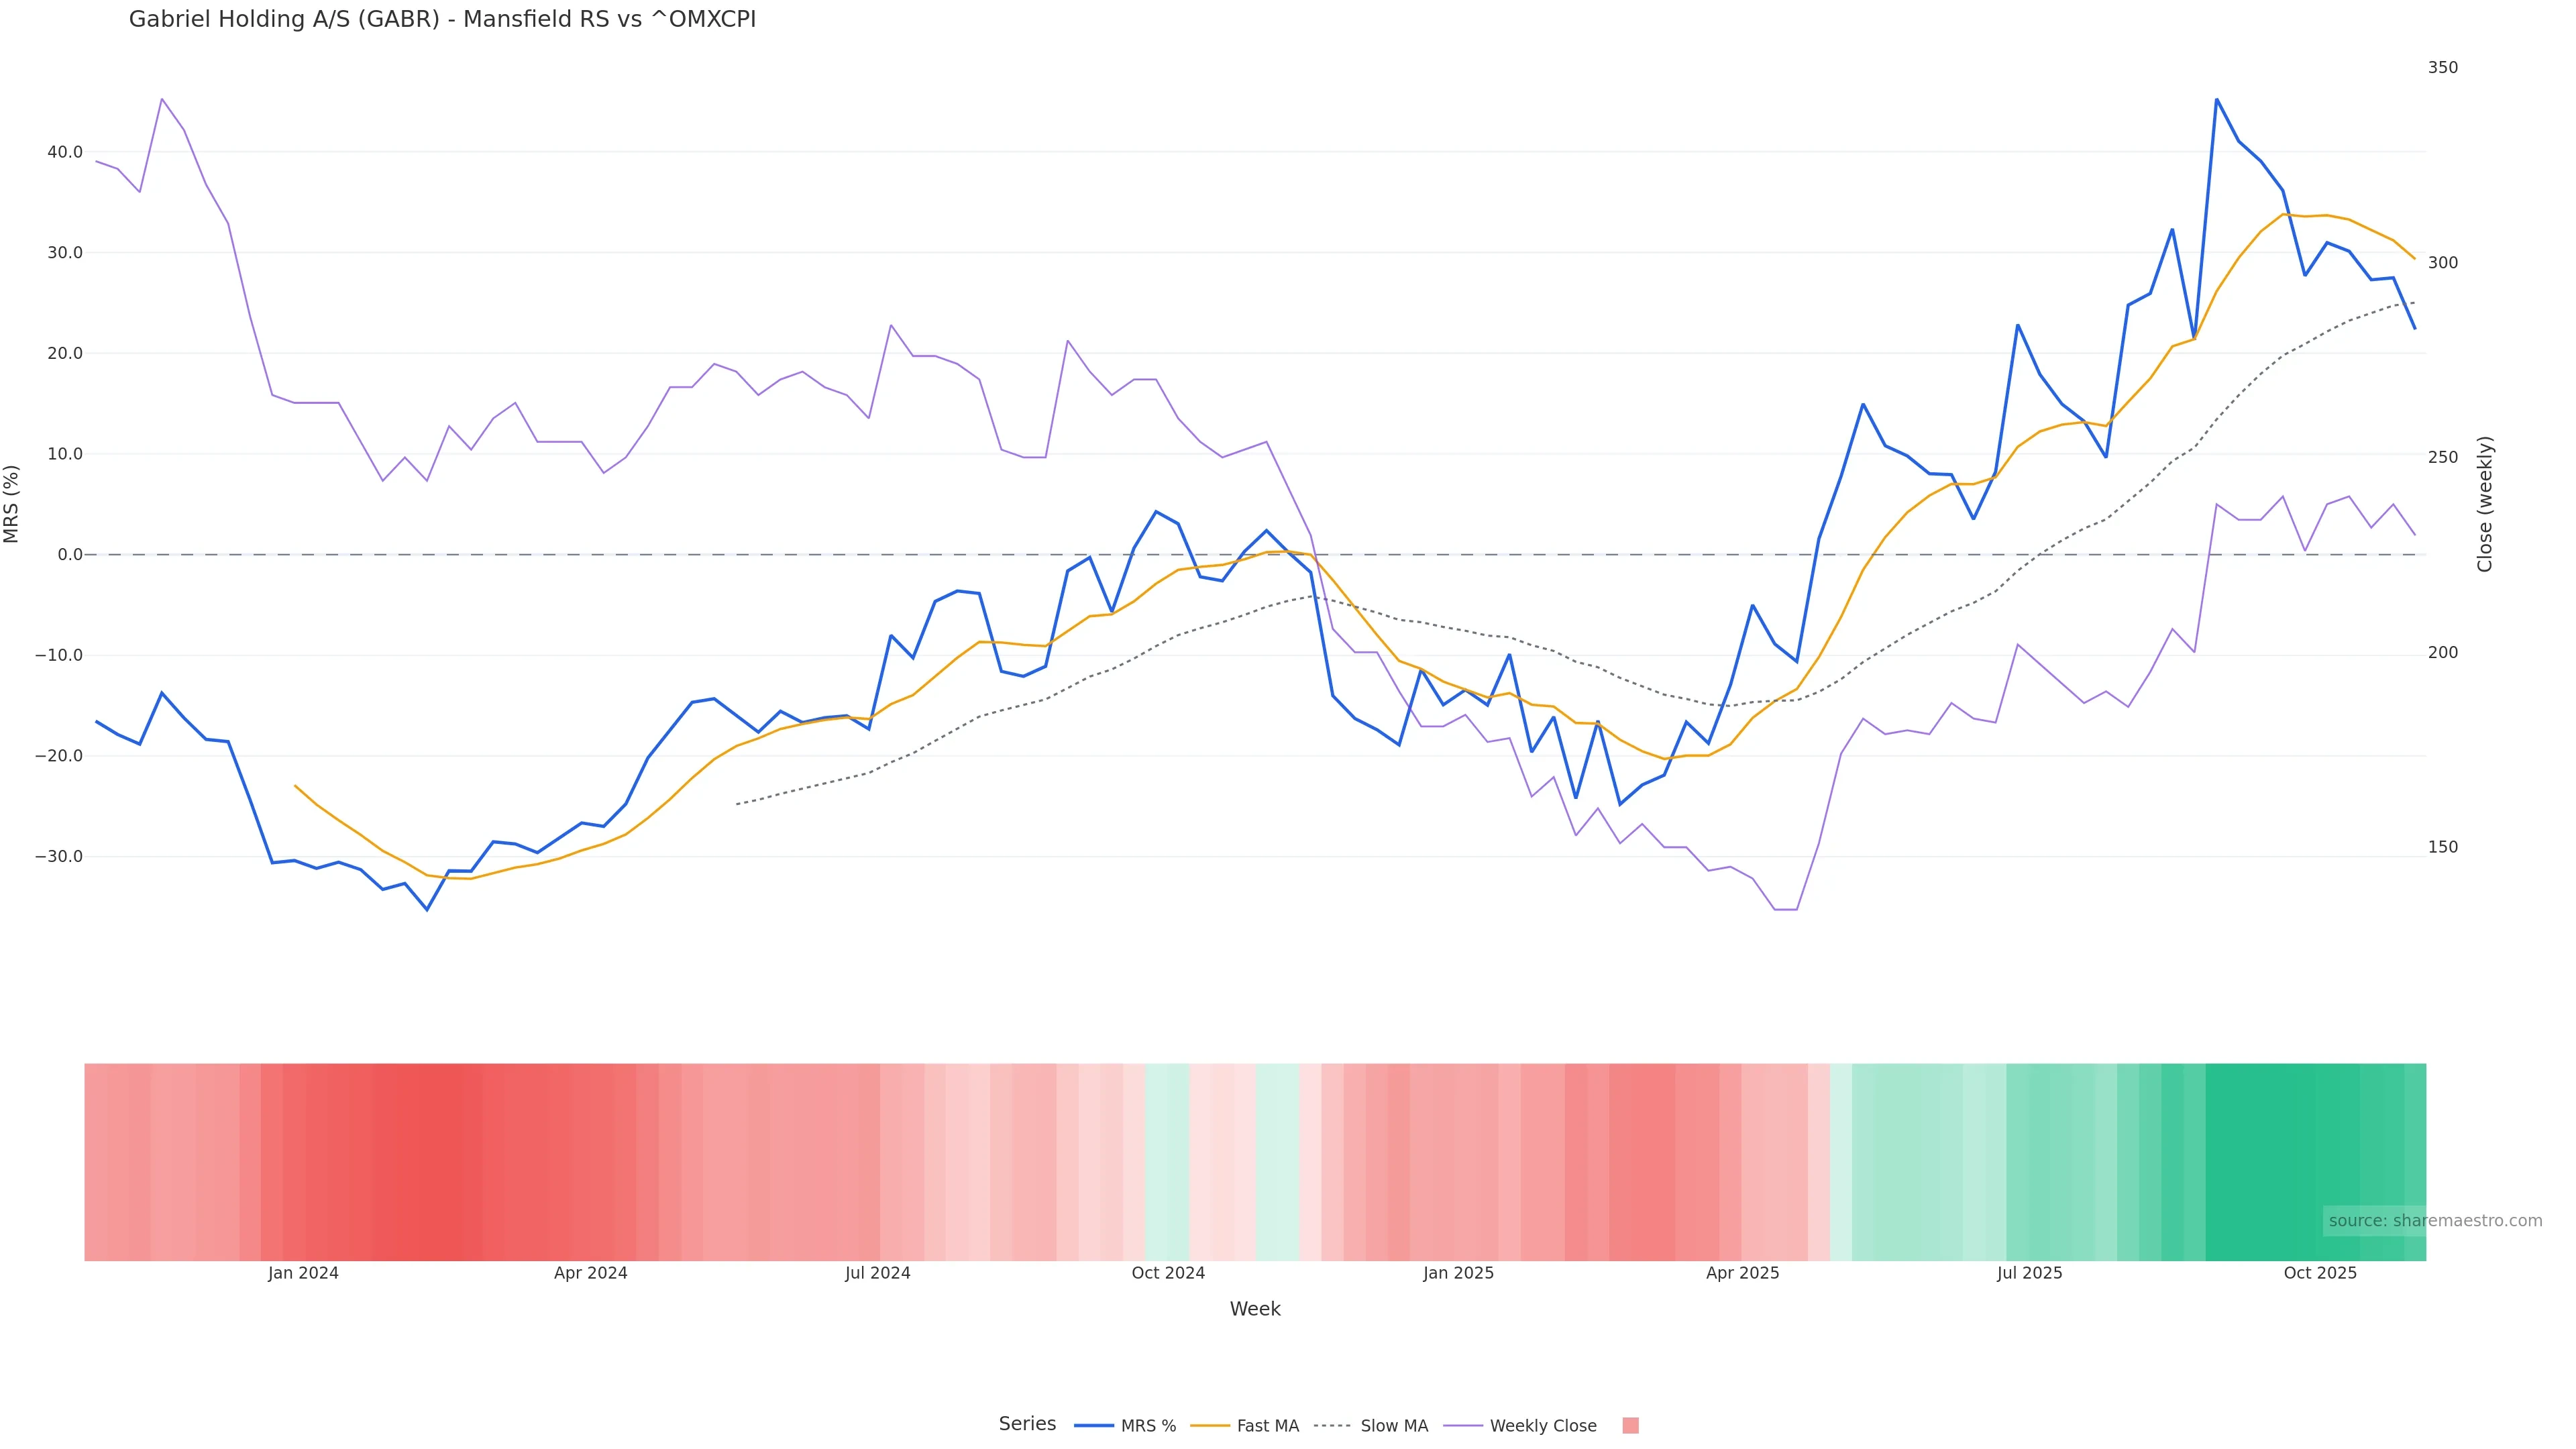
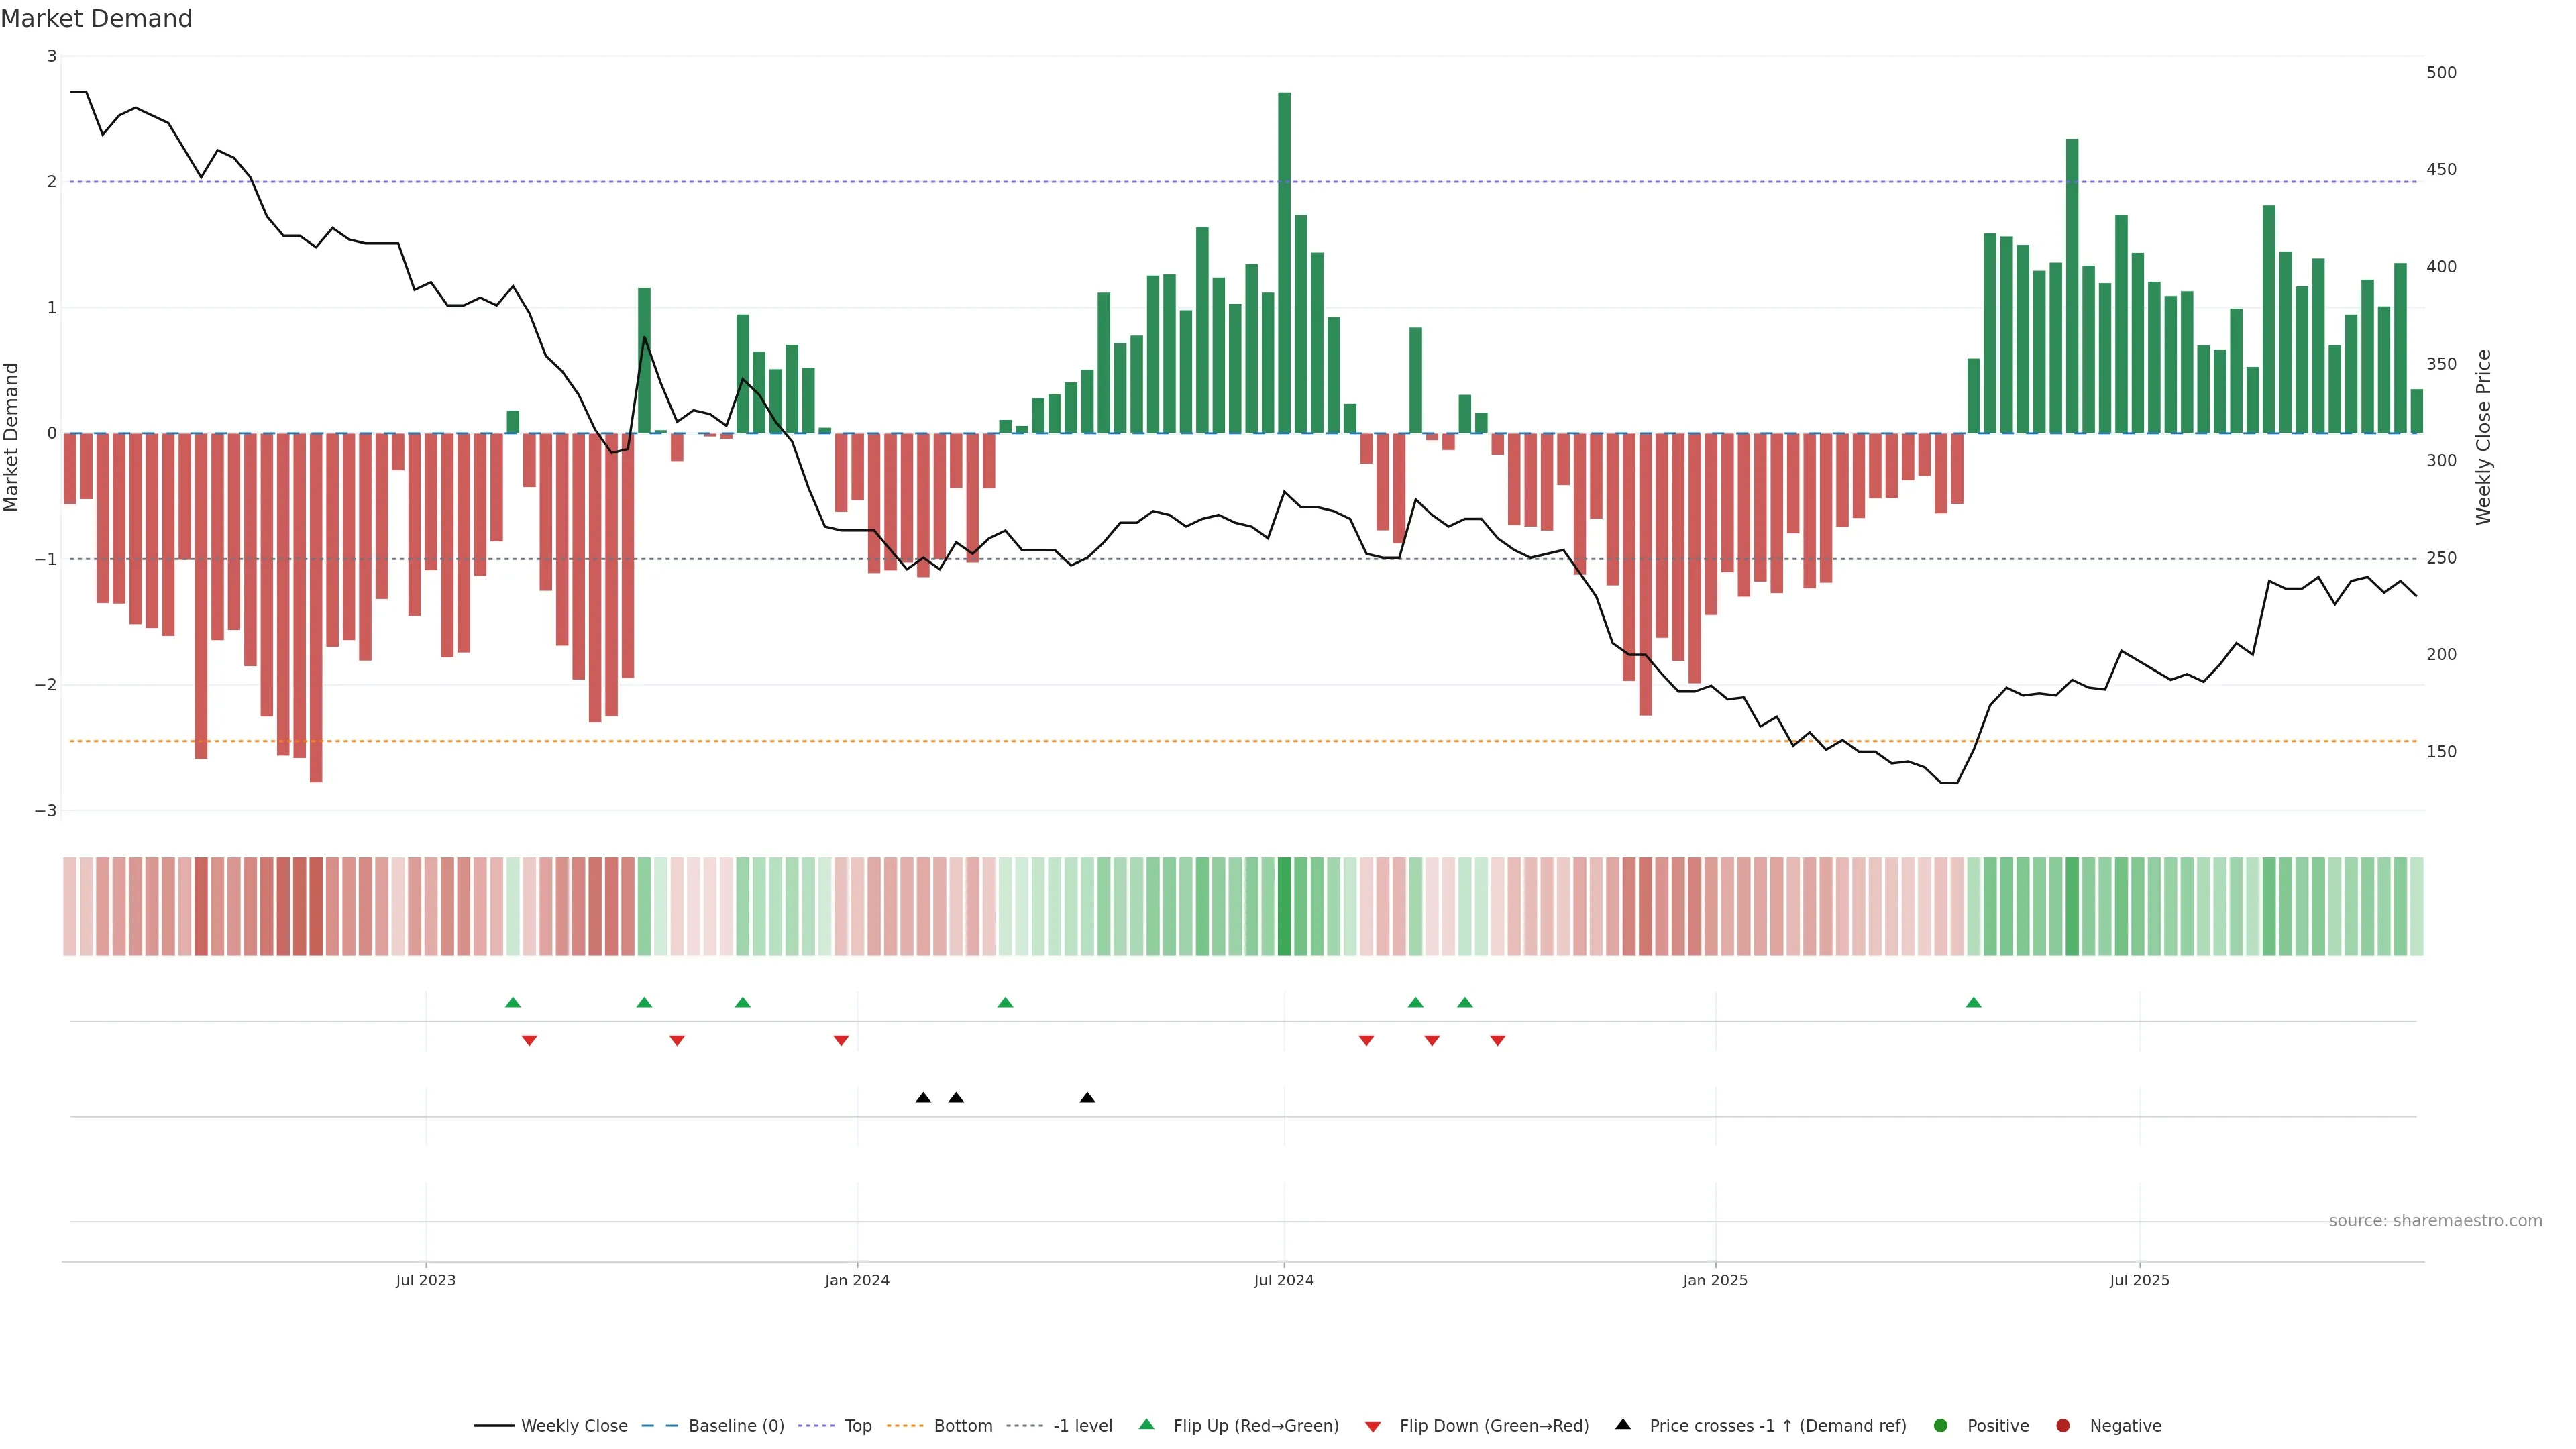
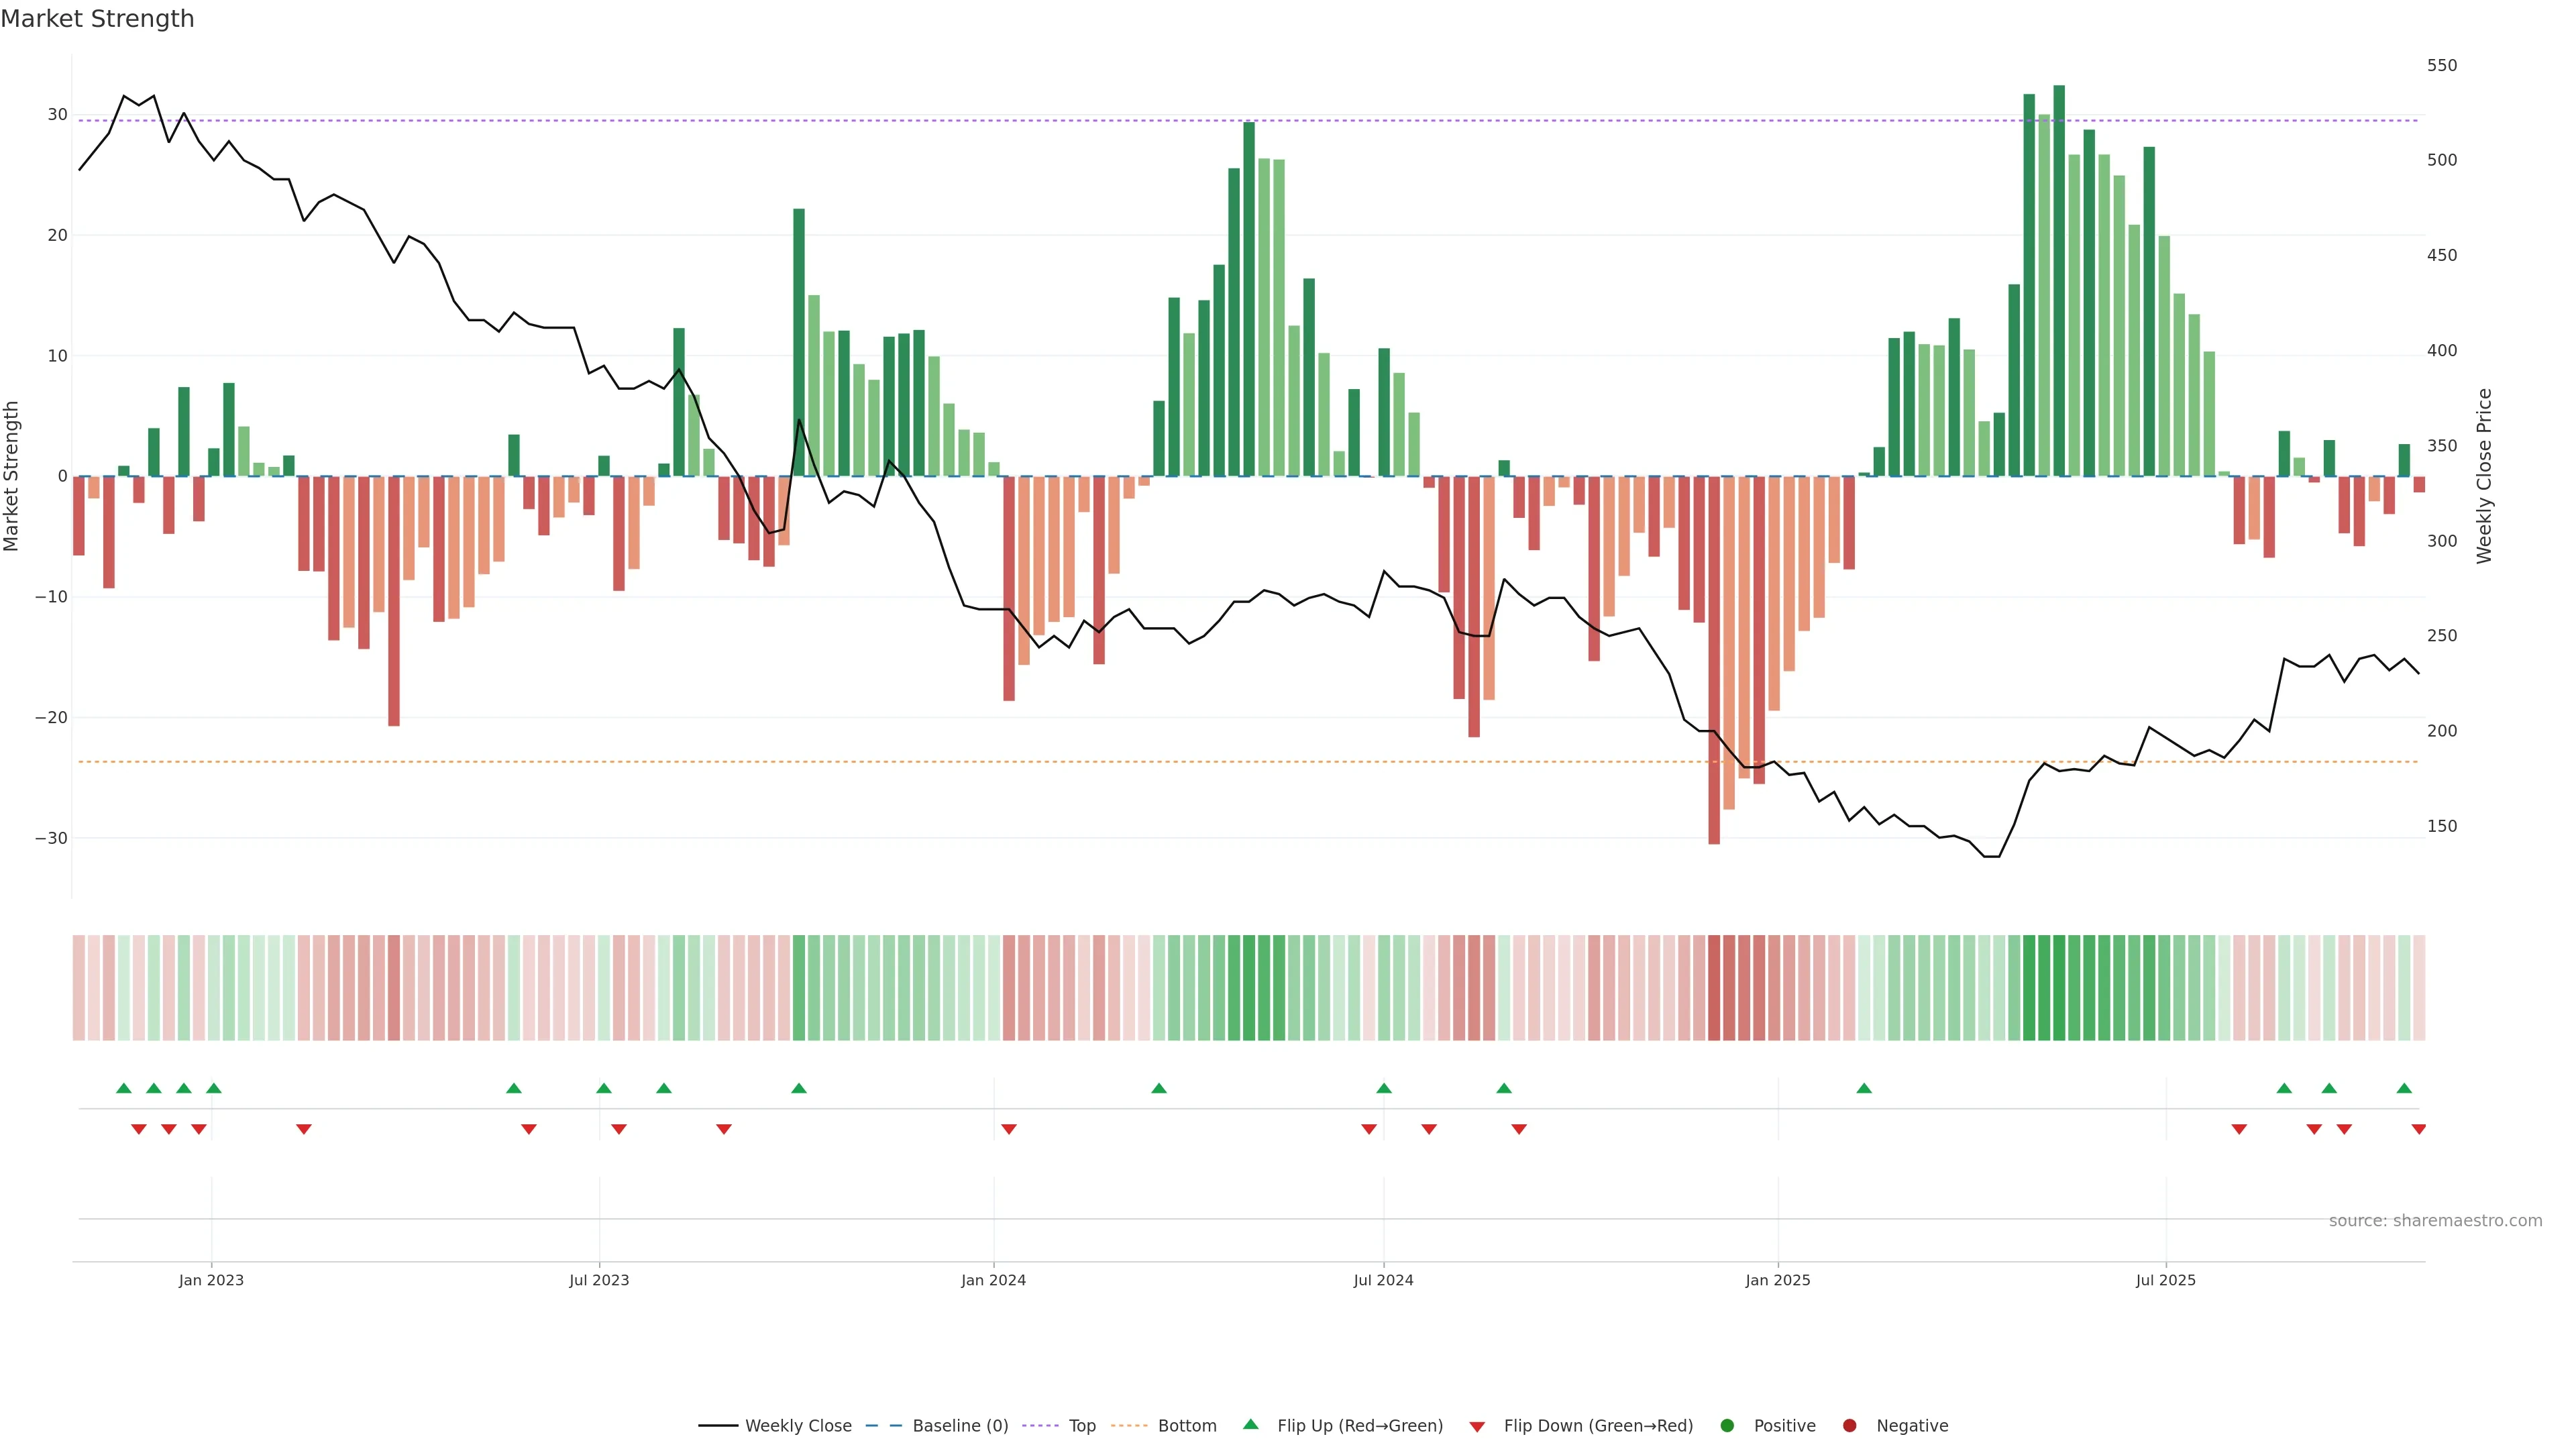
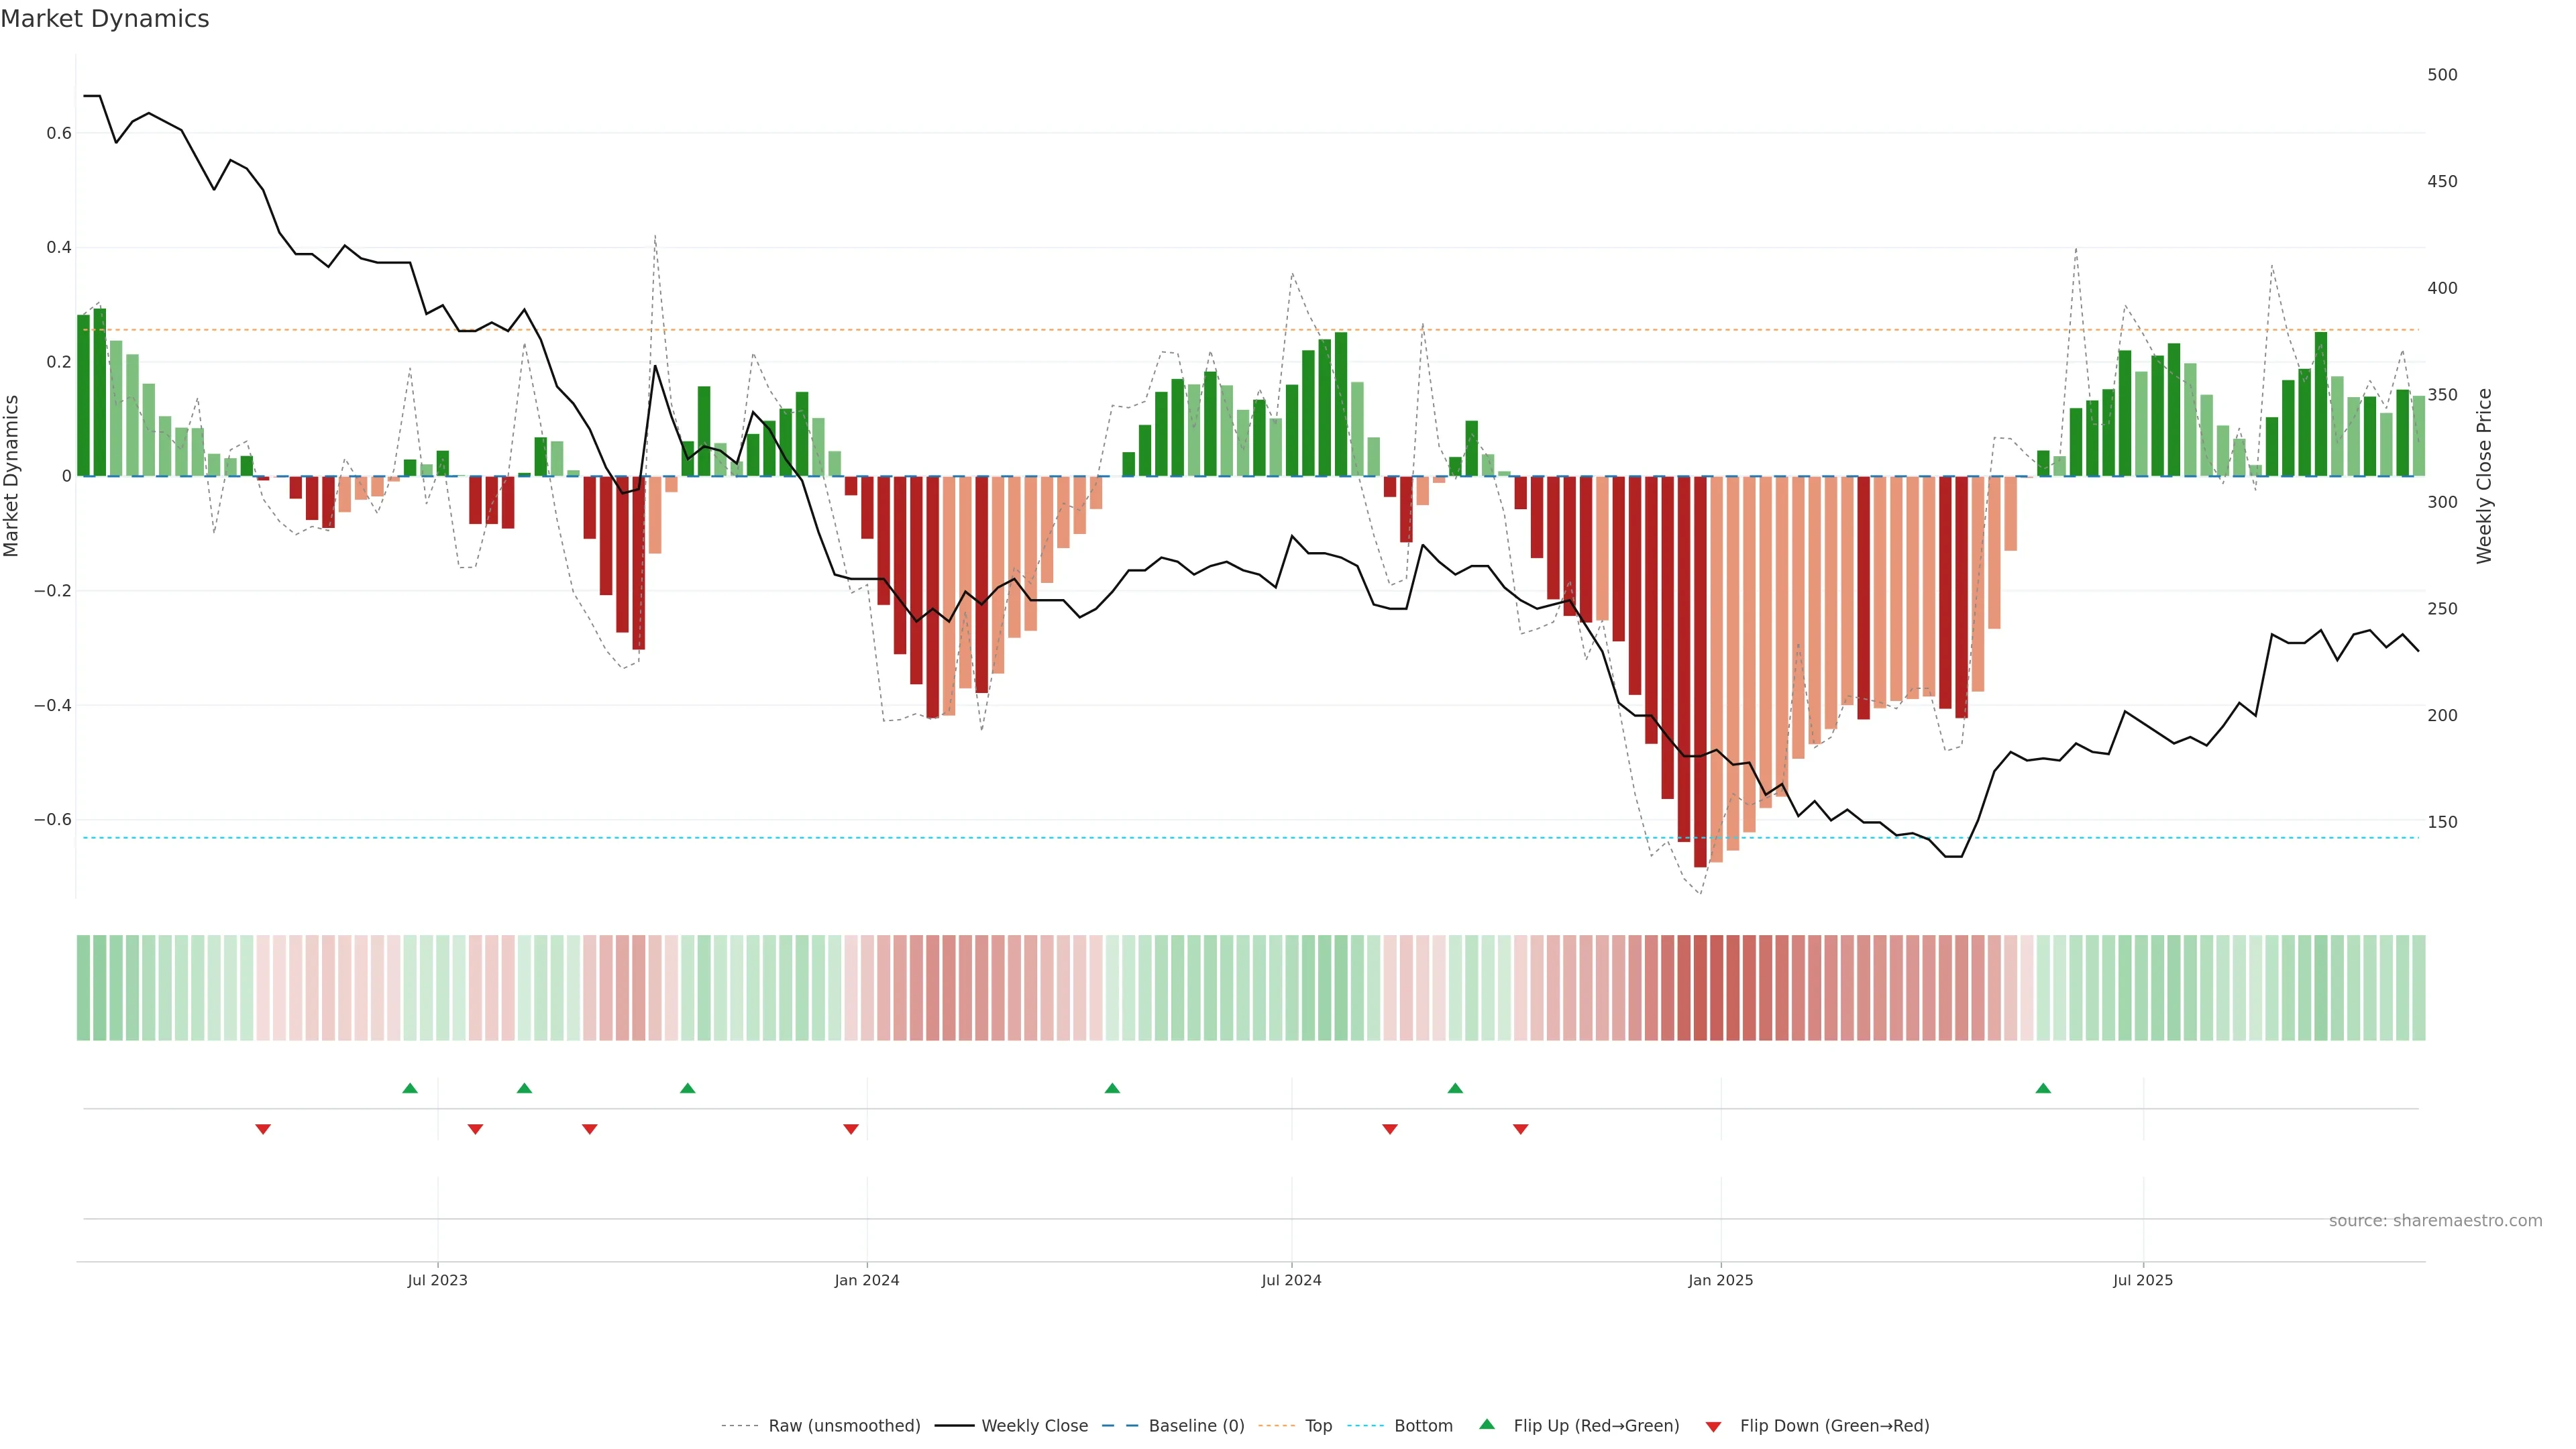
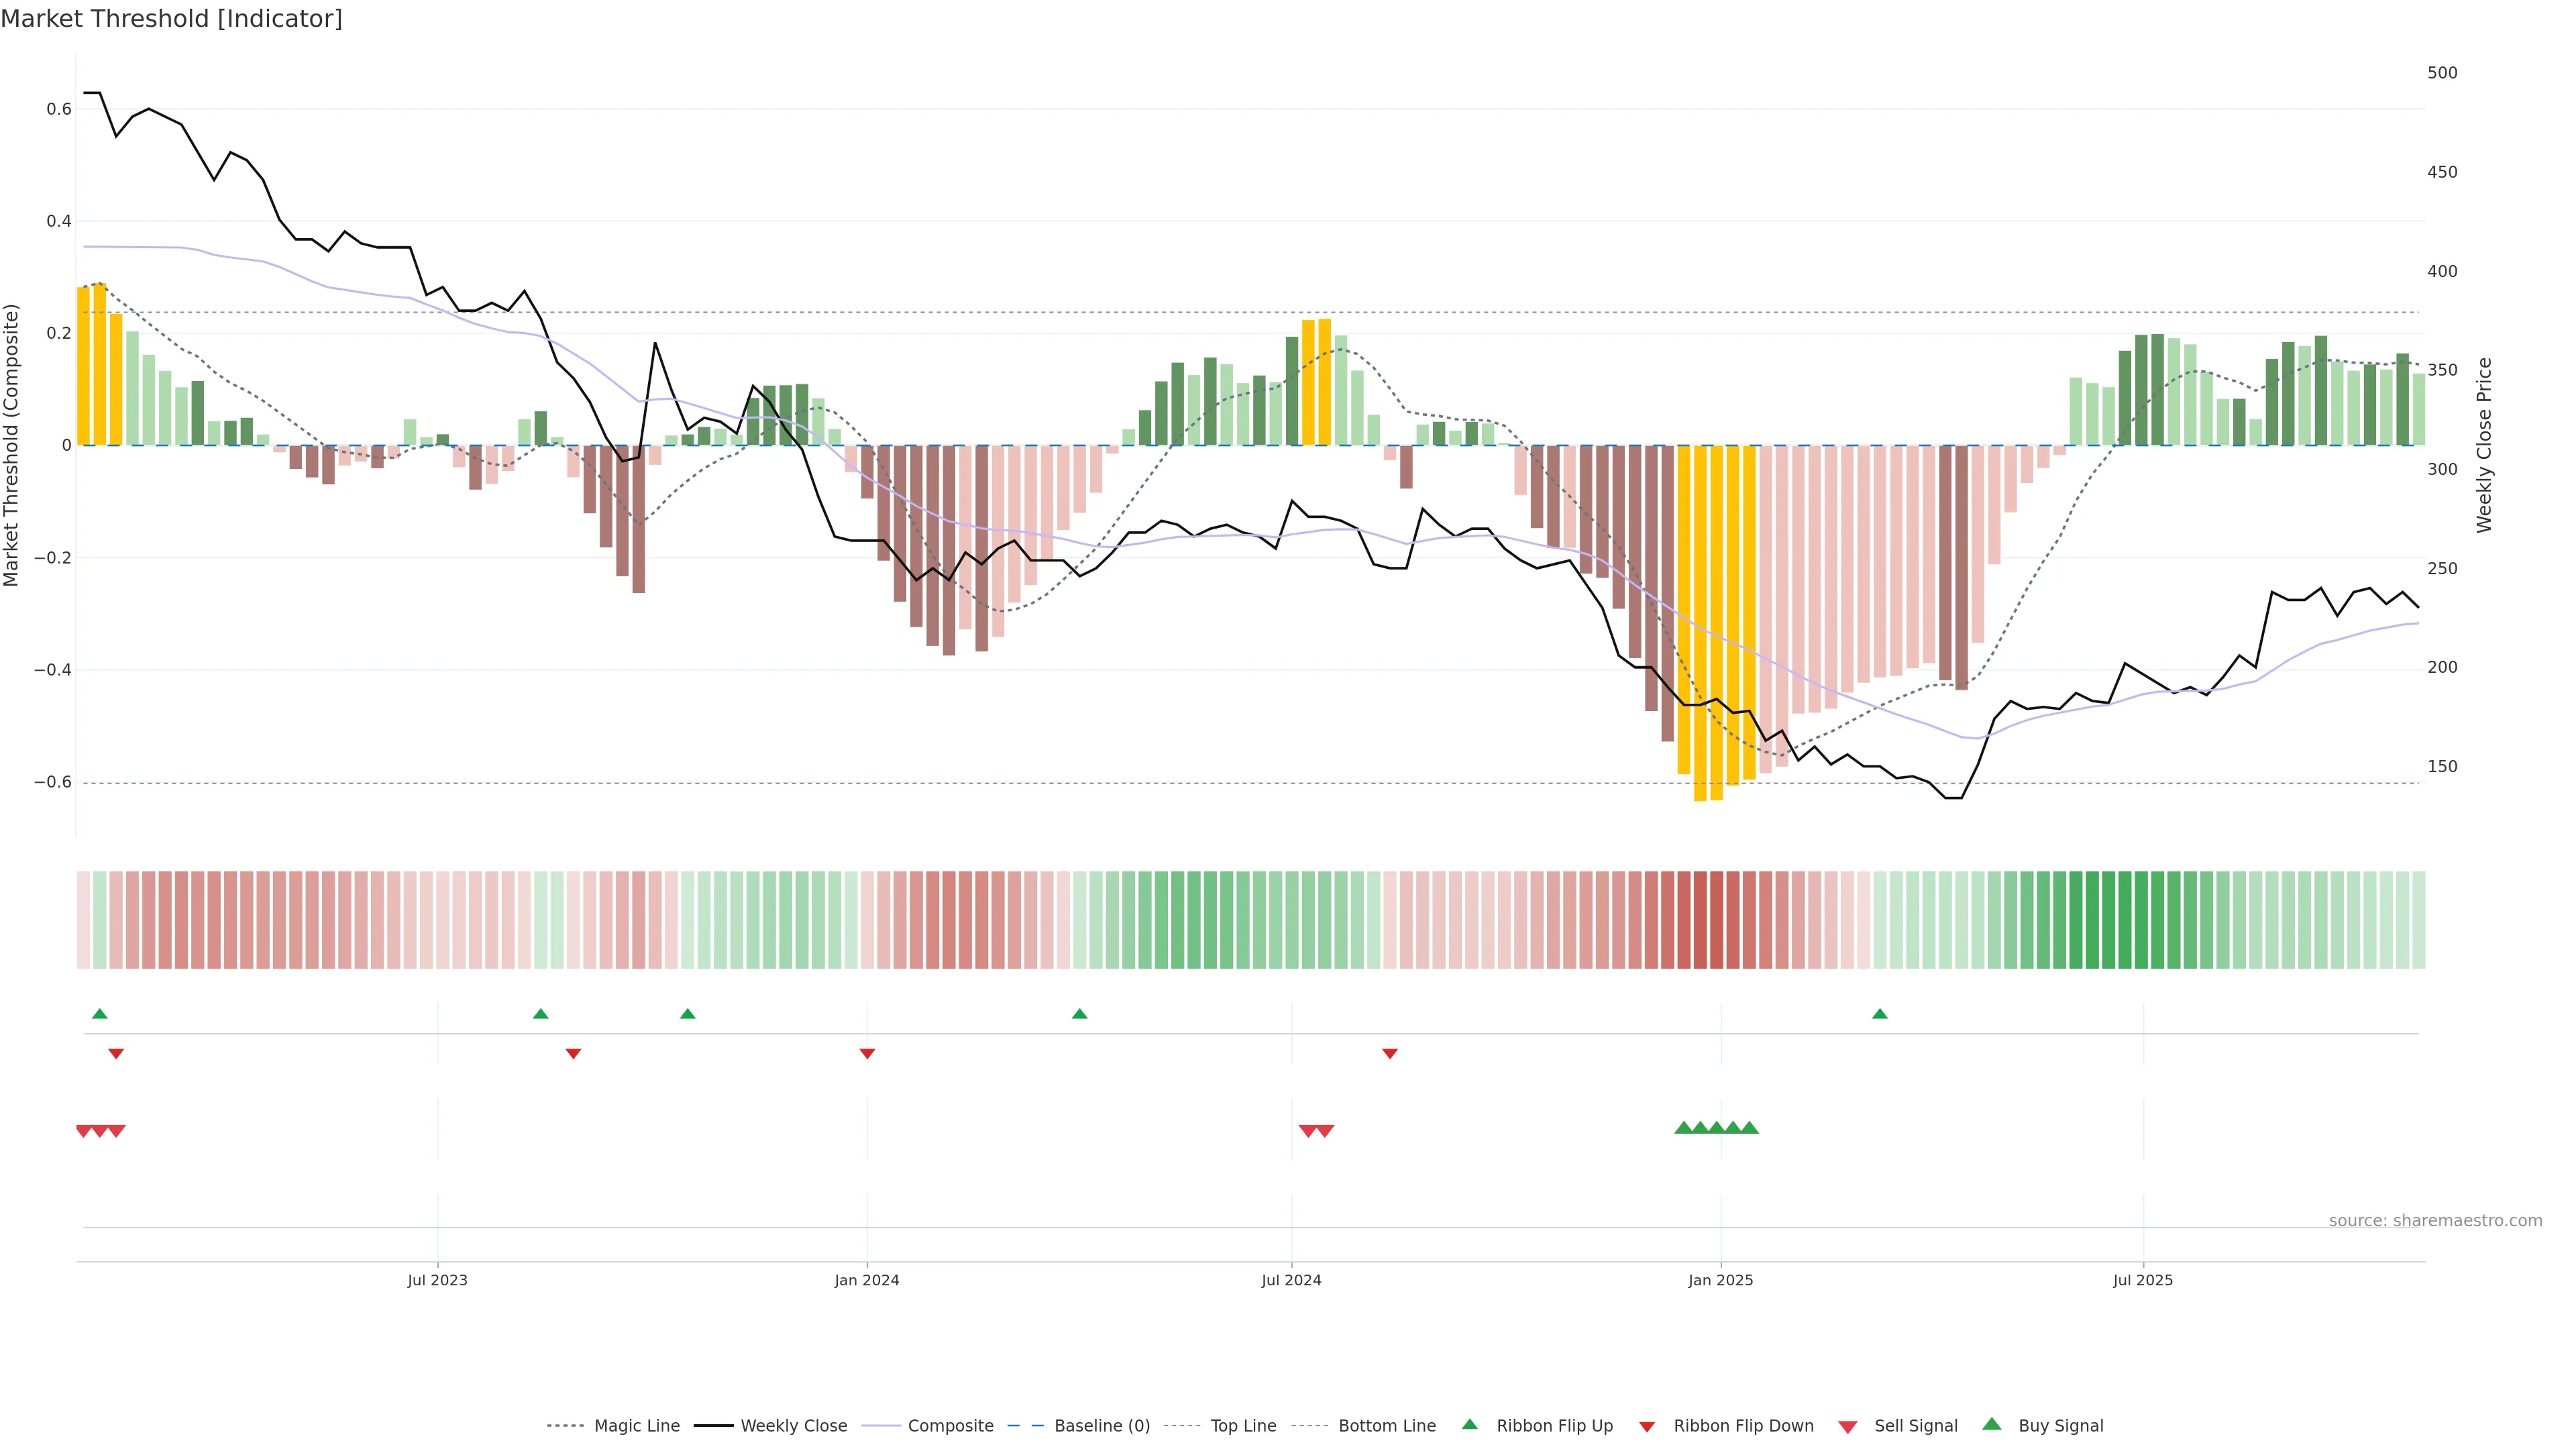
Logo
Please rotate your device

Landscape orientation recommended.

Menu

No results found.

GABR
Gabriel Holding A/S – CPH
“Patience reduces risk more reliably than prediction.”
Weekly Share Price & Valuation Overview
Market Overview
Open
242.0000
Close
234.0000
High
242.0000
Low
234.0000
Trend
0.68832

Gabriel Holding A/S

Denmark • CPH - Copenhagen Stock Exchange • GABR • Currency: DKK

Gabriel Holding A/S develops, manufactures, and sells upholstery fabrics, components, upholstered surfaces, and related products and services in Denmark, other European Countries, the United States, Mexico, Asia, and internationally. It operates in two segments: Textile and Rental Offices. The company offers furniture fabrics and related textile products to manufacturers and customers in upholstered furniture, seats, and upholstered surfaces. It is involved in letting office activities. The company was founded in 1851 and is based in Aalborg, Denmark.

Key strengths
  • High gross margin (≥35%) suggests strong pricing power or cost control.
  • Revenue growth ≥10% indicates solid top-line momentum.
  • Earnings growth ≥10% supports improving profitability trajectory.
Scale & Structure Core size and share structure. TTM values unless noted. “Estimated” where reconciled from per-share × shares.
Market Cap Total equity value of the company (share price × shares outstanding).
DKK 442.26M
Total Revenue (TTM) Sales over the last twelve months. May be estimated from revenue per share when inconsistent.
DKK 479.68M
Gross Profit (TTM) Revenue minus cost of goods sold over the last twelve months. Hidden for financial institutions or if redundant.
DKK 246.28M
EBITDA (TTM) Earnings before interest, taxes, depreciation and amortization (TTM). Hidden for financials or if implausible.
DKK 27.97M
Revenue per Share (TTM) Total revenue divided by shares outstanding (may be estimated).
DKK 253.80
EPS (TTM) Earnings per share over the last twelve months (may be estimated from net income ÷ shares).
13.81
Shares Outstanding
1.89M
Float Shares
1.60M
Implied Shares Outstanding
1.99M
Profitability & Efficiency TTM basis. “Reconciled” = numerator ÷ TTM revenue. Margins reflect latest TTM calculations.
Operating Margin (TTM) Operating income ÷ revenue over the last twelve months (reconciled when possible).
0.95%
EBITDA Margin (TTM) Reconciled EBITDA ÷ revenue over the last twelve months (suppressed if EBITDA implausible/financials).
5.83%
Gross Margin (TTM) Reconciled Strong Gross profit ÷ revenue over the last twelve months (reconciled when possible).
51.34%
Profit Margin (TTM) Net income ÷ revenue over the last twelve months (reconciled when possible).
-0.98%
Growth Growth rates are YoY unless labeled QoQ.
Revenue Growth Strong Year-over-year revenue growth.
88.20%
Earnings Growth (YoY) Strong Year-over-year earnings growth.
91.90%
Earnings Growth (QoQ) Quarter-over-quarter earnings growth.
91.90%
Liquidity & Solvency Balance-sheet health. Debt metrics shown as latest ratios; D/E is a ratio (not %).
Debt to Equity Total debt ÷ shareholder equity; leverage.
1.43
Sharemaestro House View
Confidence: 2 Sharemaestro internal conviction (0–3, higher is better). Risk: 1 Sharemaestro internal risk profile (0–3, higher is safer). Operational: 1 Operational quality/consistency (0–3, higher is better). Composite Score: 3 Overall internal composite (0–3, higher is better). Suggested Allocation: 5.00% Indicative portfolio weighting suggestion based on house view.
Structural Insights (experimental)
Ownership & Liquidity
Free Float Proportion of shares available for public trading. 84.7%
Insiders Shares held by company insiders (officers, directors). 60.9%
Institutions Shares held by institutions (funds, pensions). 17.5%
Capital Structure
Potential Dilution Increase in share count if options/convertibles exercise.
5.1%
Net Debt Total debt − cash (negative = net cash).
None
Resilience Score 0–100 composite of liquidity, leverage and cash conversion; higher is better. If inputs are unavailable, we estimate using proxies (Net debt vs revenue, Cash-to-Debt). It is a guide, not a rating. 100
Methodology Notes
  • Margins shown on a TTM basis. “Reconciled” = numerator ÷ TTM revenue for internal consistency.
As of: 2025-09-09 12:46

Disclaimer: Information is compiled from publicly available sources and is subject to errors and omissions. It is provided as a guide only and does not constitute investment advice. Please do your own research.

Performance Edge: Signals that work. Valuations that spot mispricing early. A disciplined, data-driven methodology powered by machine learning. Sharemaestro helps high-net-worth investors, hedge funds, family offices, and institutions move sooner - and with conviction - when the market presents asymmetric opportunity.
Subscribe to Sharemaestro: