Country Garden Services Holdings Company Limited
6098 HKG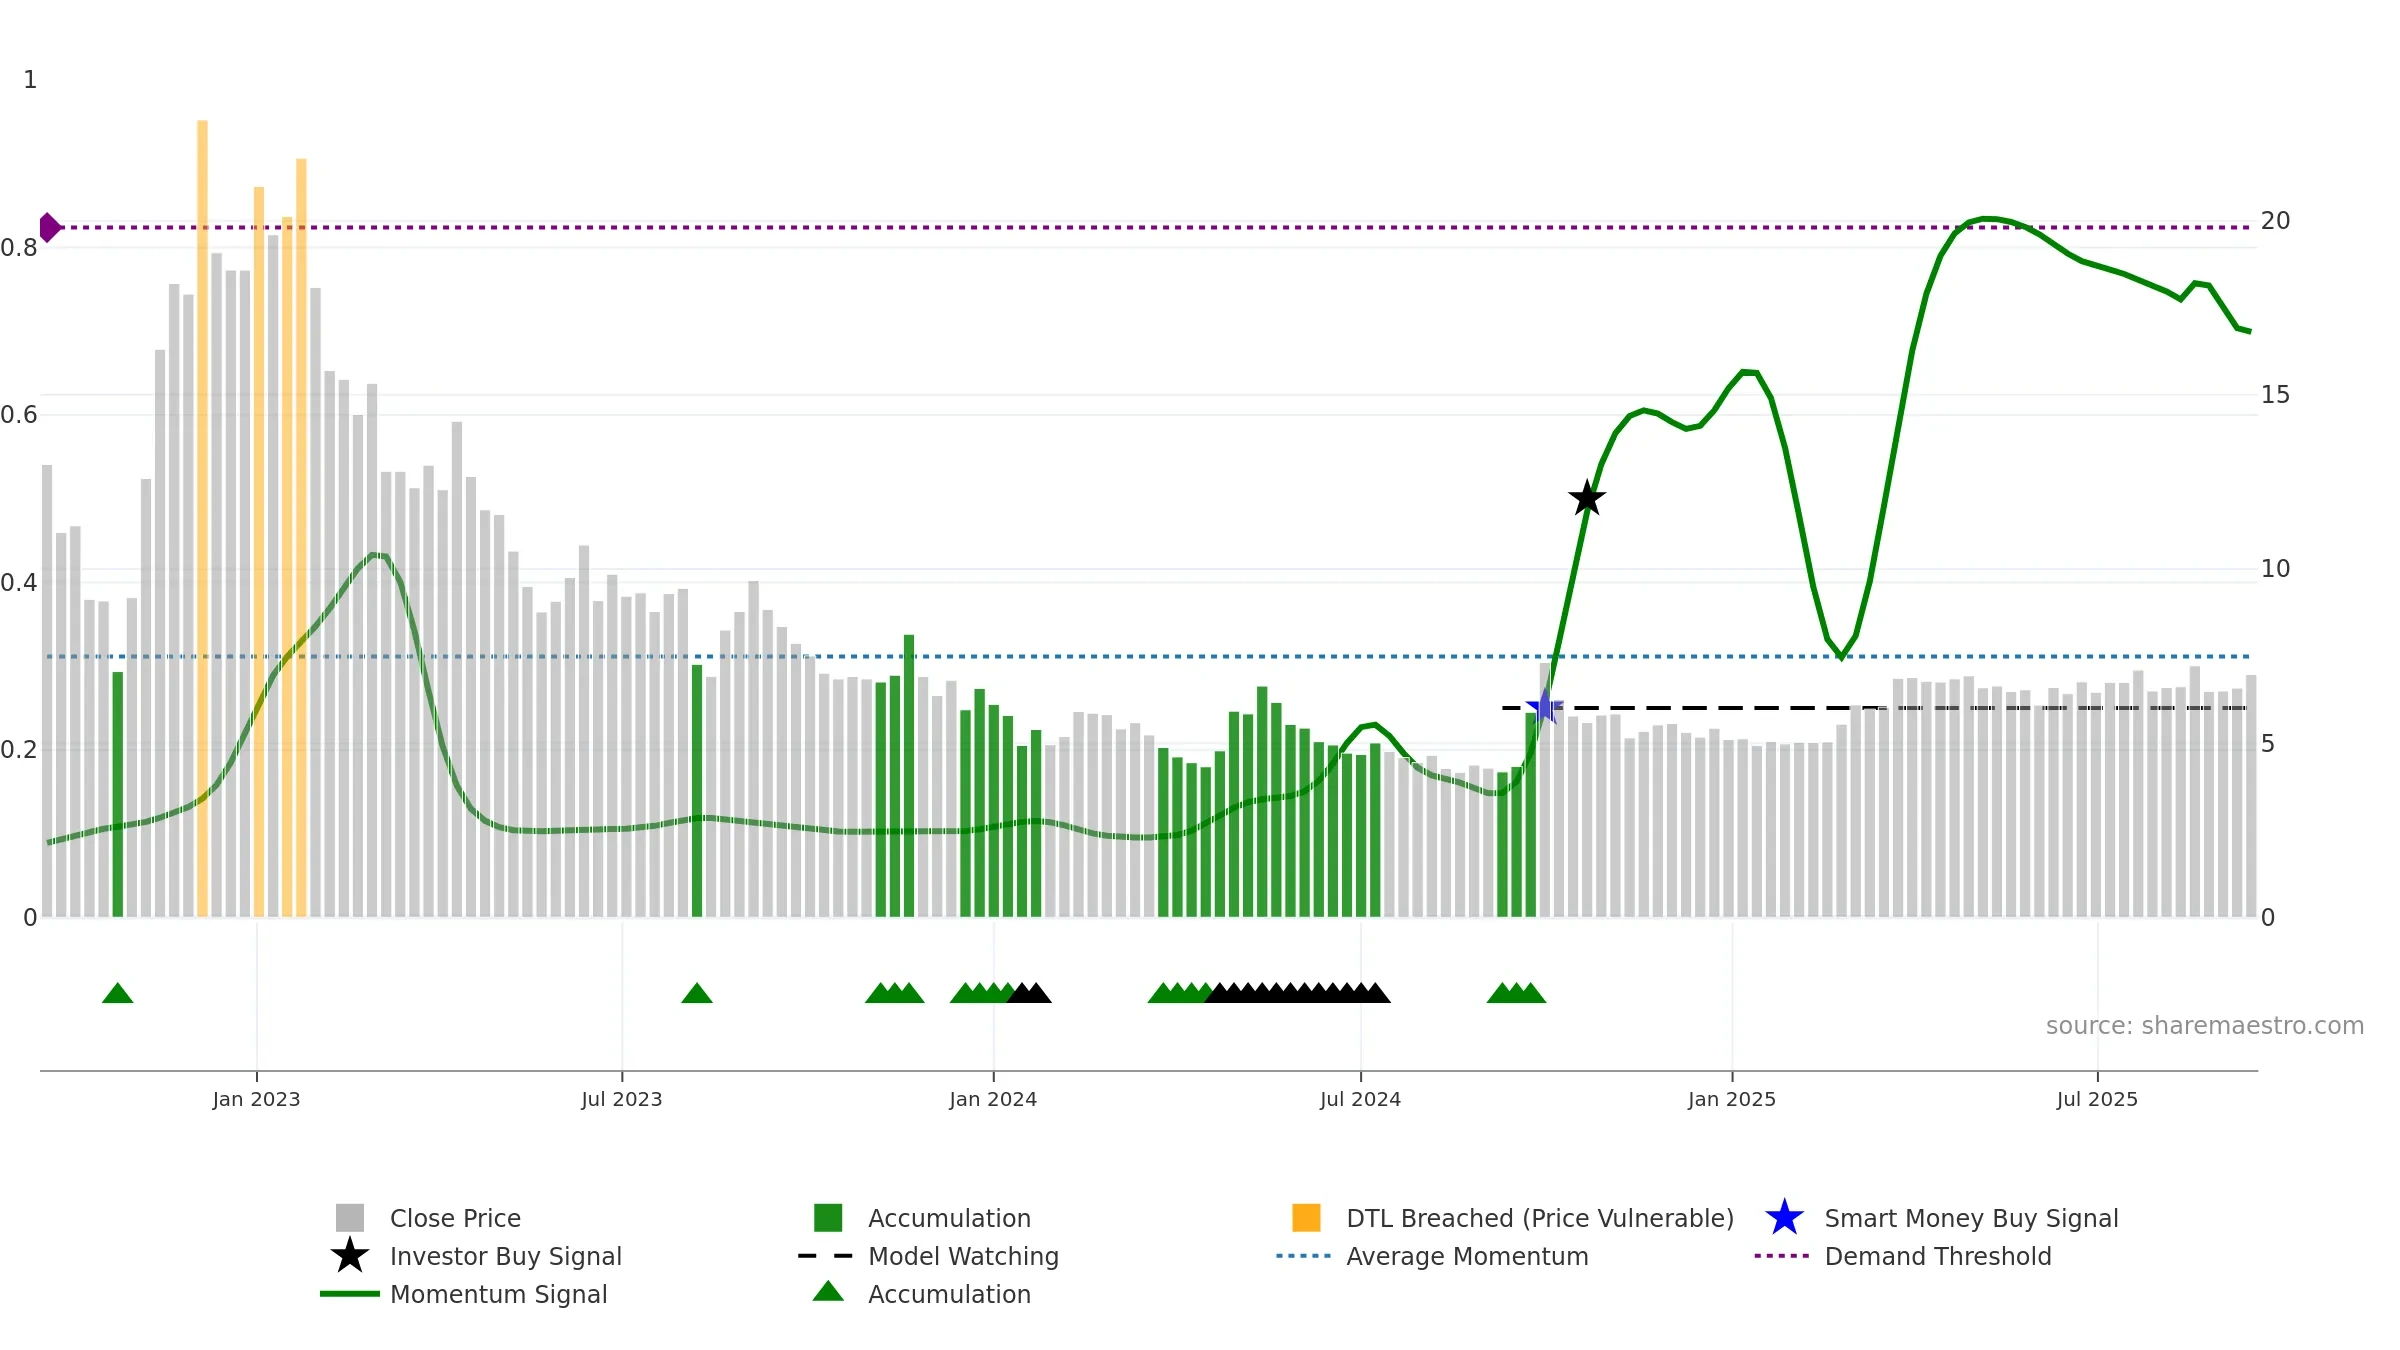
Weekly Report
Country Garden Services Holdings Company Limited closed at 6.9700 (-0.71% WoW) . Data window ends Mon, 15 Sep 2025.
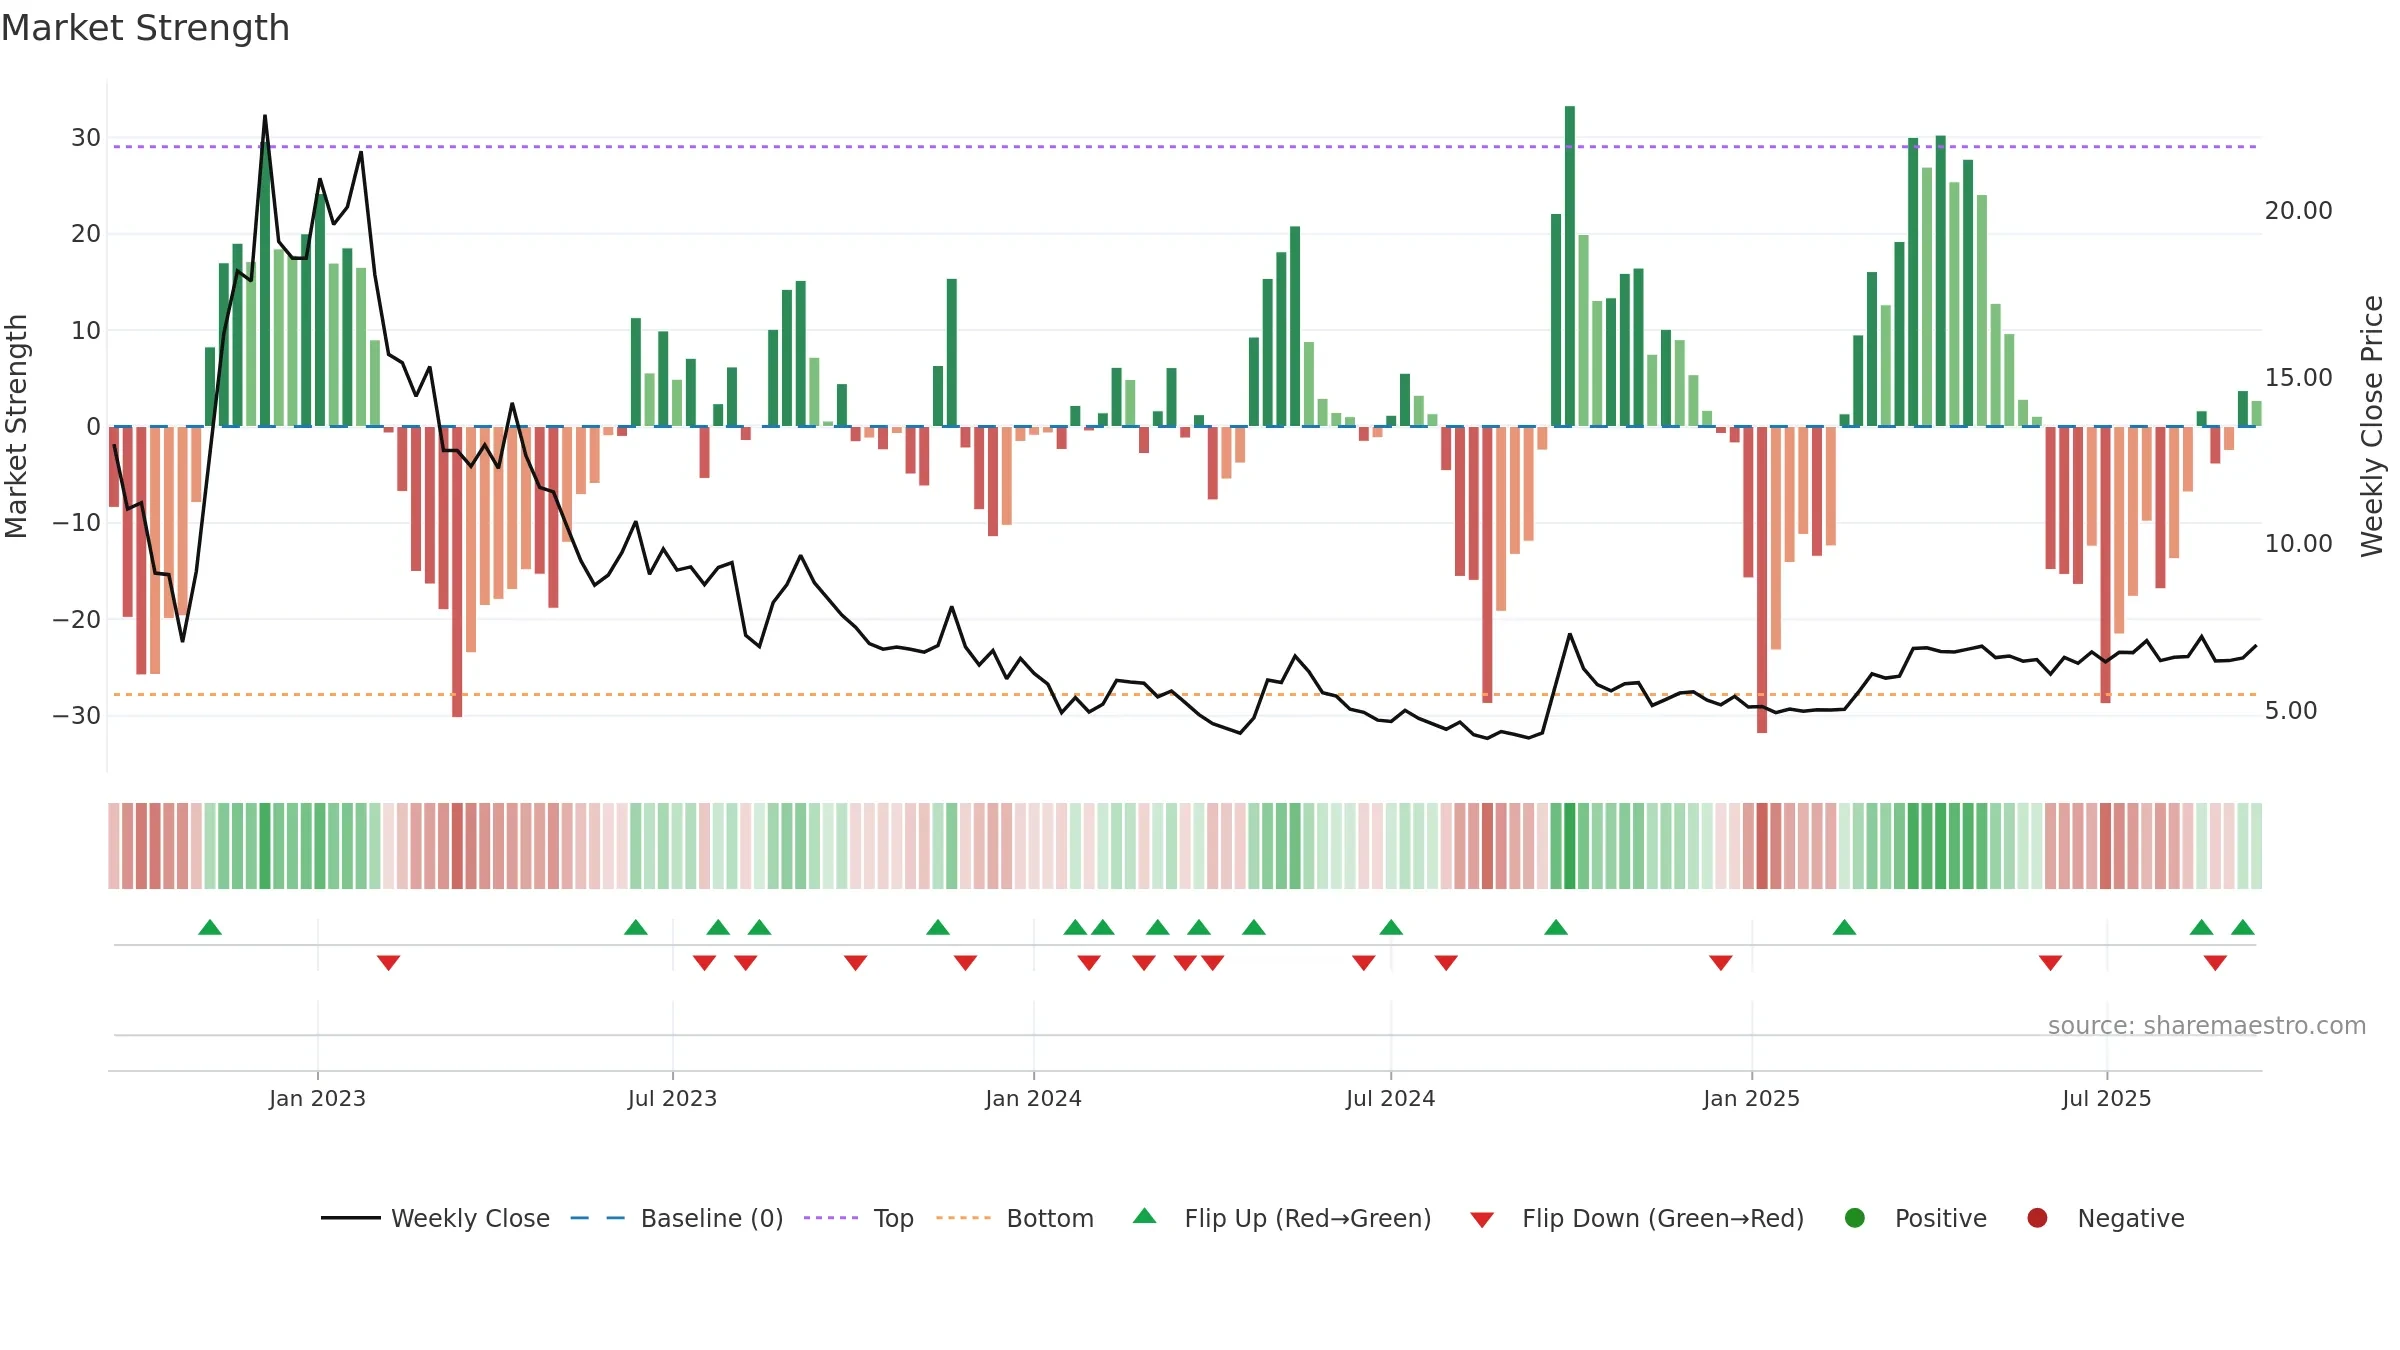
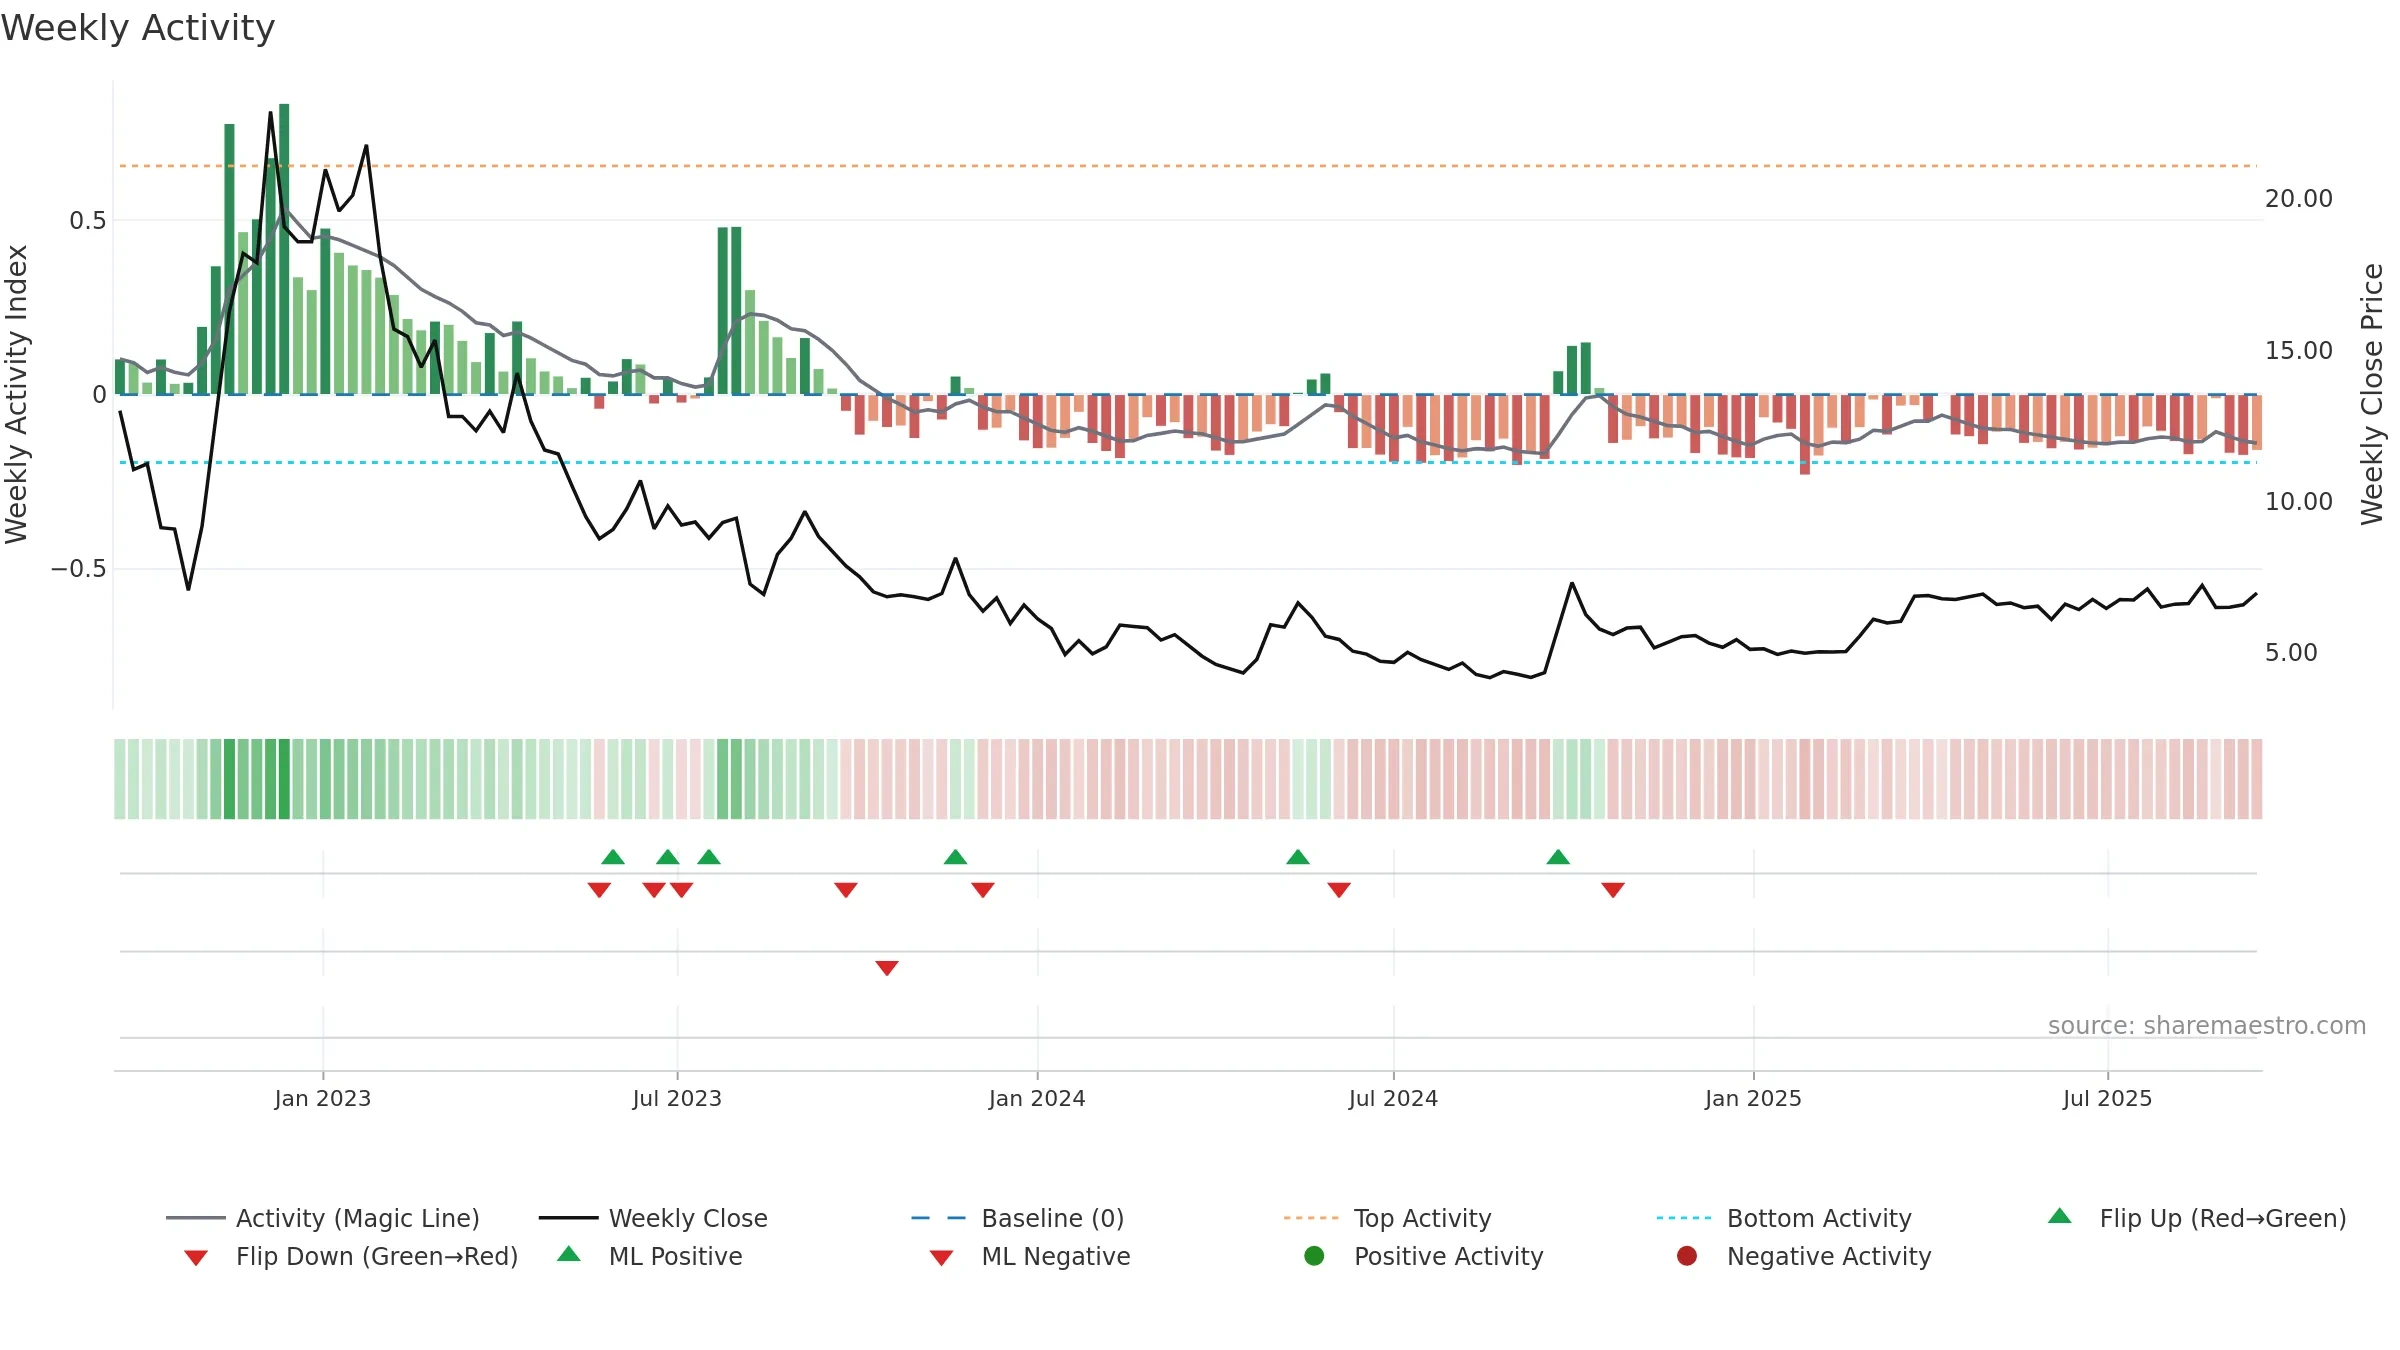
How to read this — Price slope is upward, indicating persistent buying over the window. Elevated weekly volatility increases whipsaw risk. Volume trend diverges from price — watch for fatigue or rotation. Returns are negatively correlated with volume — strength may come on lighter activity. Price holds above key averages, indicating constructive participation.
Up-slope supports buying interest; pullbacks may be contained if activity stays firm. Because liquidity isn’t confirming, prefer evidence of fresh demand before chasing moves.
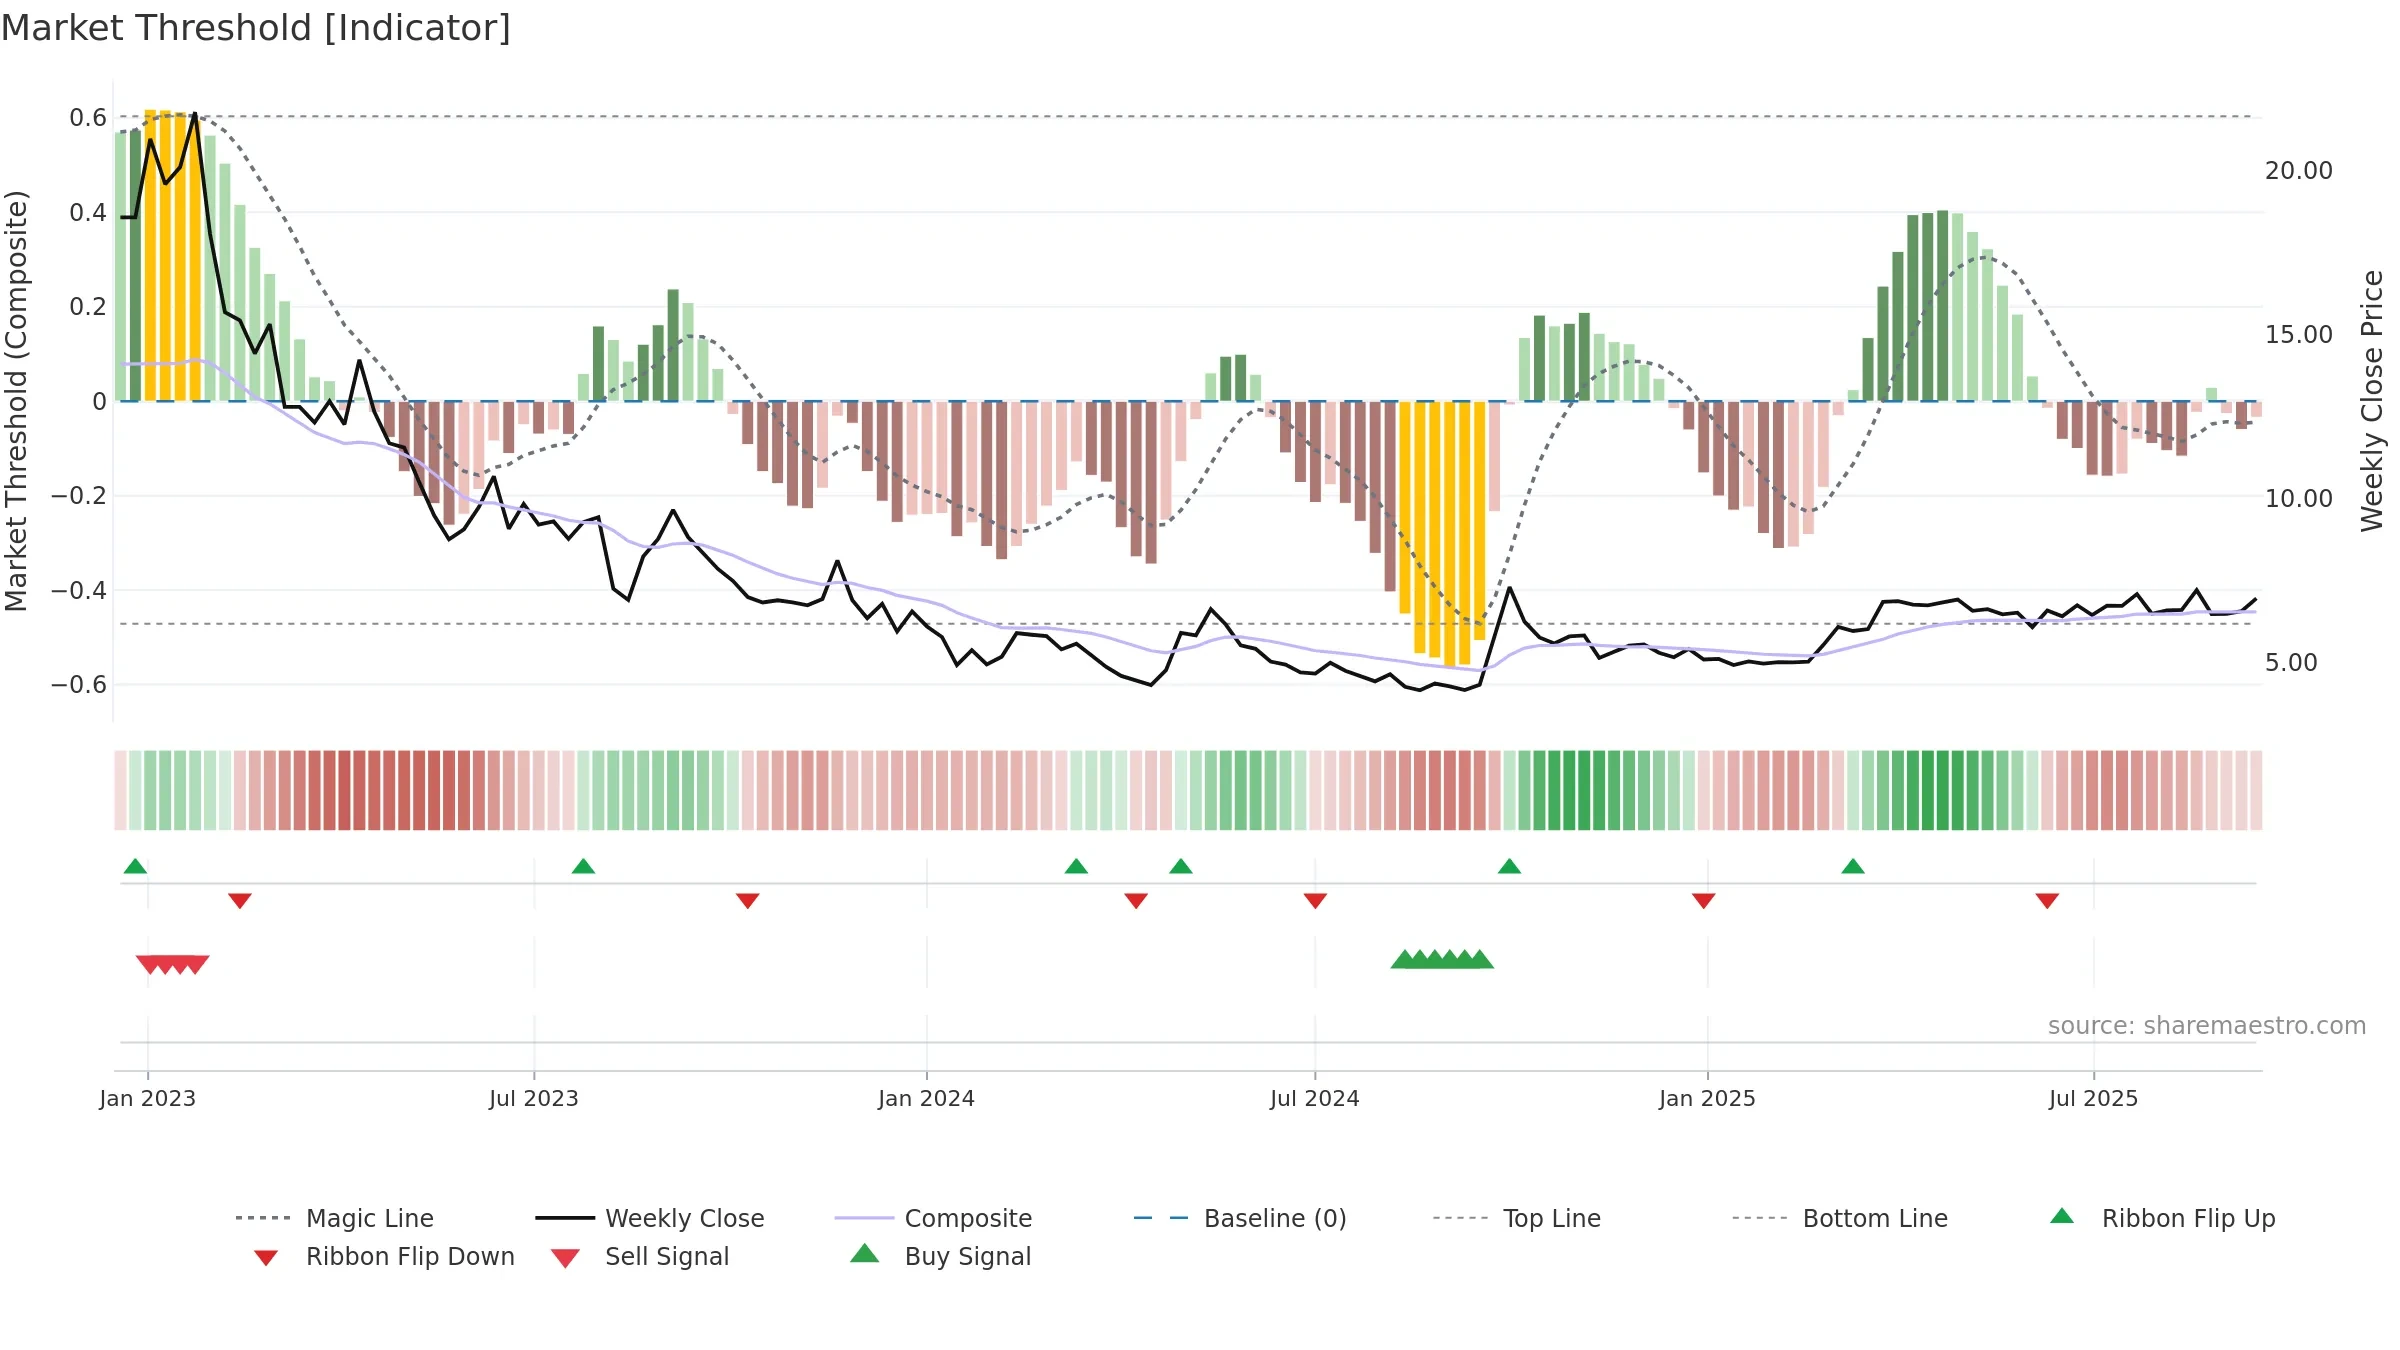
Gauge maps the trend signal to a 0–100 scale.
How to read this — Gauge is elevated but momentum is rolling over; topping risk is rising.
Stay alert: protect gains or seek confirmation before adding risk.
Conclusion
Negative setup. ★★☆☆☆ confidence. Price window: 7. Trend: Uptrend at Risk; gauge 69. In combination, liquidity diverges from price.
- Price holds above 8w & 26w averages
- High-level but rolling over (topping risk)
- Momentum is weak/falling
- Liquidity diverges from price
- High return volatility raises whipsaw risk
Why: Price window 7.23% over 8w. Close is -3.46% below the prior-window high. Return volatility 4.94%. Volume trend falling. Liquidity divergence with price. Trend state uptrend at risk. Momentum neutral and falling.
Tip: Most metrics include a hover tooltip where they appear in the report.