Osmond Resources Limited
OSM ASX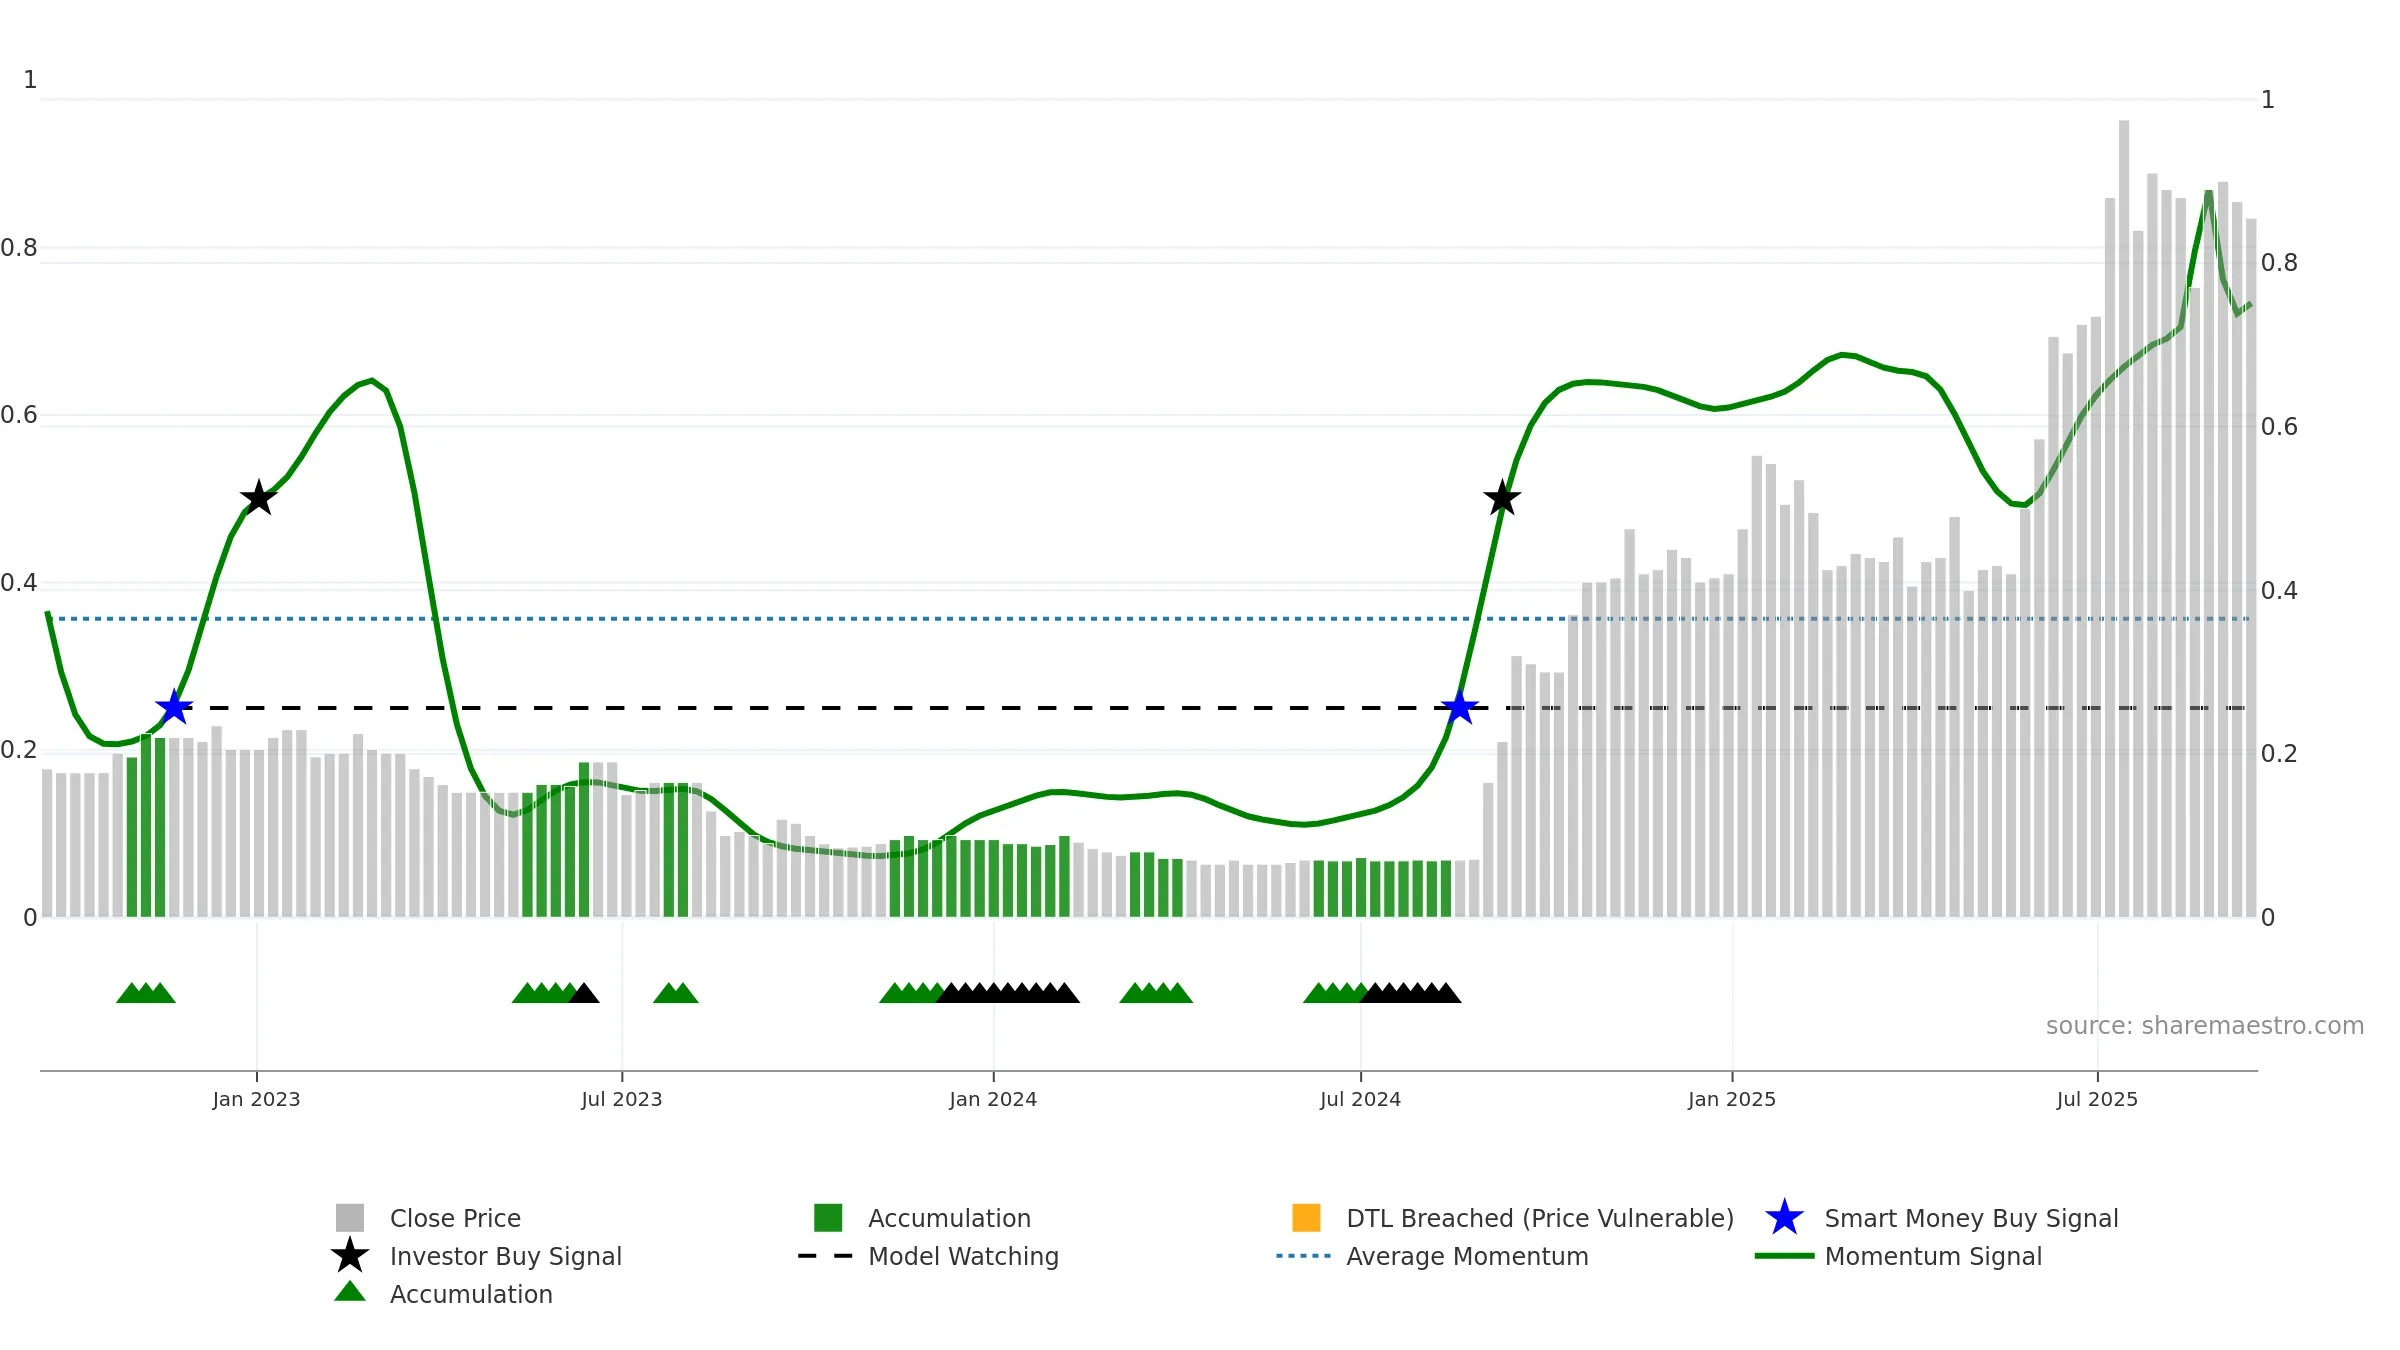
Weekly Report
Osmond Resources Limited closed at 0.8550 (-2.56% WoW) . Data window ends Mon, 15 Sep 2025.
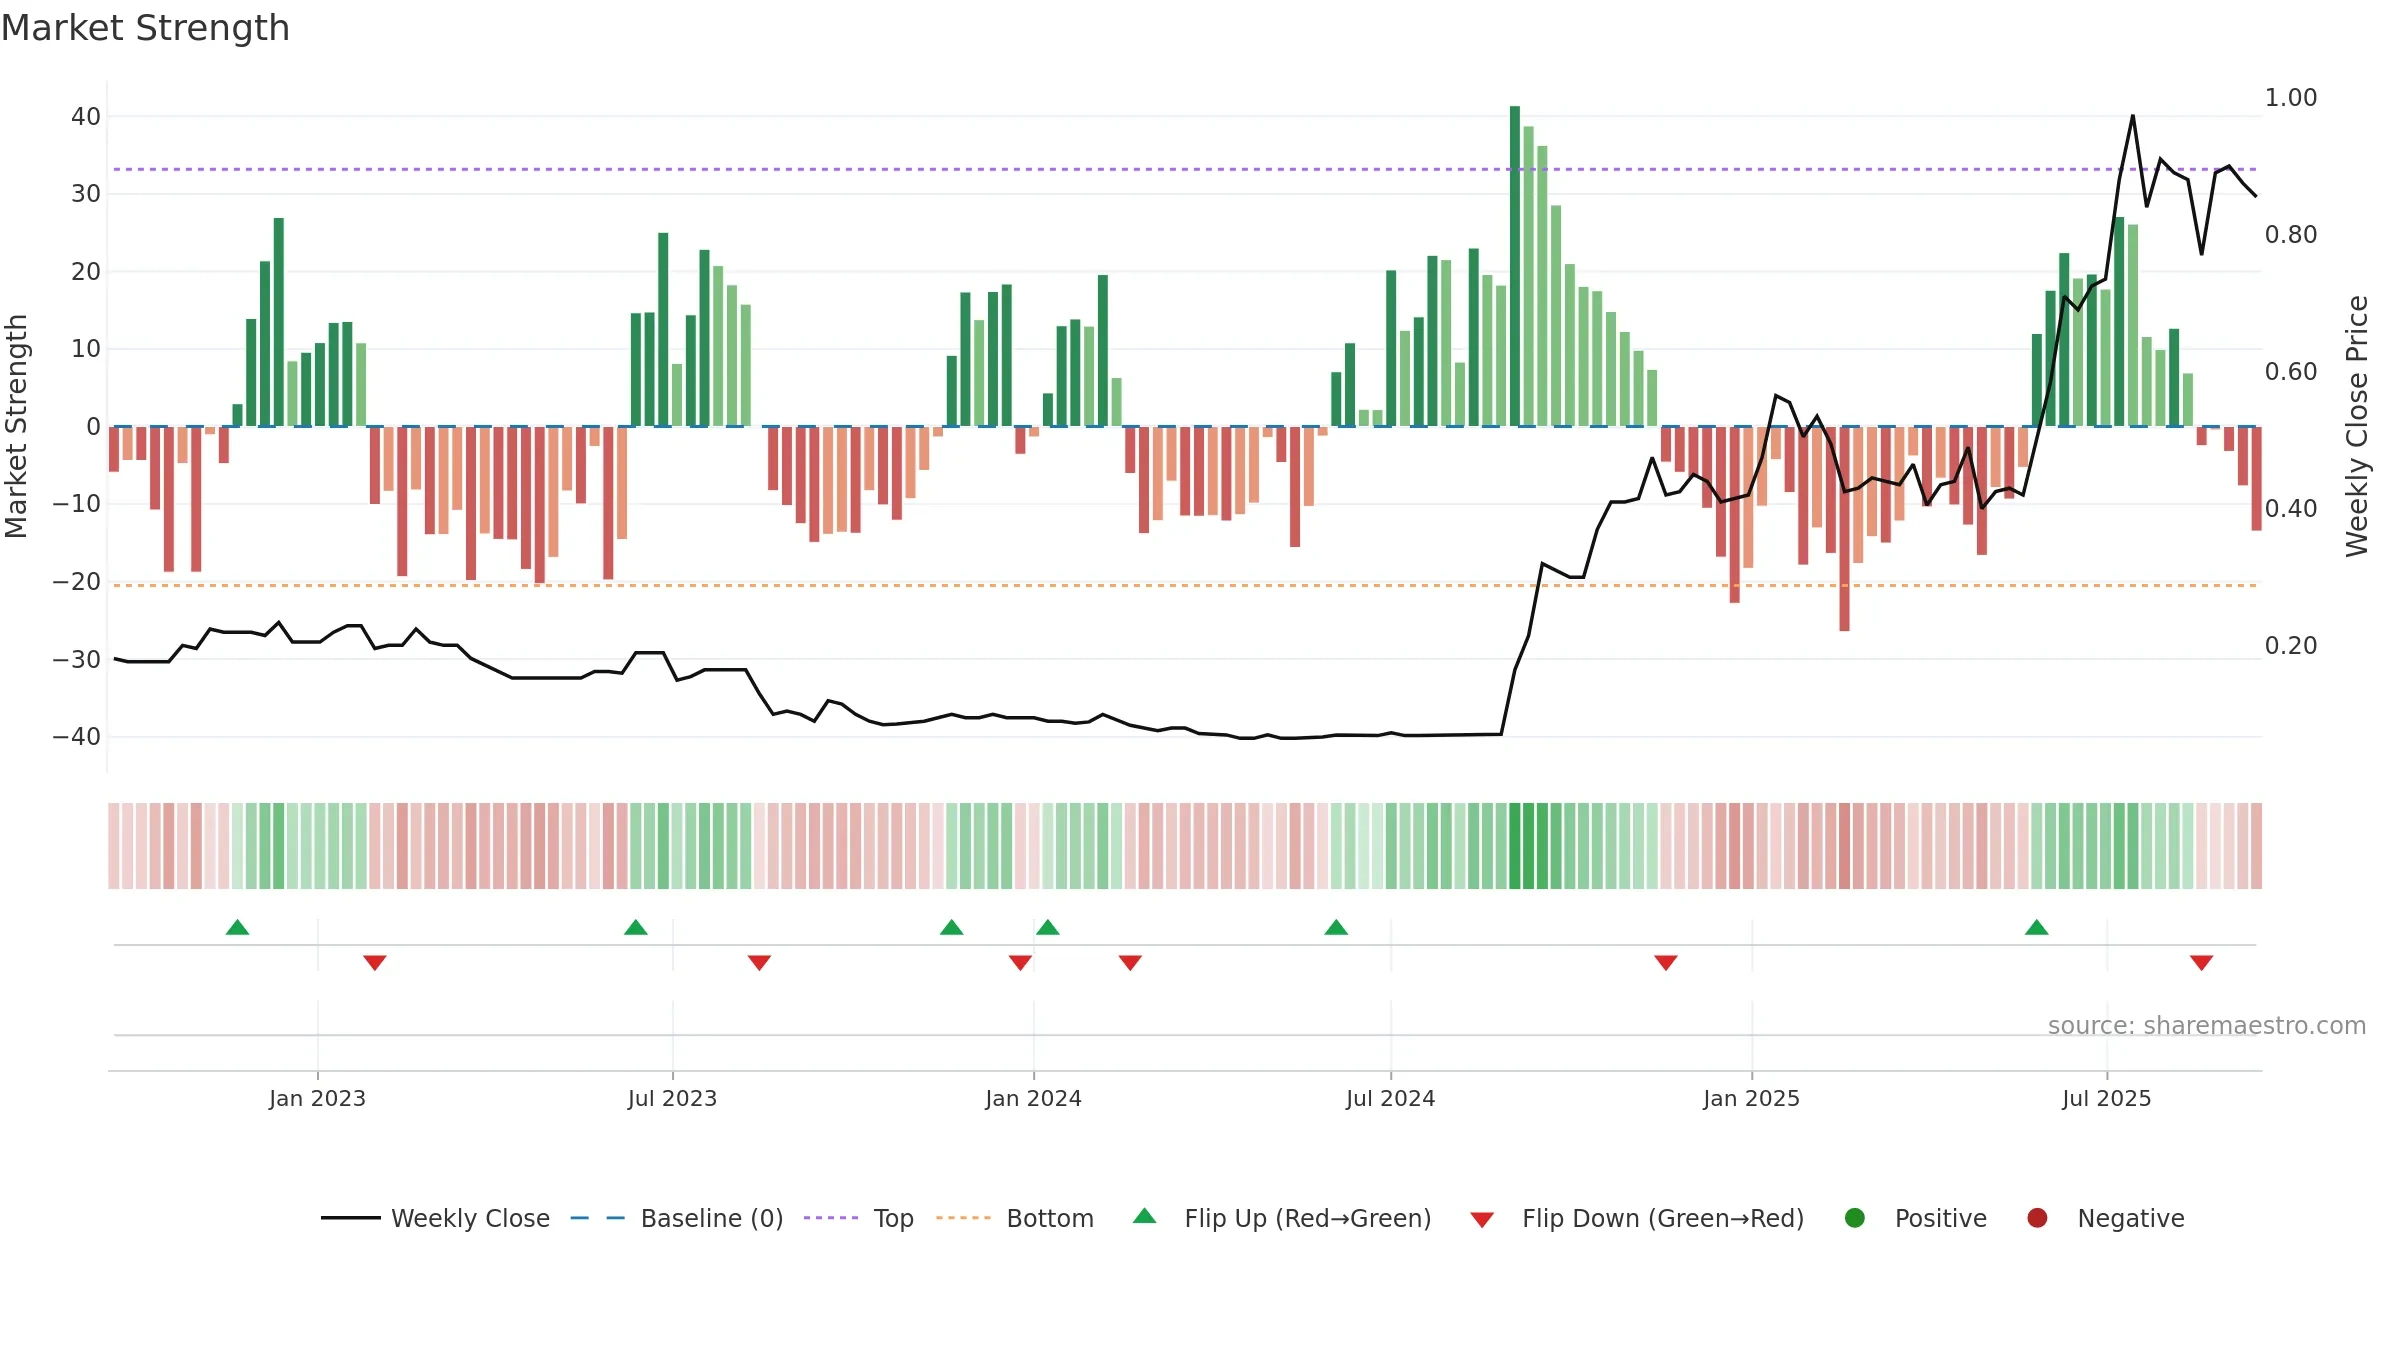
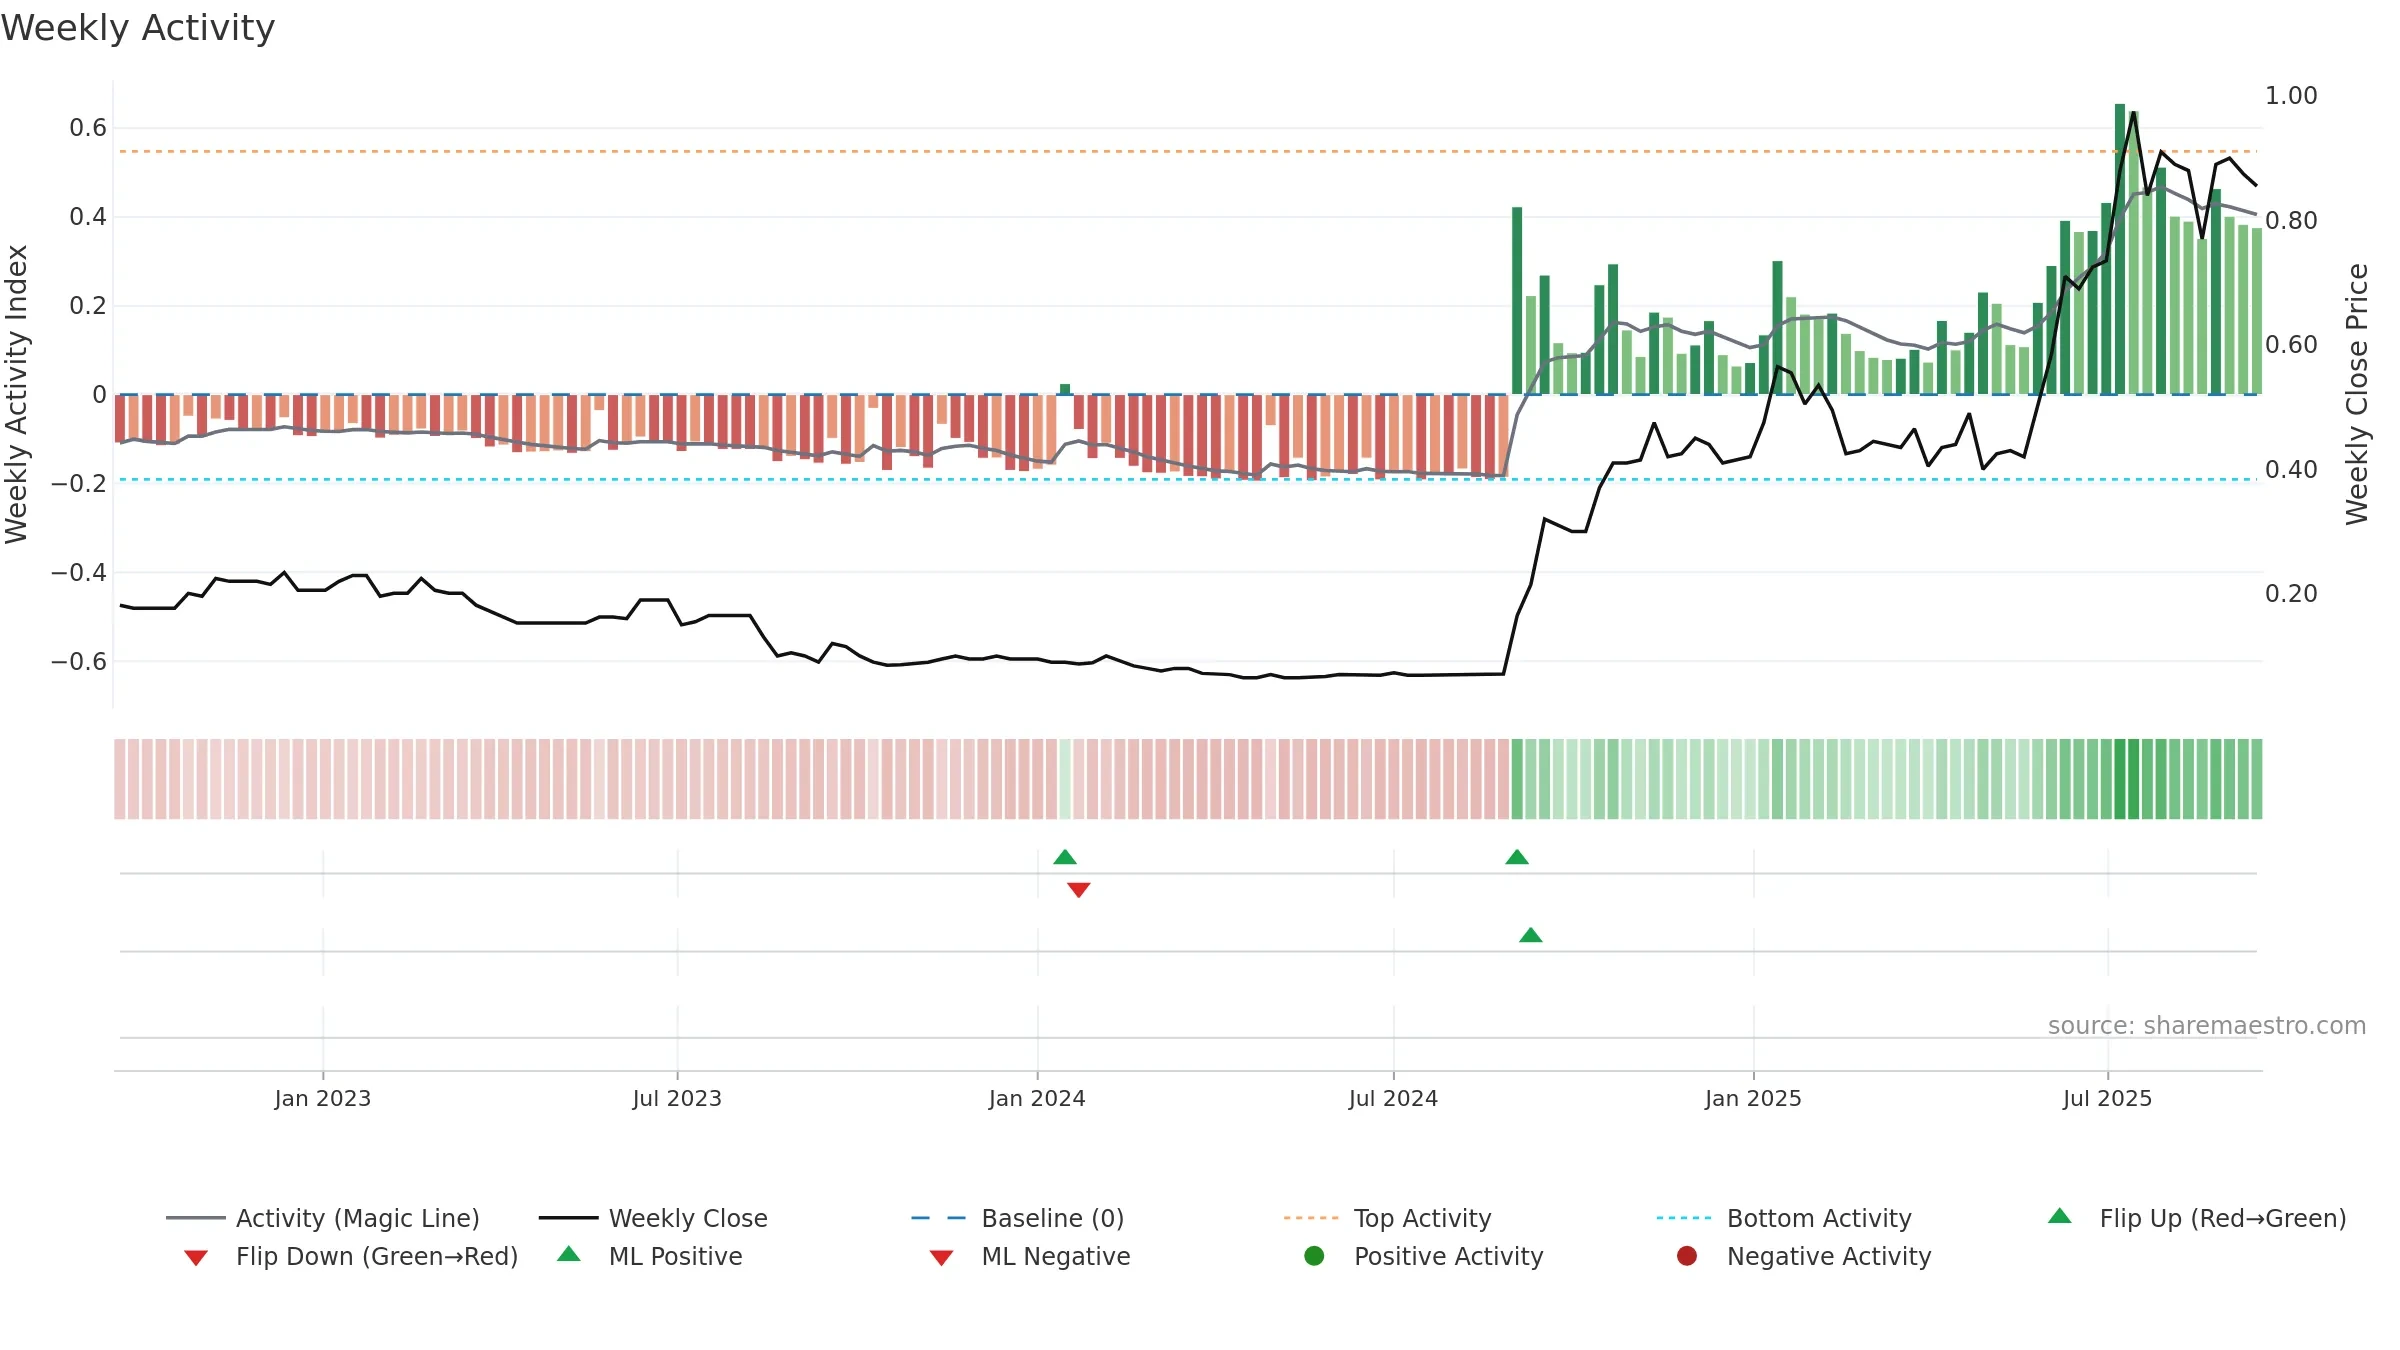
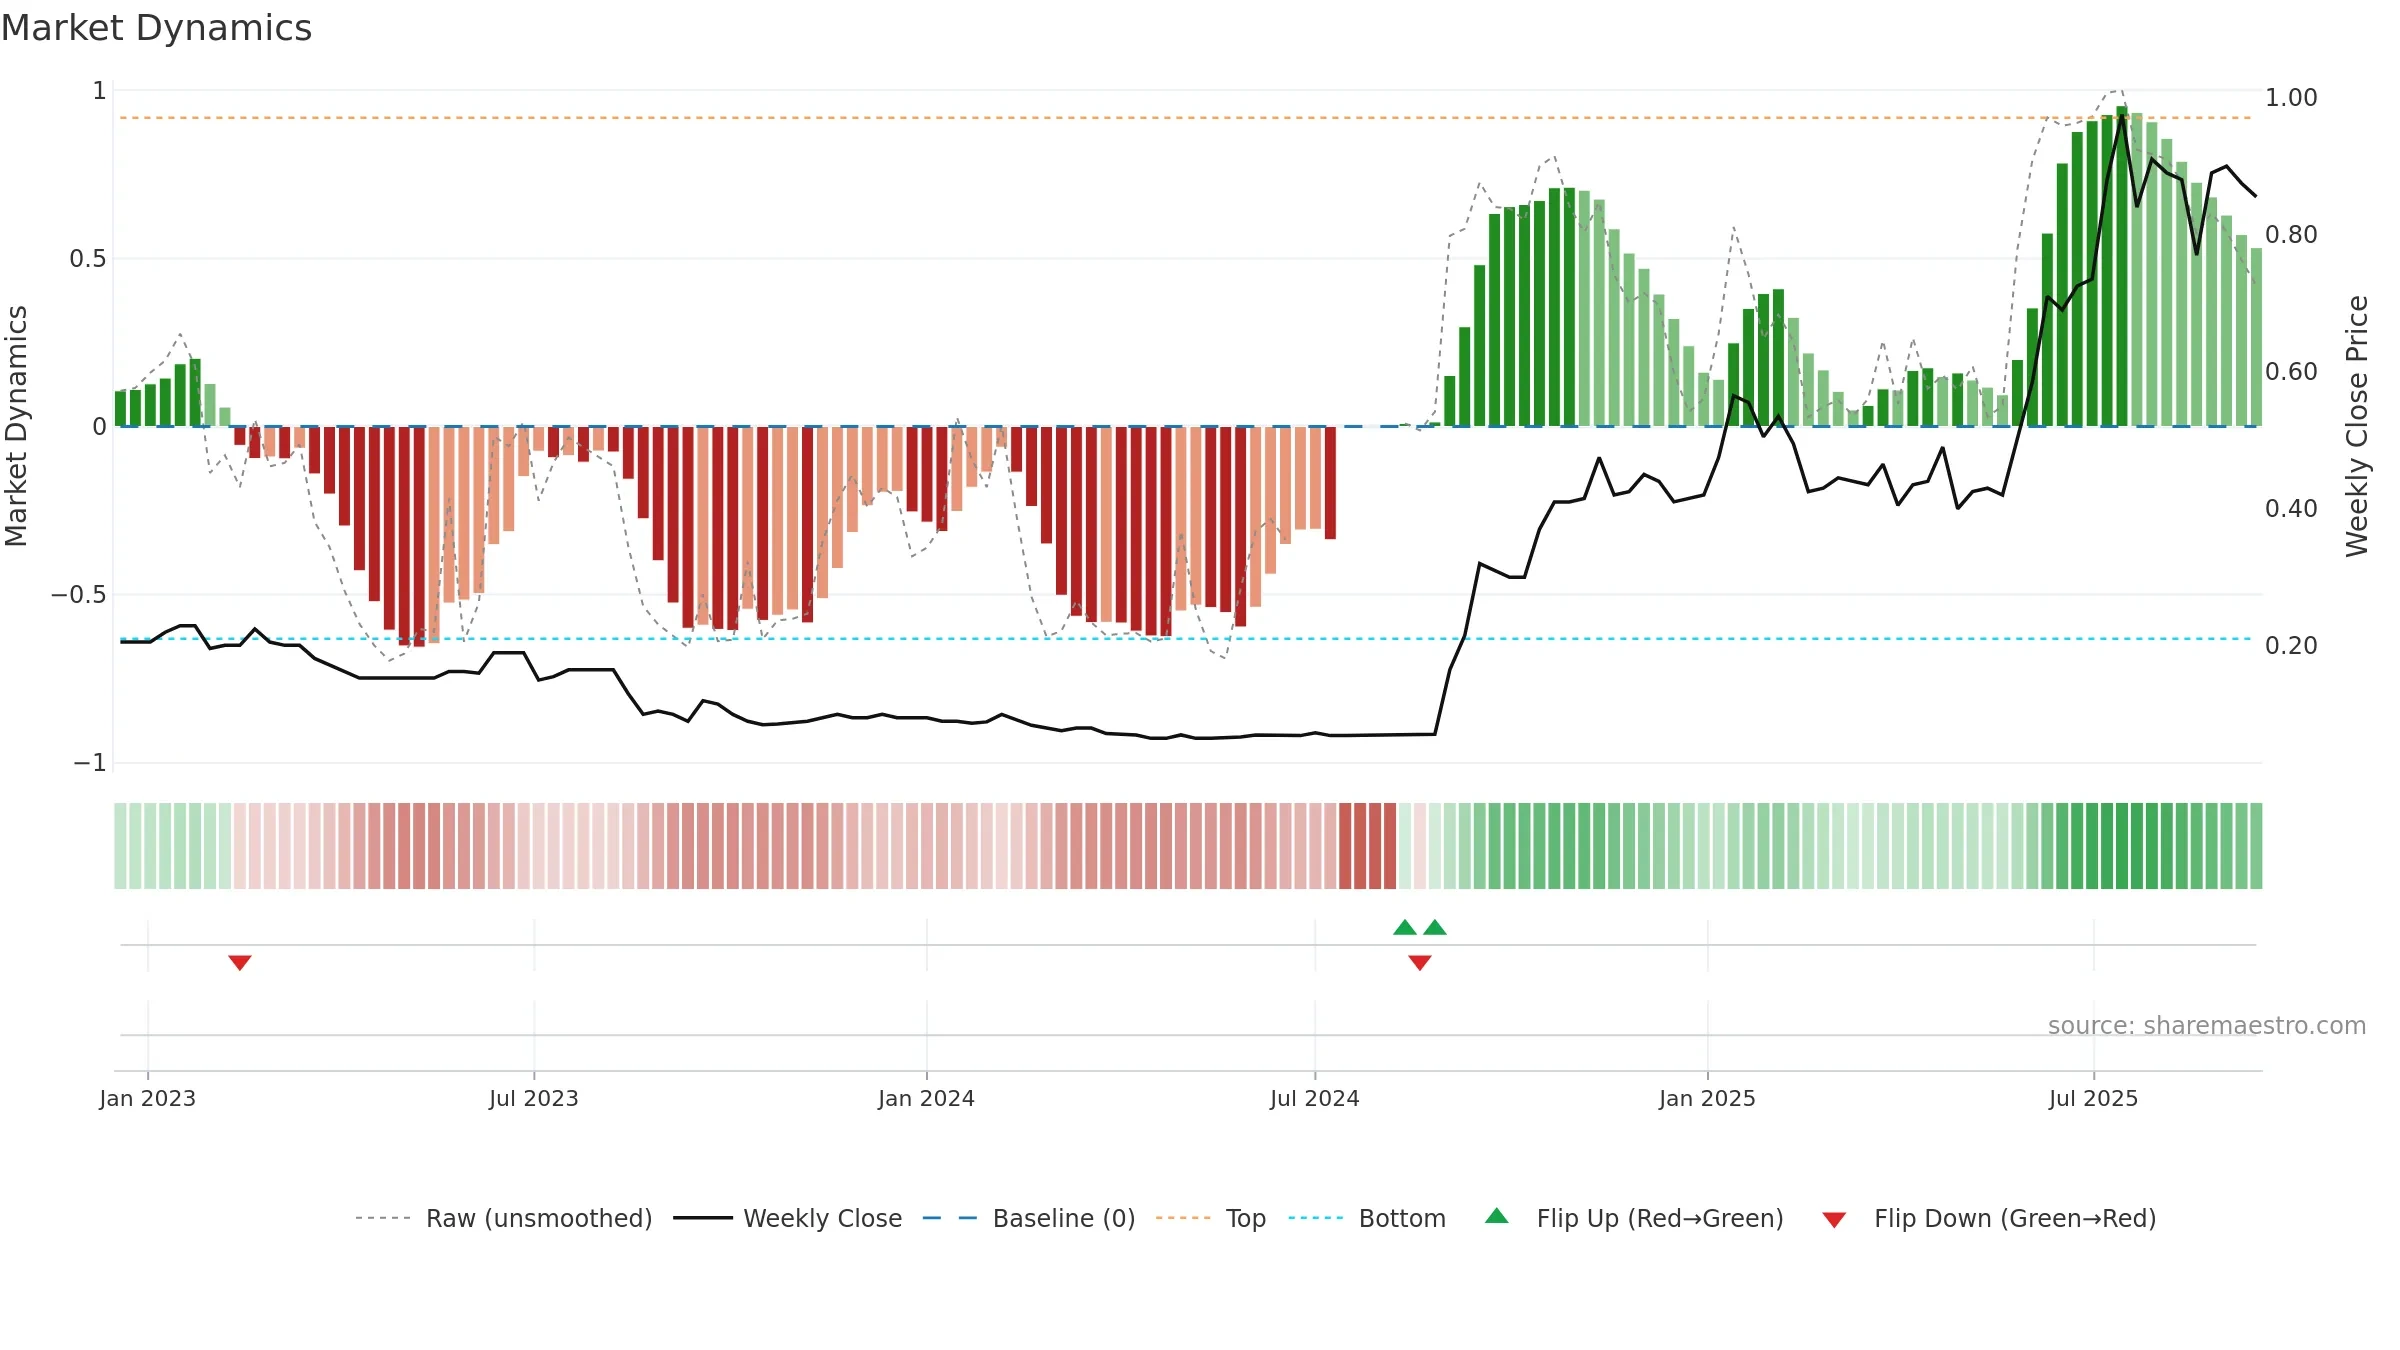
How to read this — Price slope is downward, indicating persistent supply pressure. Volume and price are moving in the same direction — a constructive confirmation. Returns are positively correlated with volume — strength tends to arrive on higher activity. Distance to baseline is narrowing — reverting closer to its fair-value track. Constructive MA stack supports the up-drift; pullbacks may find support at the 8–13 week region. Fresh short-term crossover improves near-term tone.
Down-slope argues for patience; rallies can fade sooner unless participation improves.
Gauge maps the trend signal to a 0–100 scale.
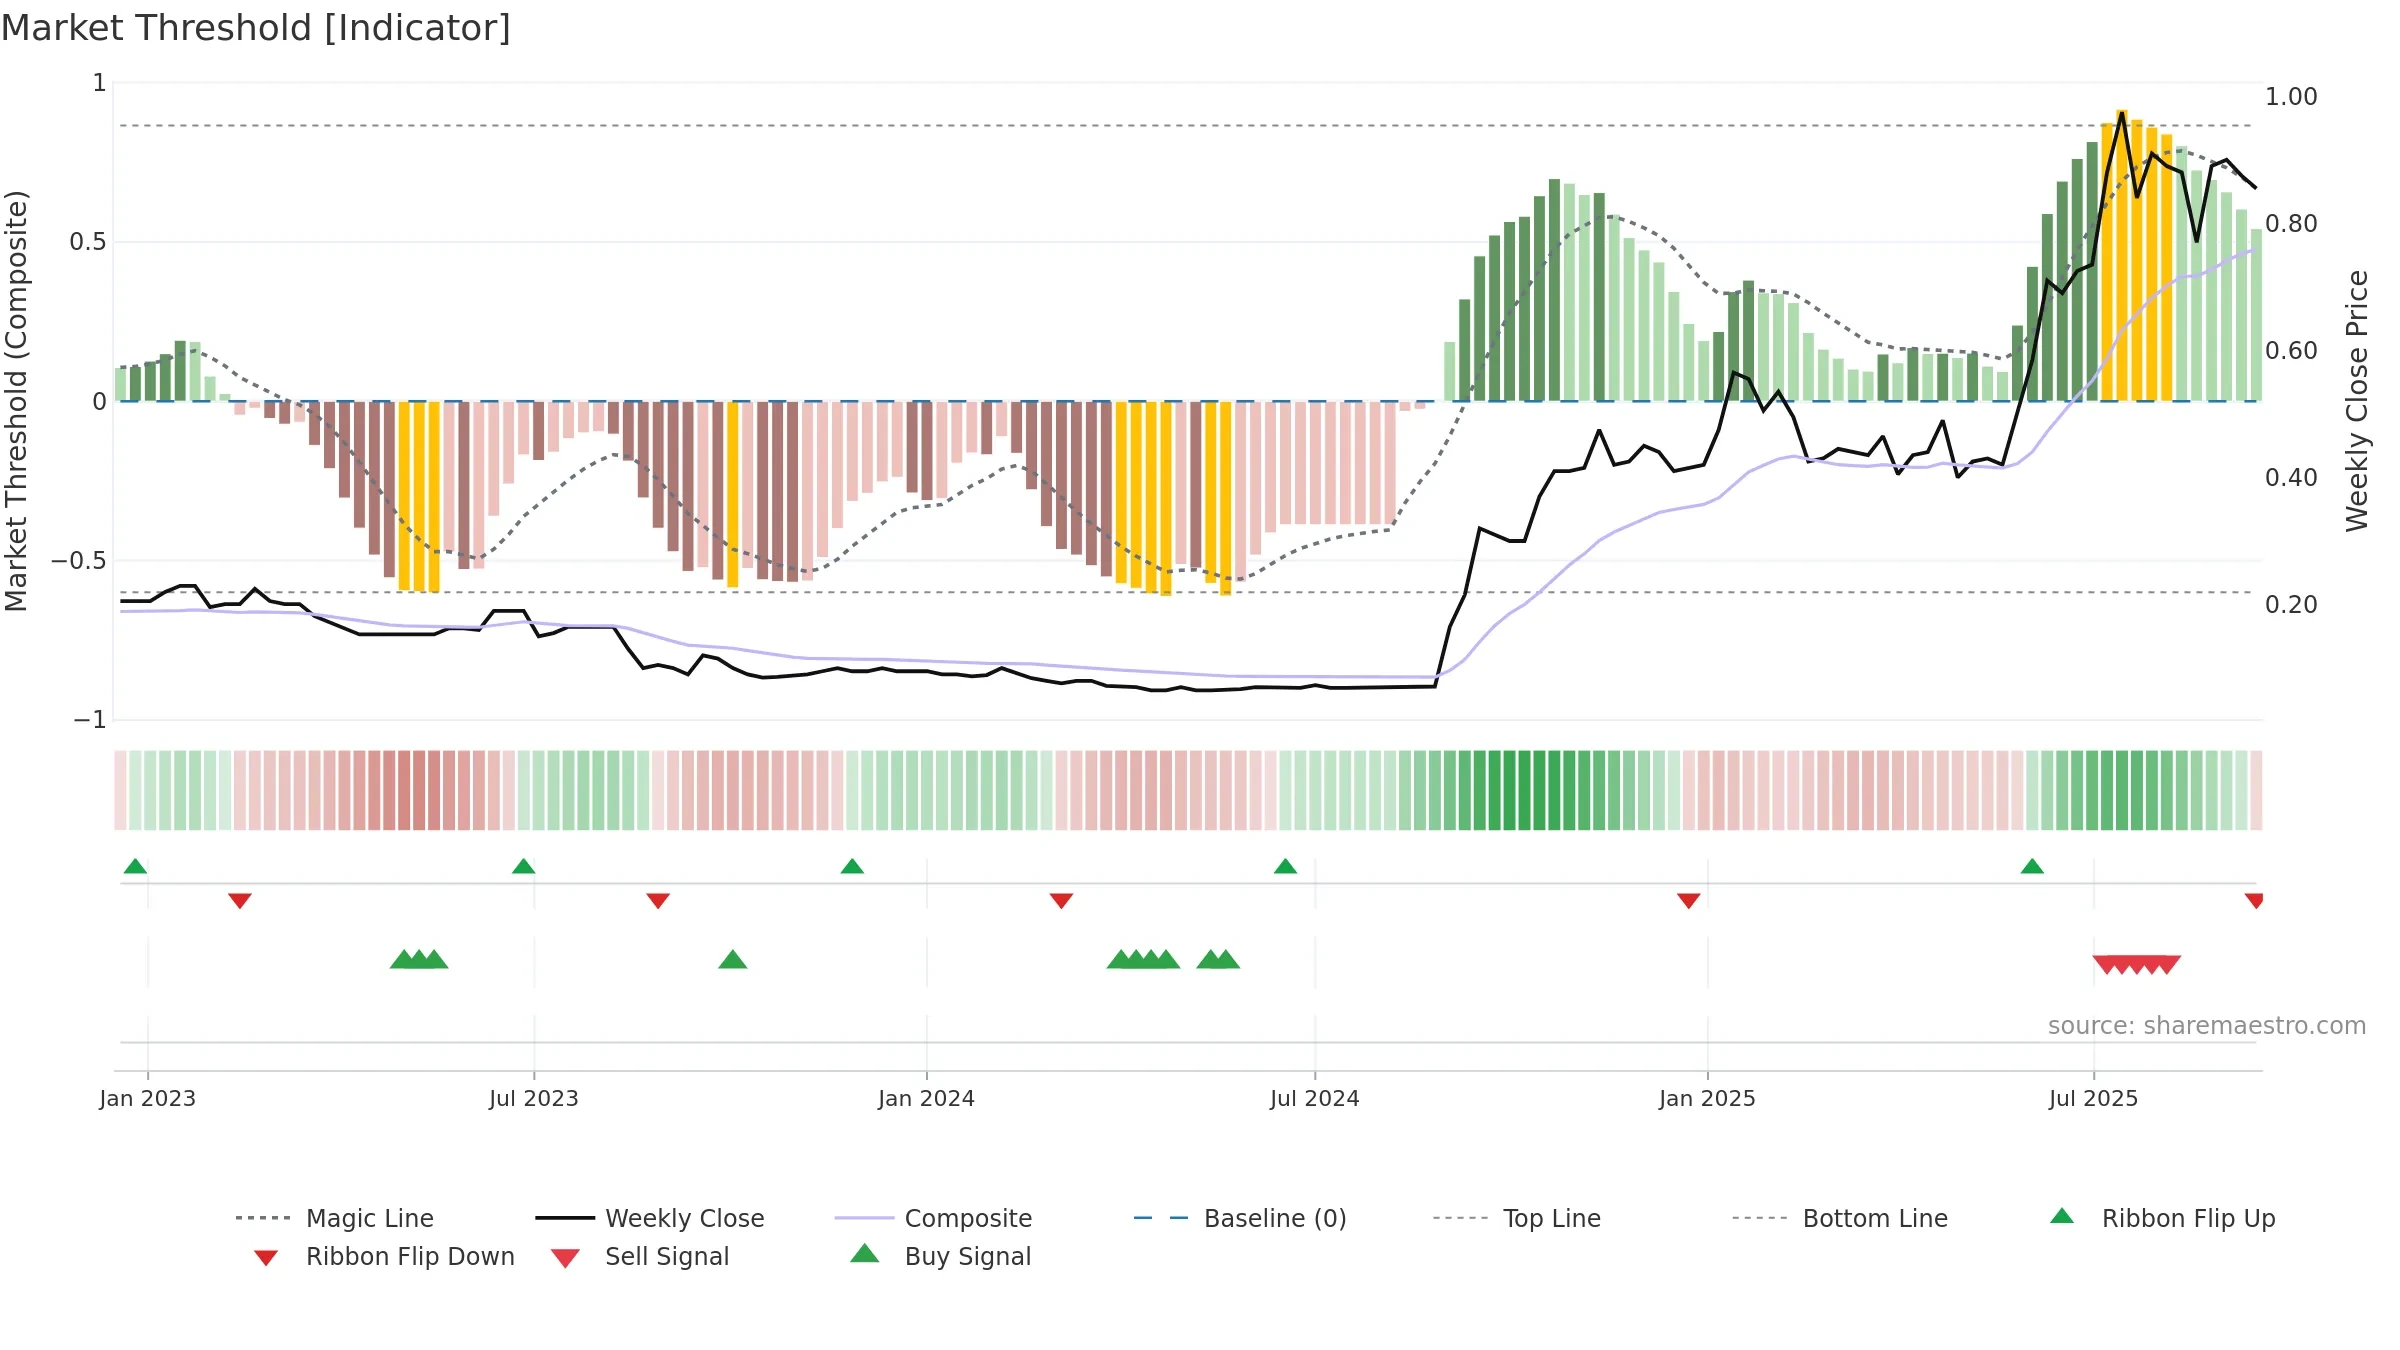
How to read this — Gauge is elevated but momentum is rolling over; topping risk is rising. Notable breakdown from ≥0.80 weakens trend quality.
Stay alert: protect gains or seek confirmation before adding risk.
Conclusion
Neutral setup. ★★★☆☆ confidence. Price window: -6. Trend: Uptrend at Risk; gauge 73. In combination, liquidity confirms the move.
- Momentum is bullish and rising
- Constructive moving-average stack
- Liquidity confirms the price trend
- High-level but rolling over (topping risk)
- Price is not above key averages
- Negative multi-week performance
- Recent breakdown from ≥0.80 weakens trend quality
Why: Price window -6.04% over 8w. Close is -6.04% below the prior-window high. Volume trend falling. Liquidity convergence with price. Trend state uptrend at risk. MA stack constructive. 4–8w crossover bullish. Baseline deviation 2.13% (narrowing). Momentum bullish and rising.
Tip: Most metrics include a hover tooltip where they appear in the report.