&Do Holdings Co.,Ltd.
3457 TYO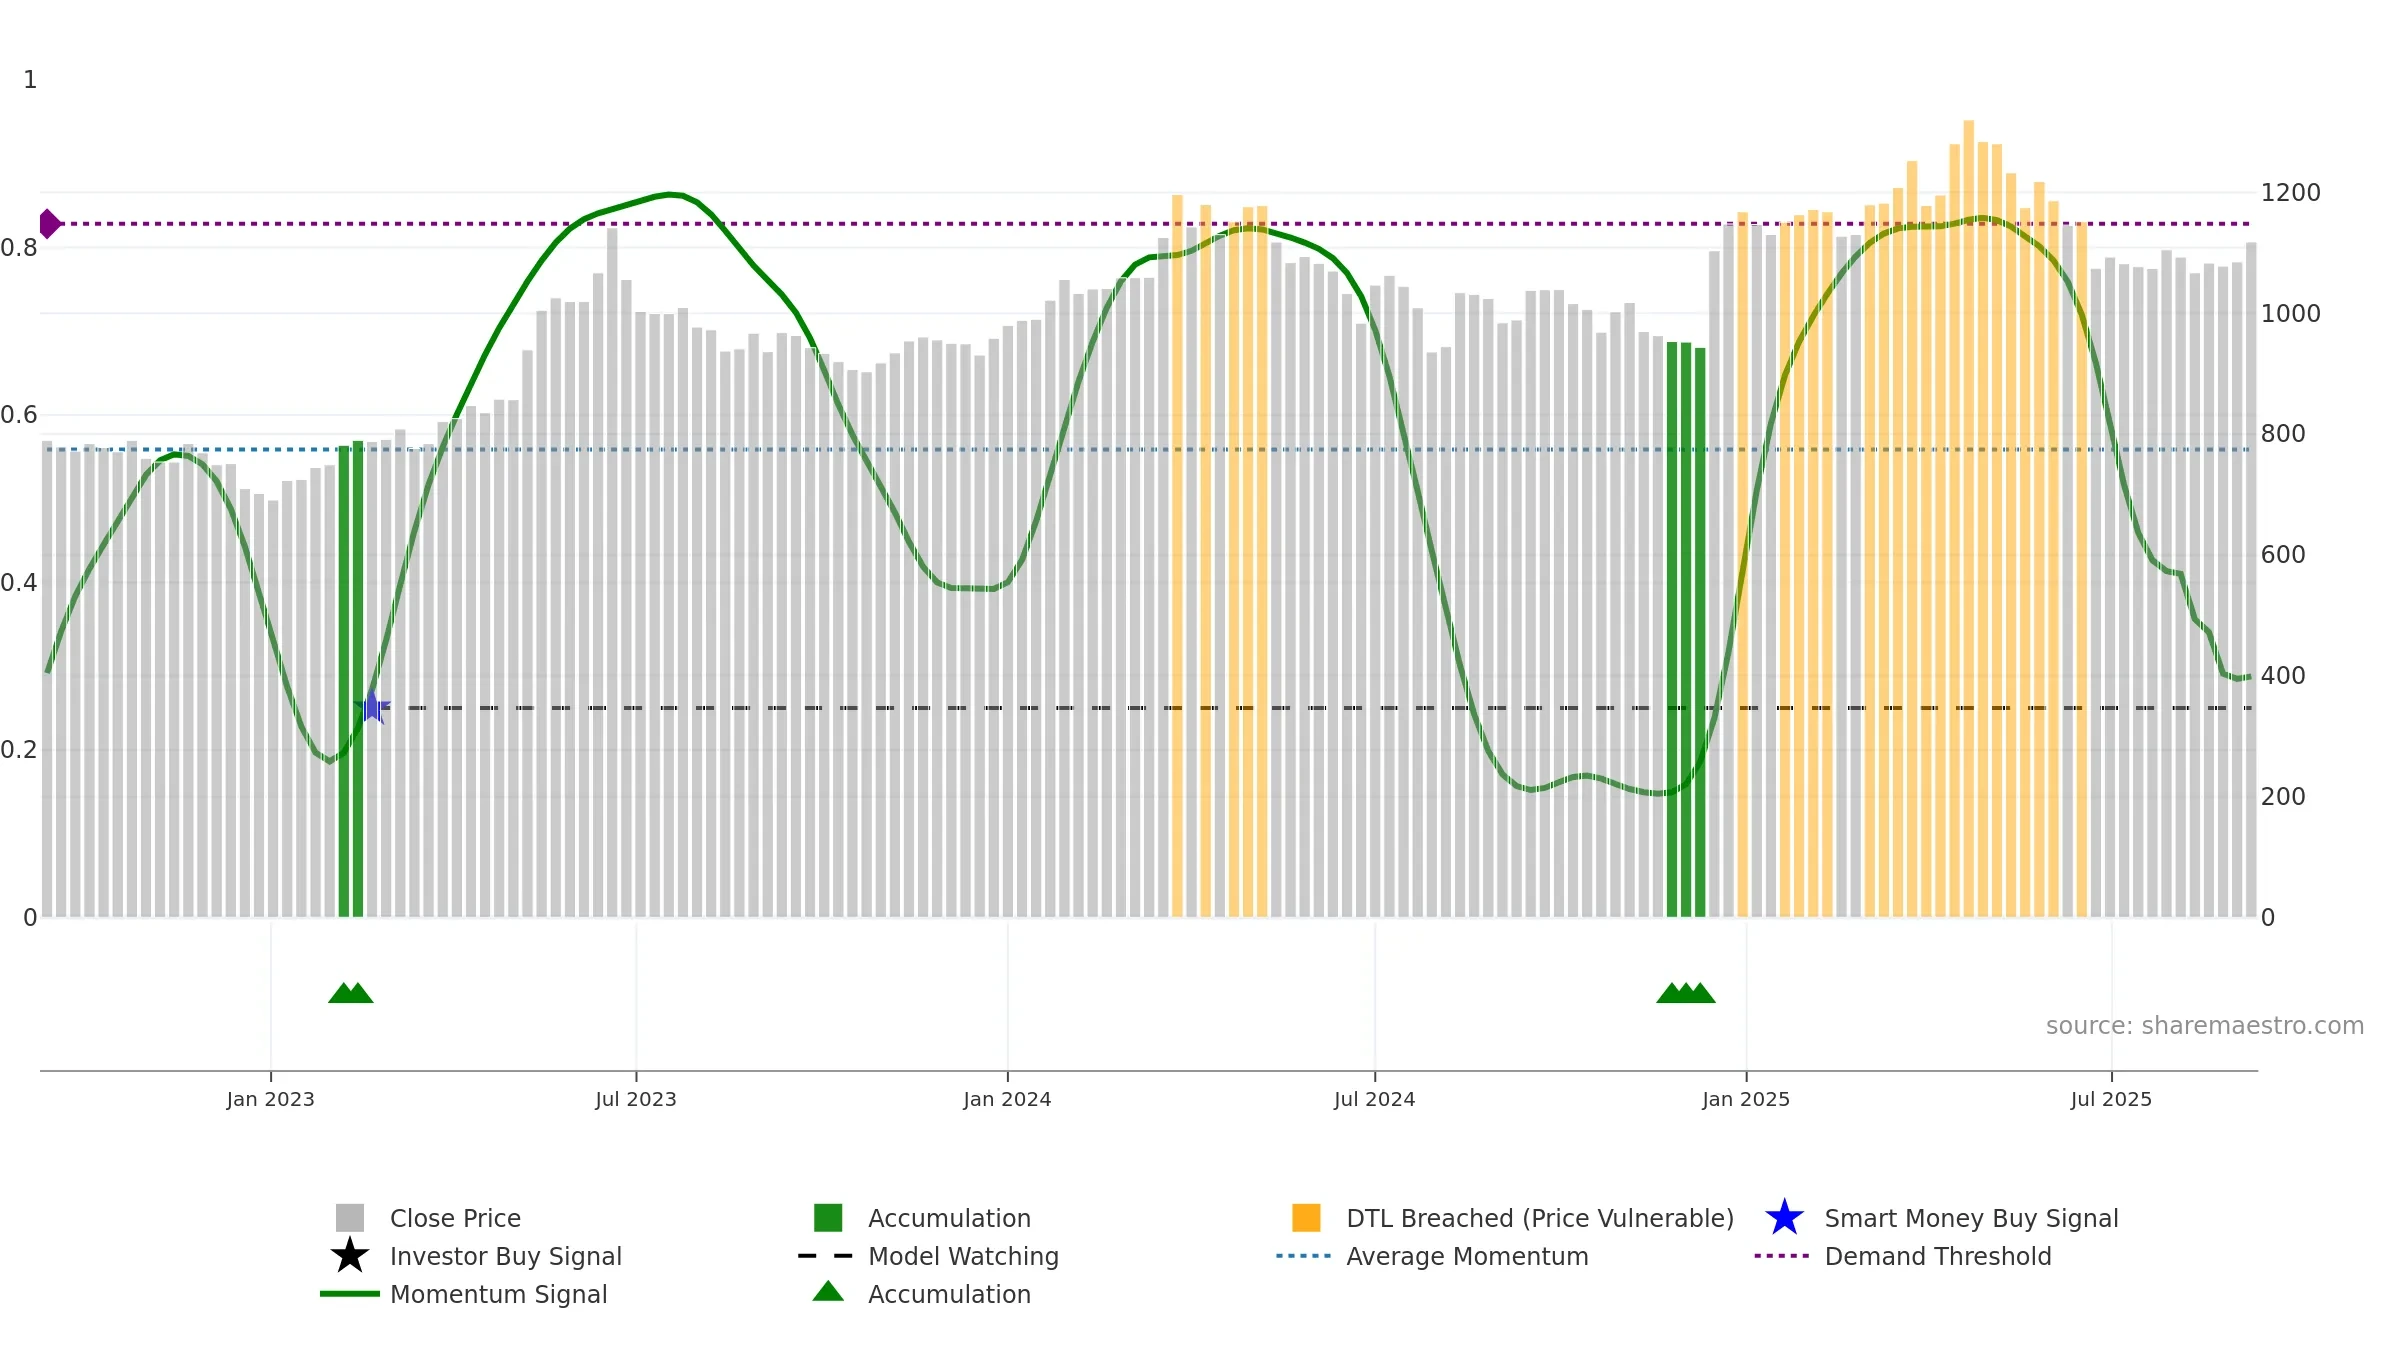
Weekly Report
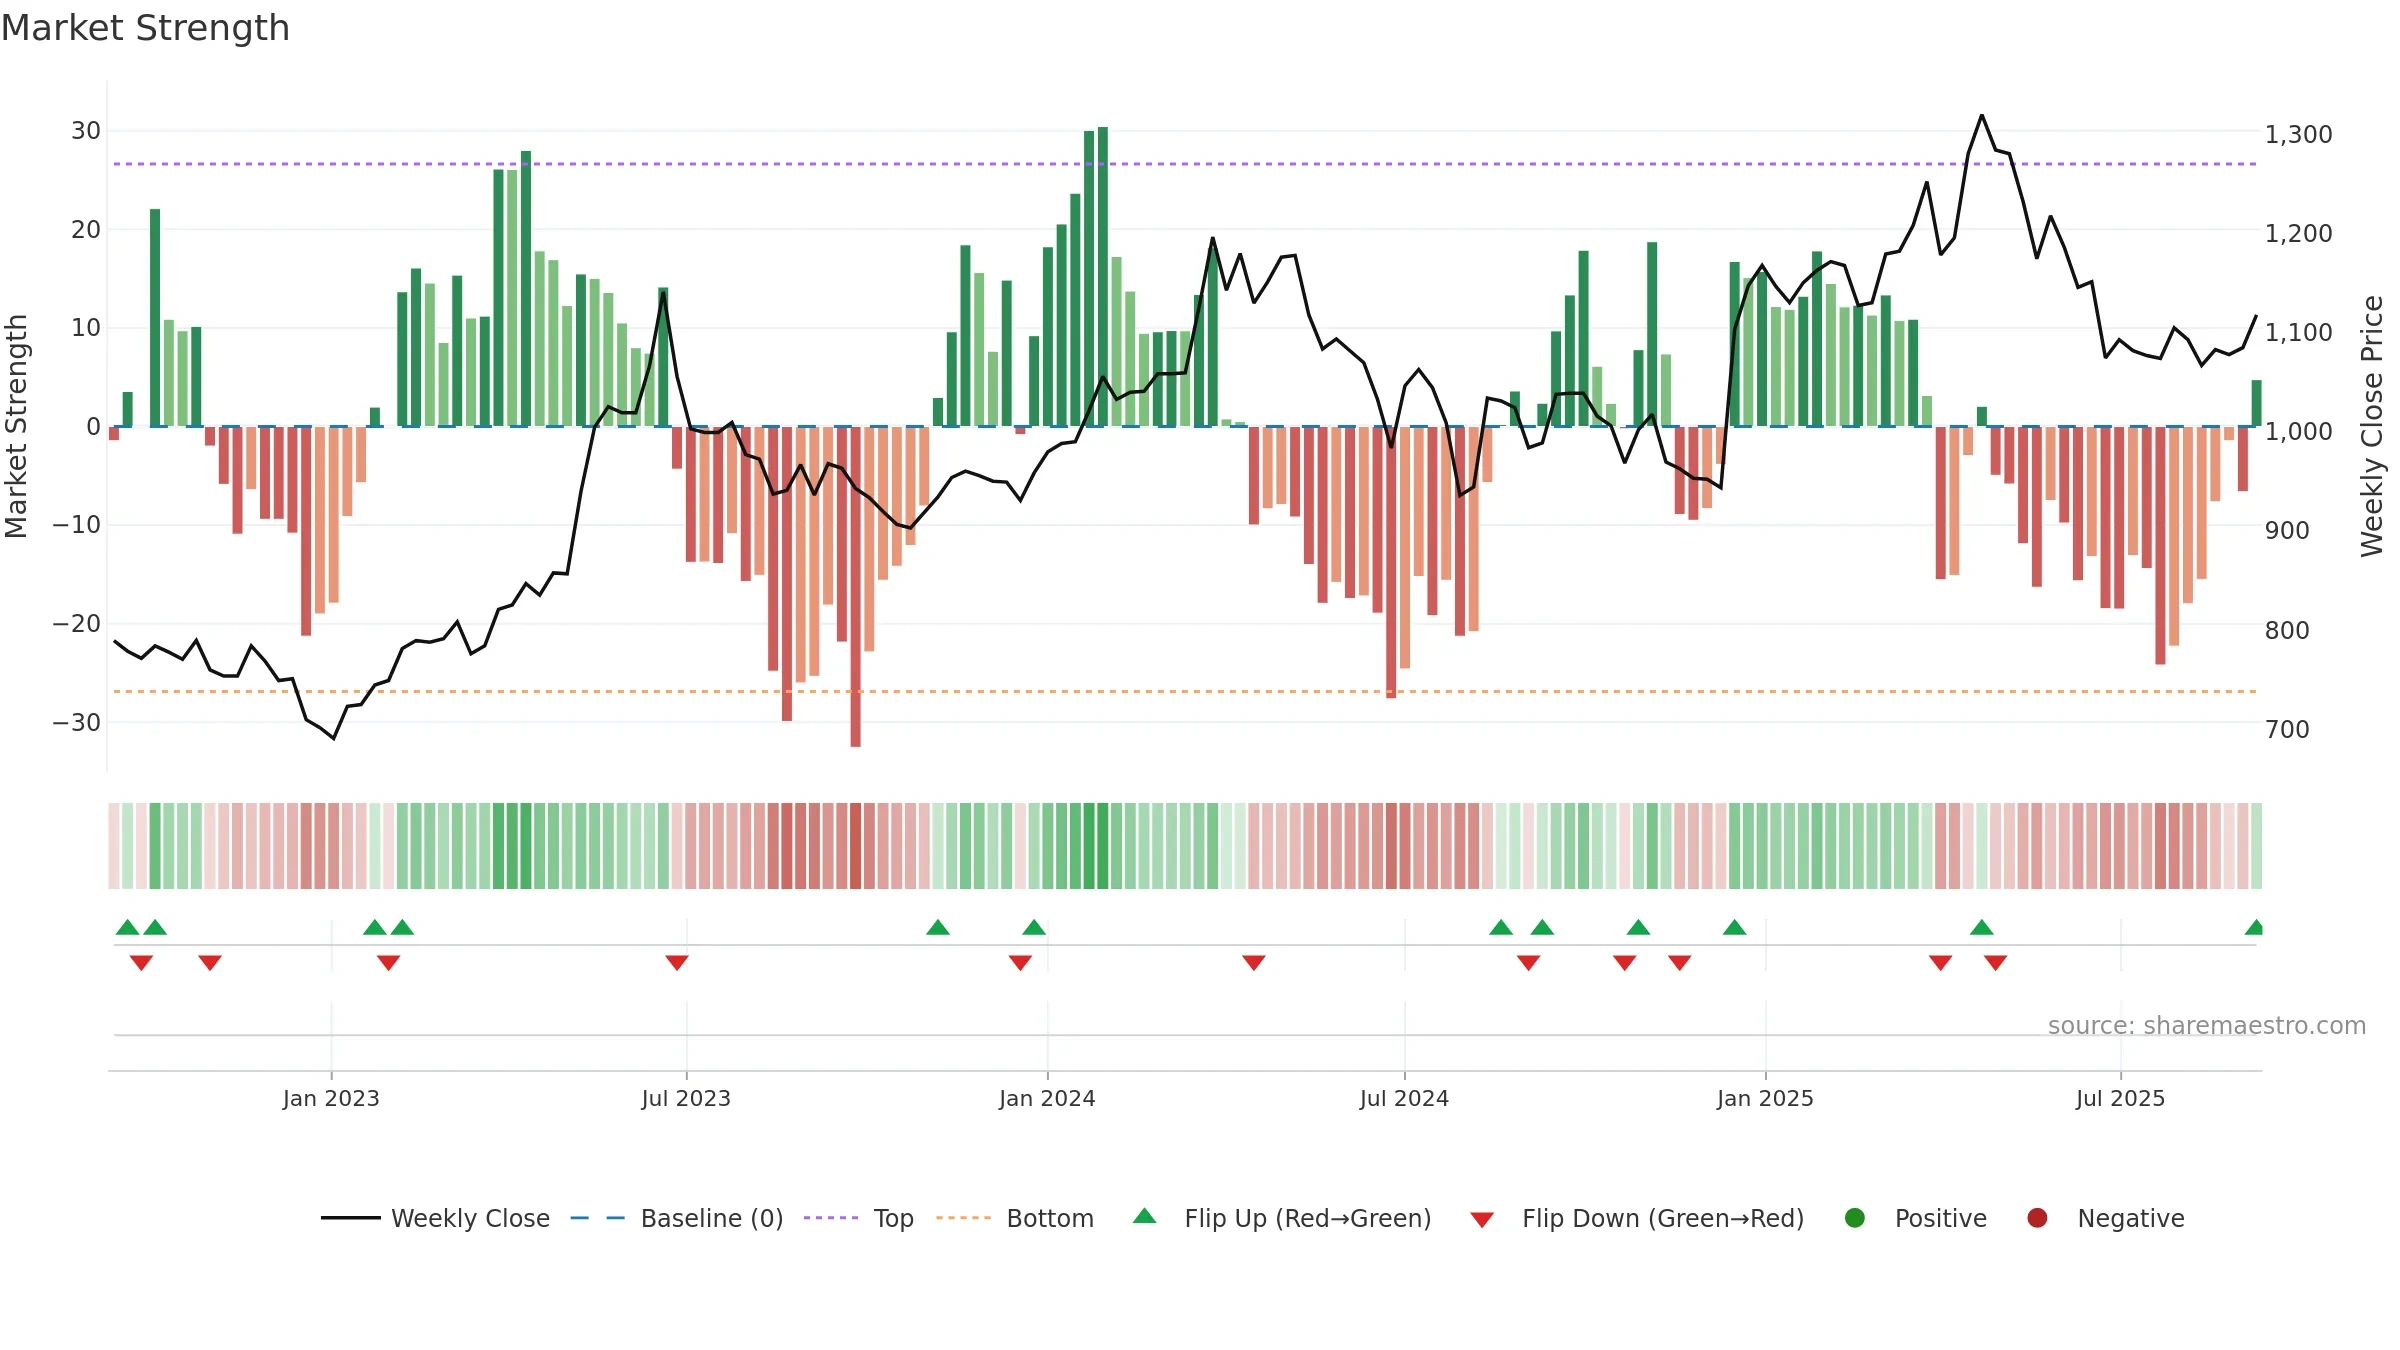
&Do Holdings Co.,Ltd. closed at 1118.0000 (0.36% WoW) . Data window ends Mon, 08 Sep 2025.
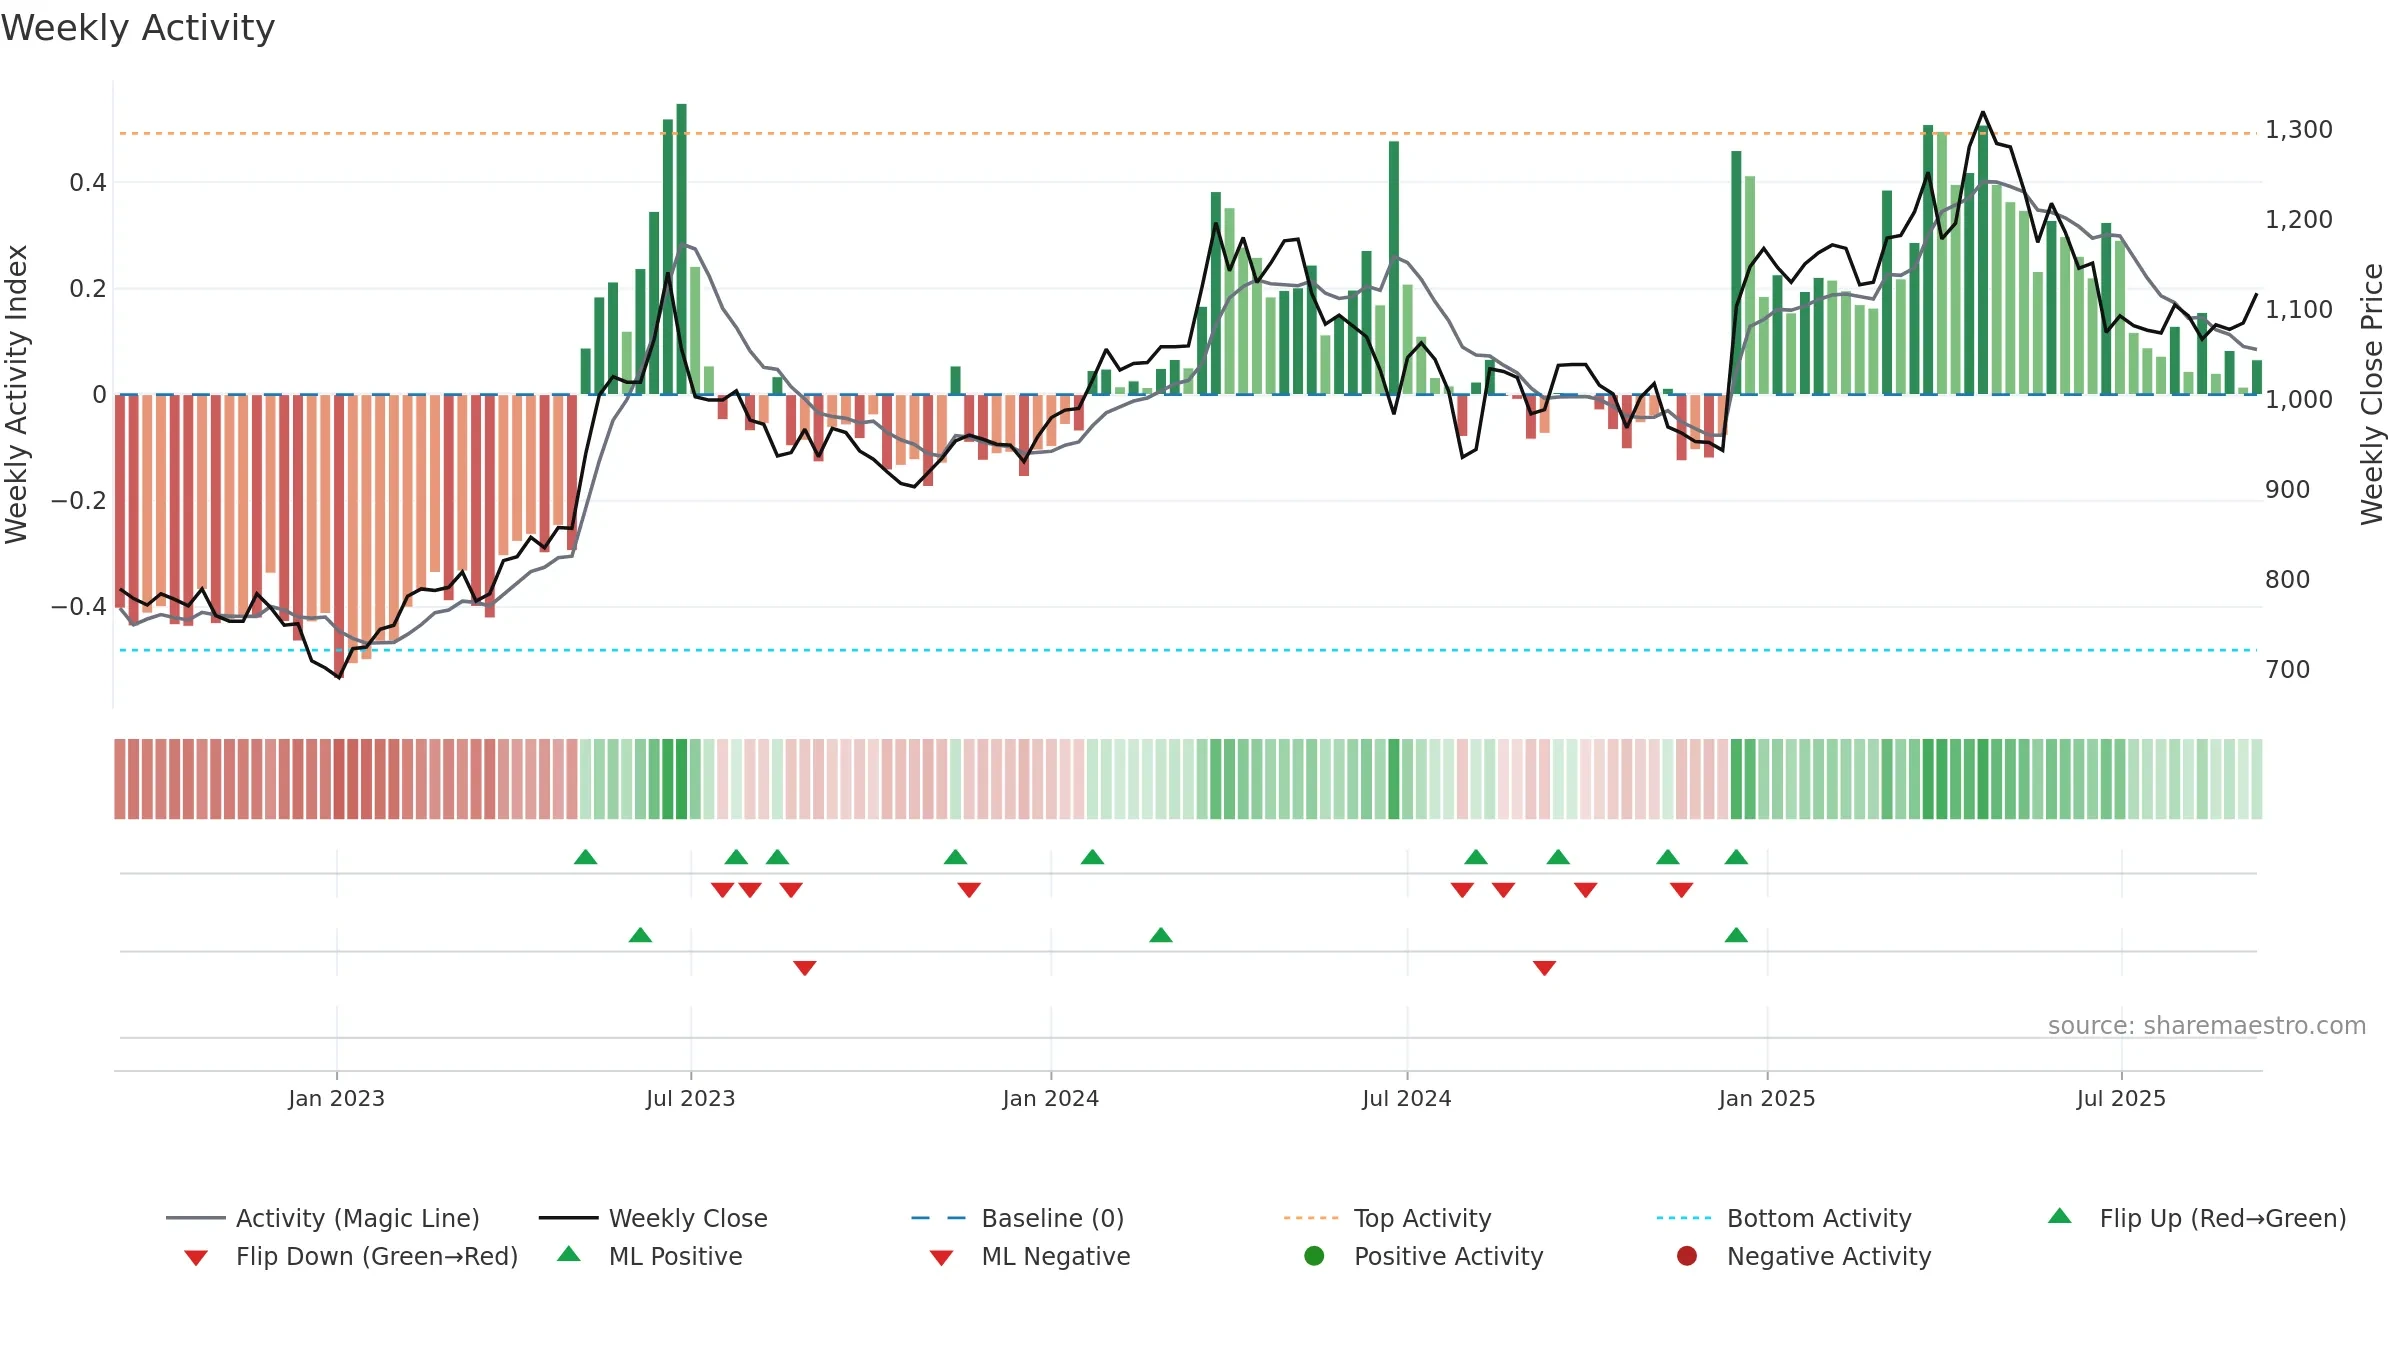
How to read this — Price slope is upward, indicating persistent buying over the window. Volume trend diverges from price — watch for fatigue or rotation. Returns are negatively correlated with volume — strength may come on lighter activity. Distance to baseline is narrowing — reverting closer to its fair-value track. Fresh short-term crossover improves near-term tone.
Up-slope supports buying interest; pullbacks may be contained if activity stays firm. Because liquidity isn’t confirming, prefer evidence of fresh demand before chasing moves.
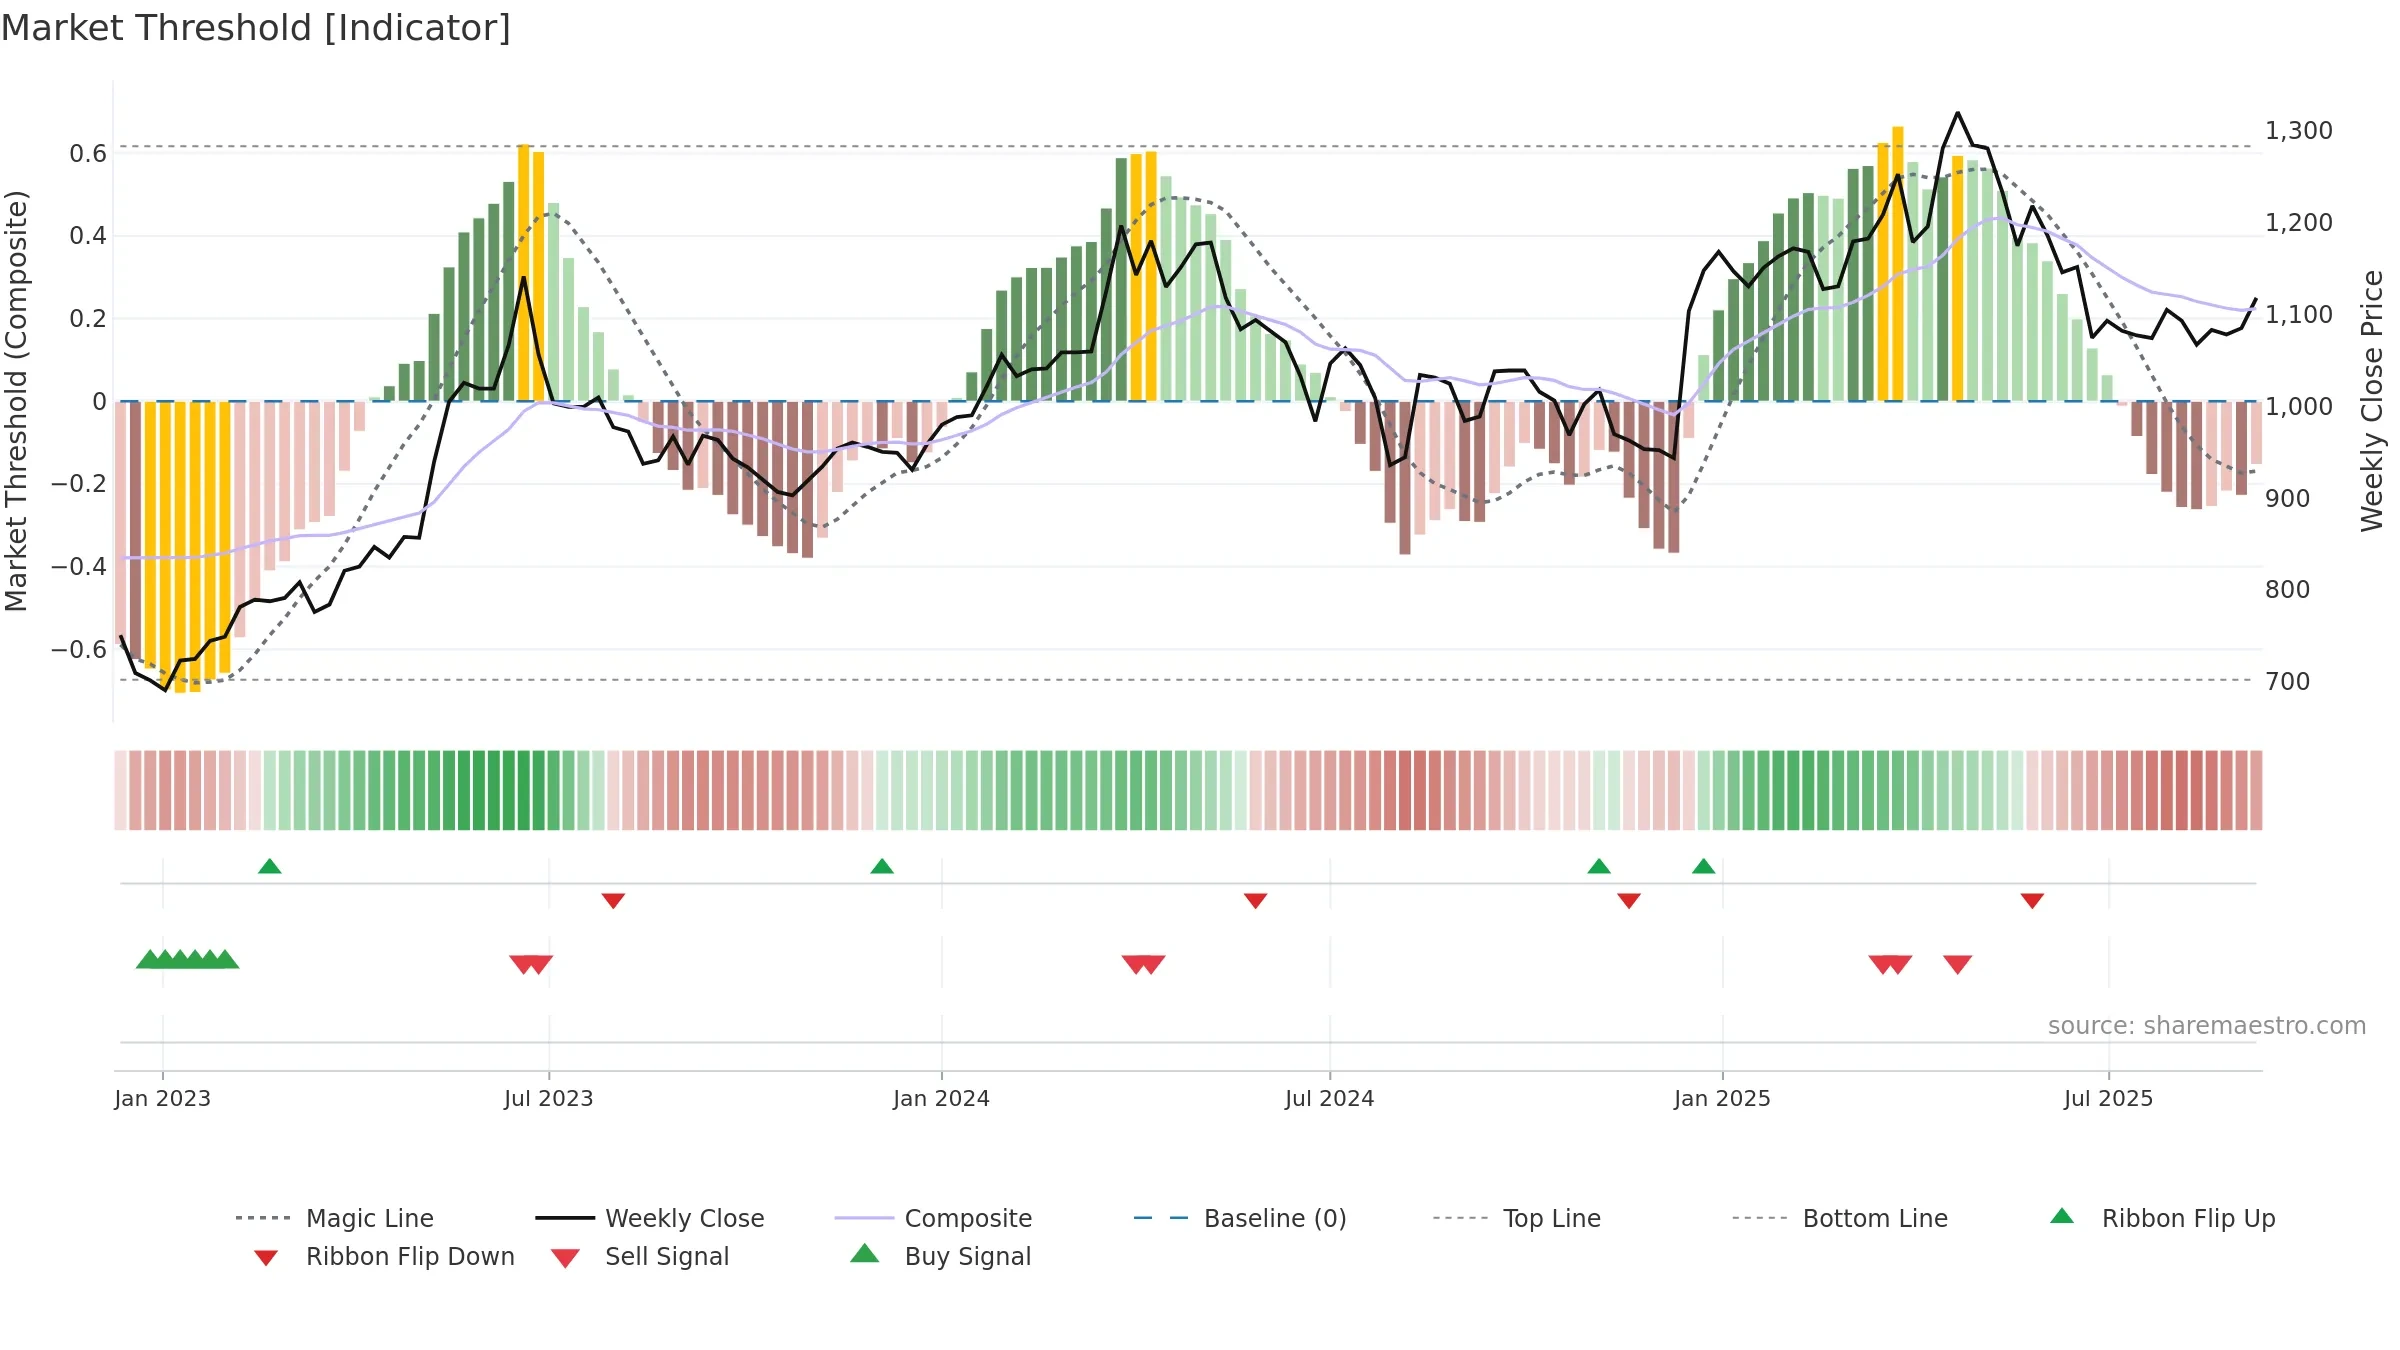
Gauge maps the trend signal to a 0–100 scale.
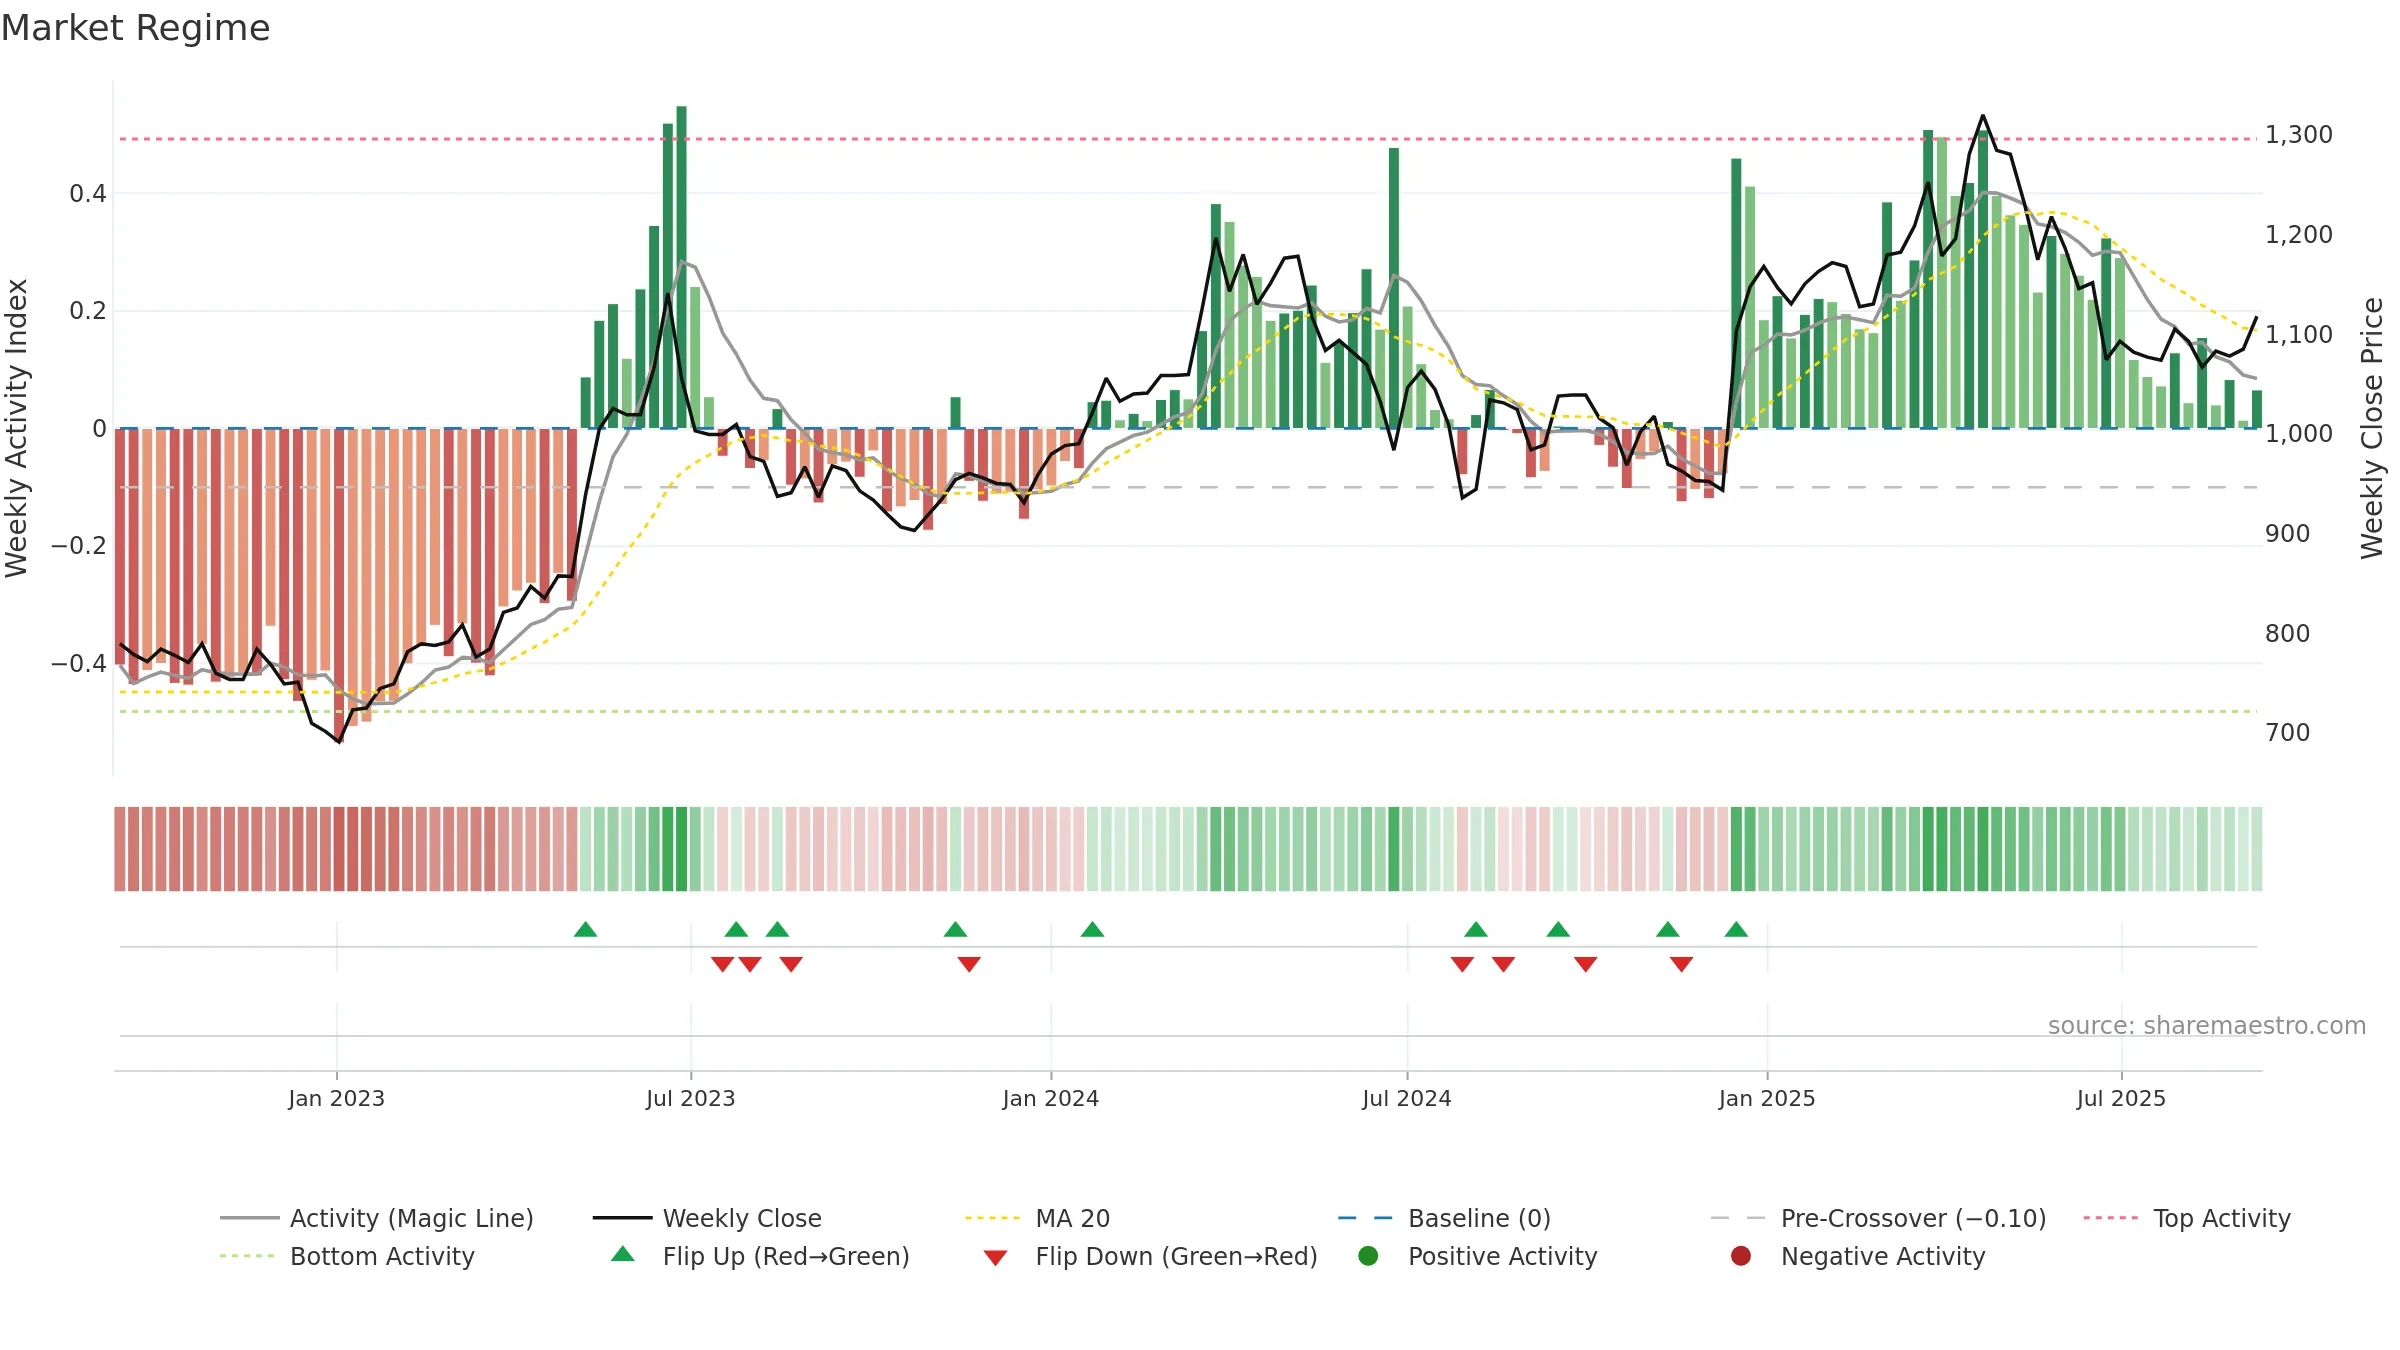
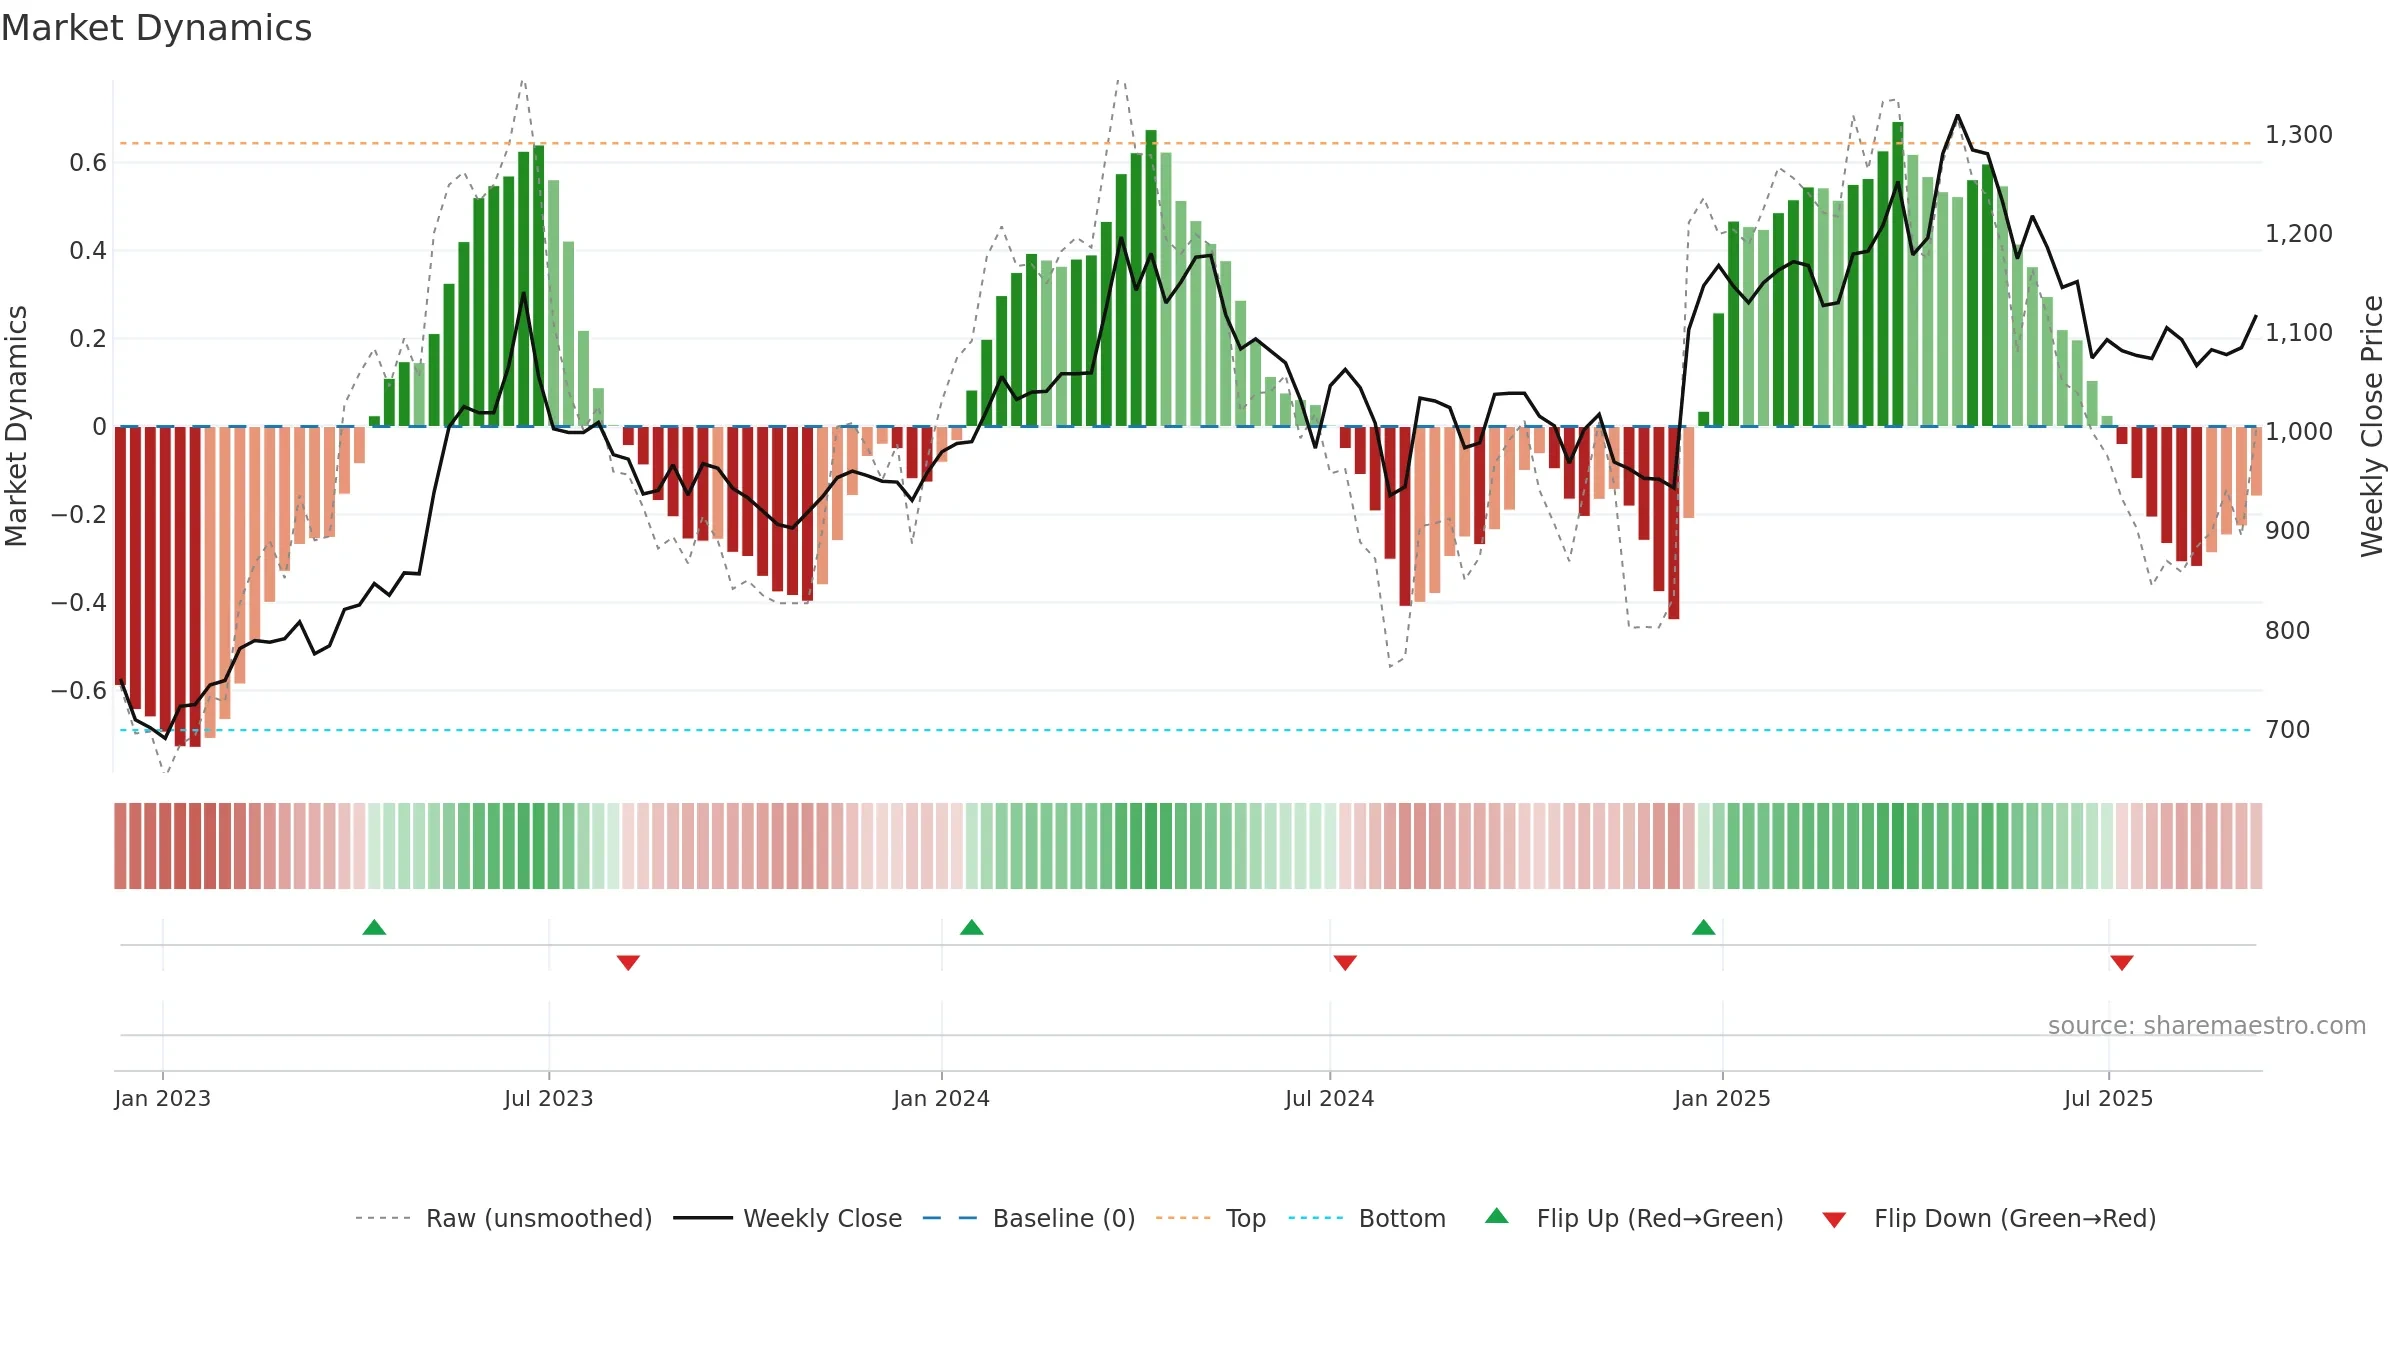
How to read this — Bearish zone with falling momentum — sellers in control.
Bias remains lower; rallies are suspect unless gauge reclaims 0.50/0.60.
Price is above fair value; upside may be capped without catalysts.
Conclusion
Negative setup. ★★☆☆☆ confidence. Price window: 4. Trend: Downtrend Confirmed; gauge 28. In combination, liquidity diverges from price.
- Bearish control with falling momentum
- Momentum is weak/falling
- Price is not above key averages
- Liquidity diverges from price
Why: Price window 4.10% over 8w. Close is 1.18% above the prior-window high. Return volatility 2.00%. Volume trend falling. Liquidity divergence with price. Trend state downtrend confirmed. 4–8w crossover bullish. Momentum bearish and falling. Valuation limited upside without catalysts.
Tip: Most metrics include a hover tooltip where they appear in the report.