FastPartner AB (publ)
FPAR-A STO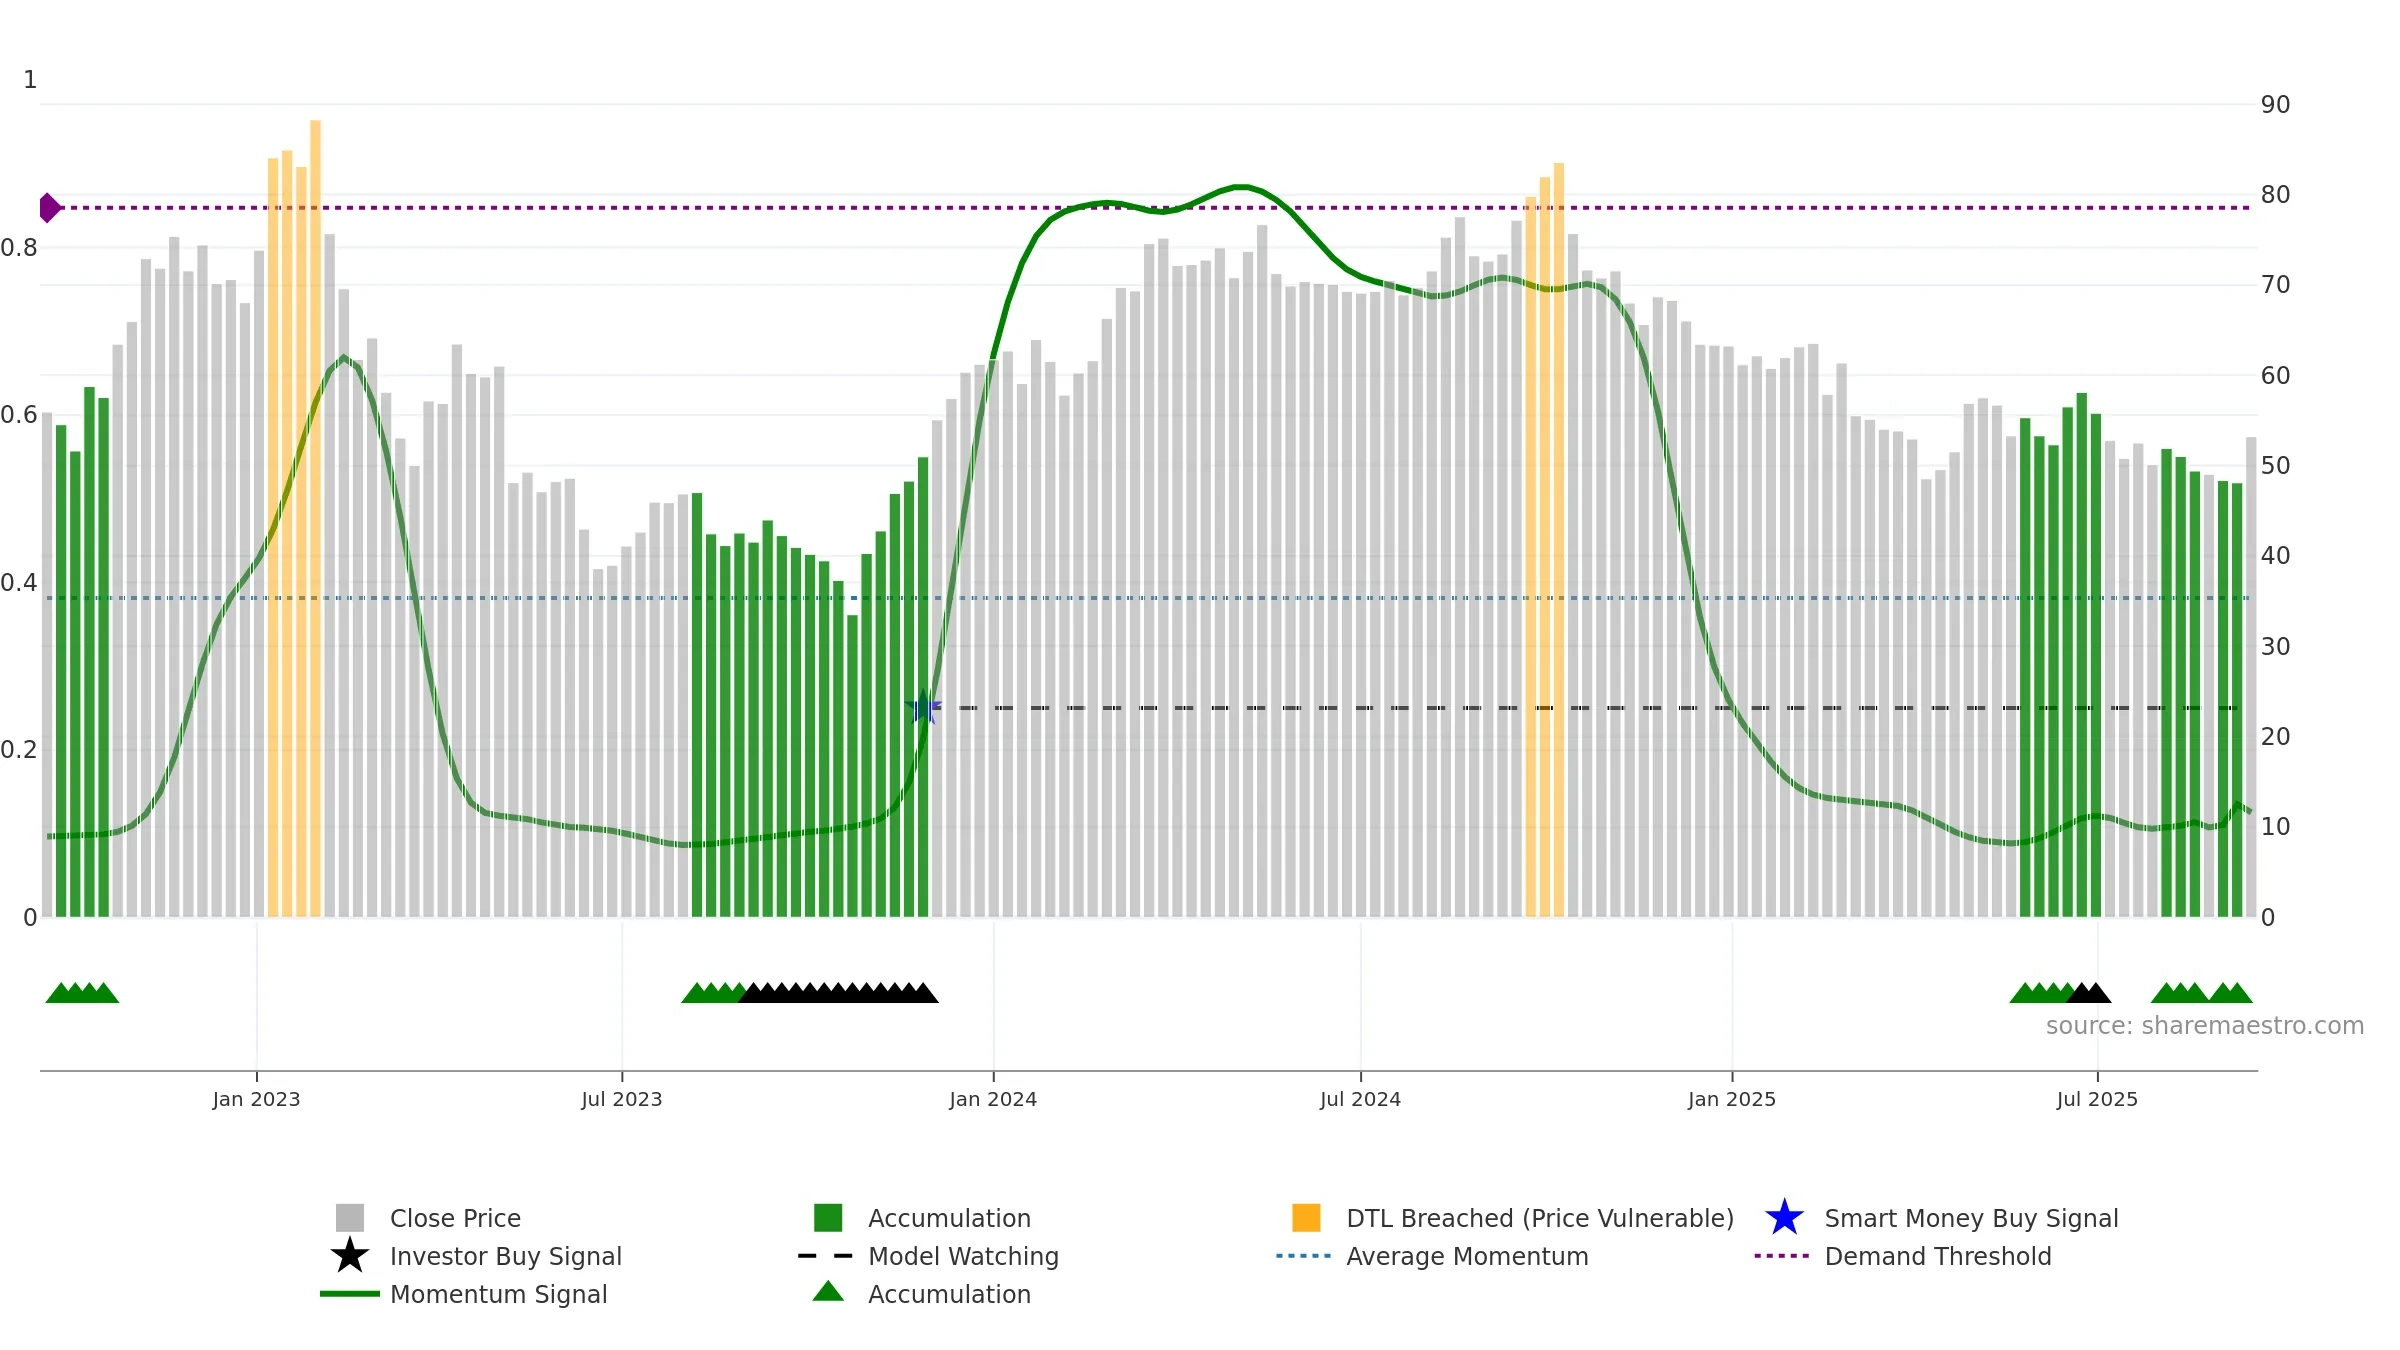
Weekly Report
FastPartner AB (publ) closed at 53.2000 (1.92% WoW) . Data window ends Mon, 15 Sep 2025.
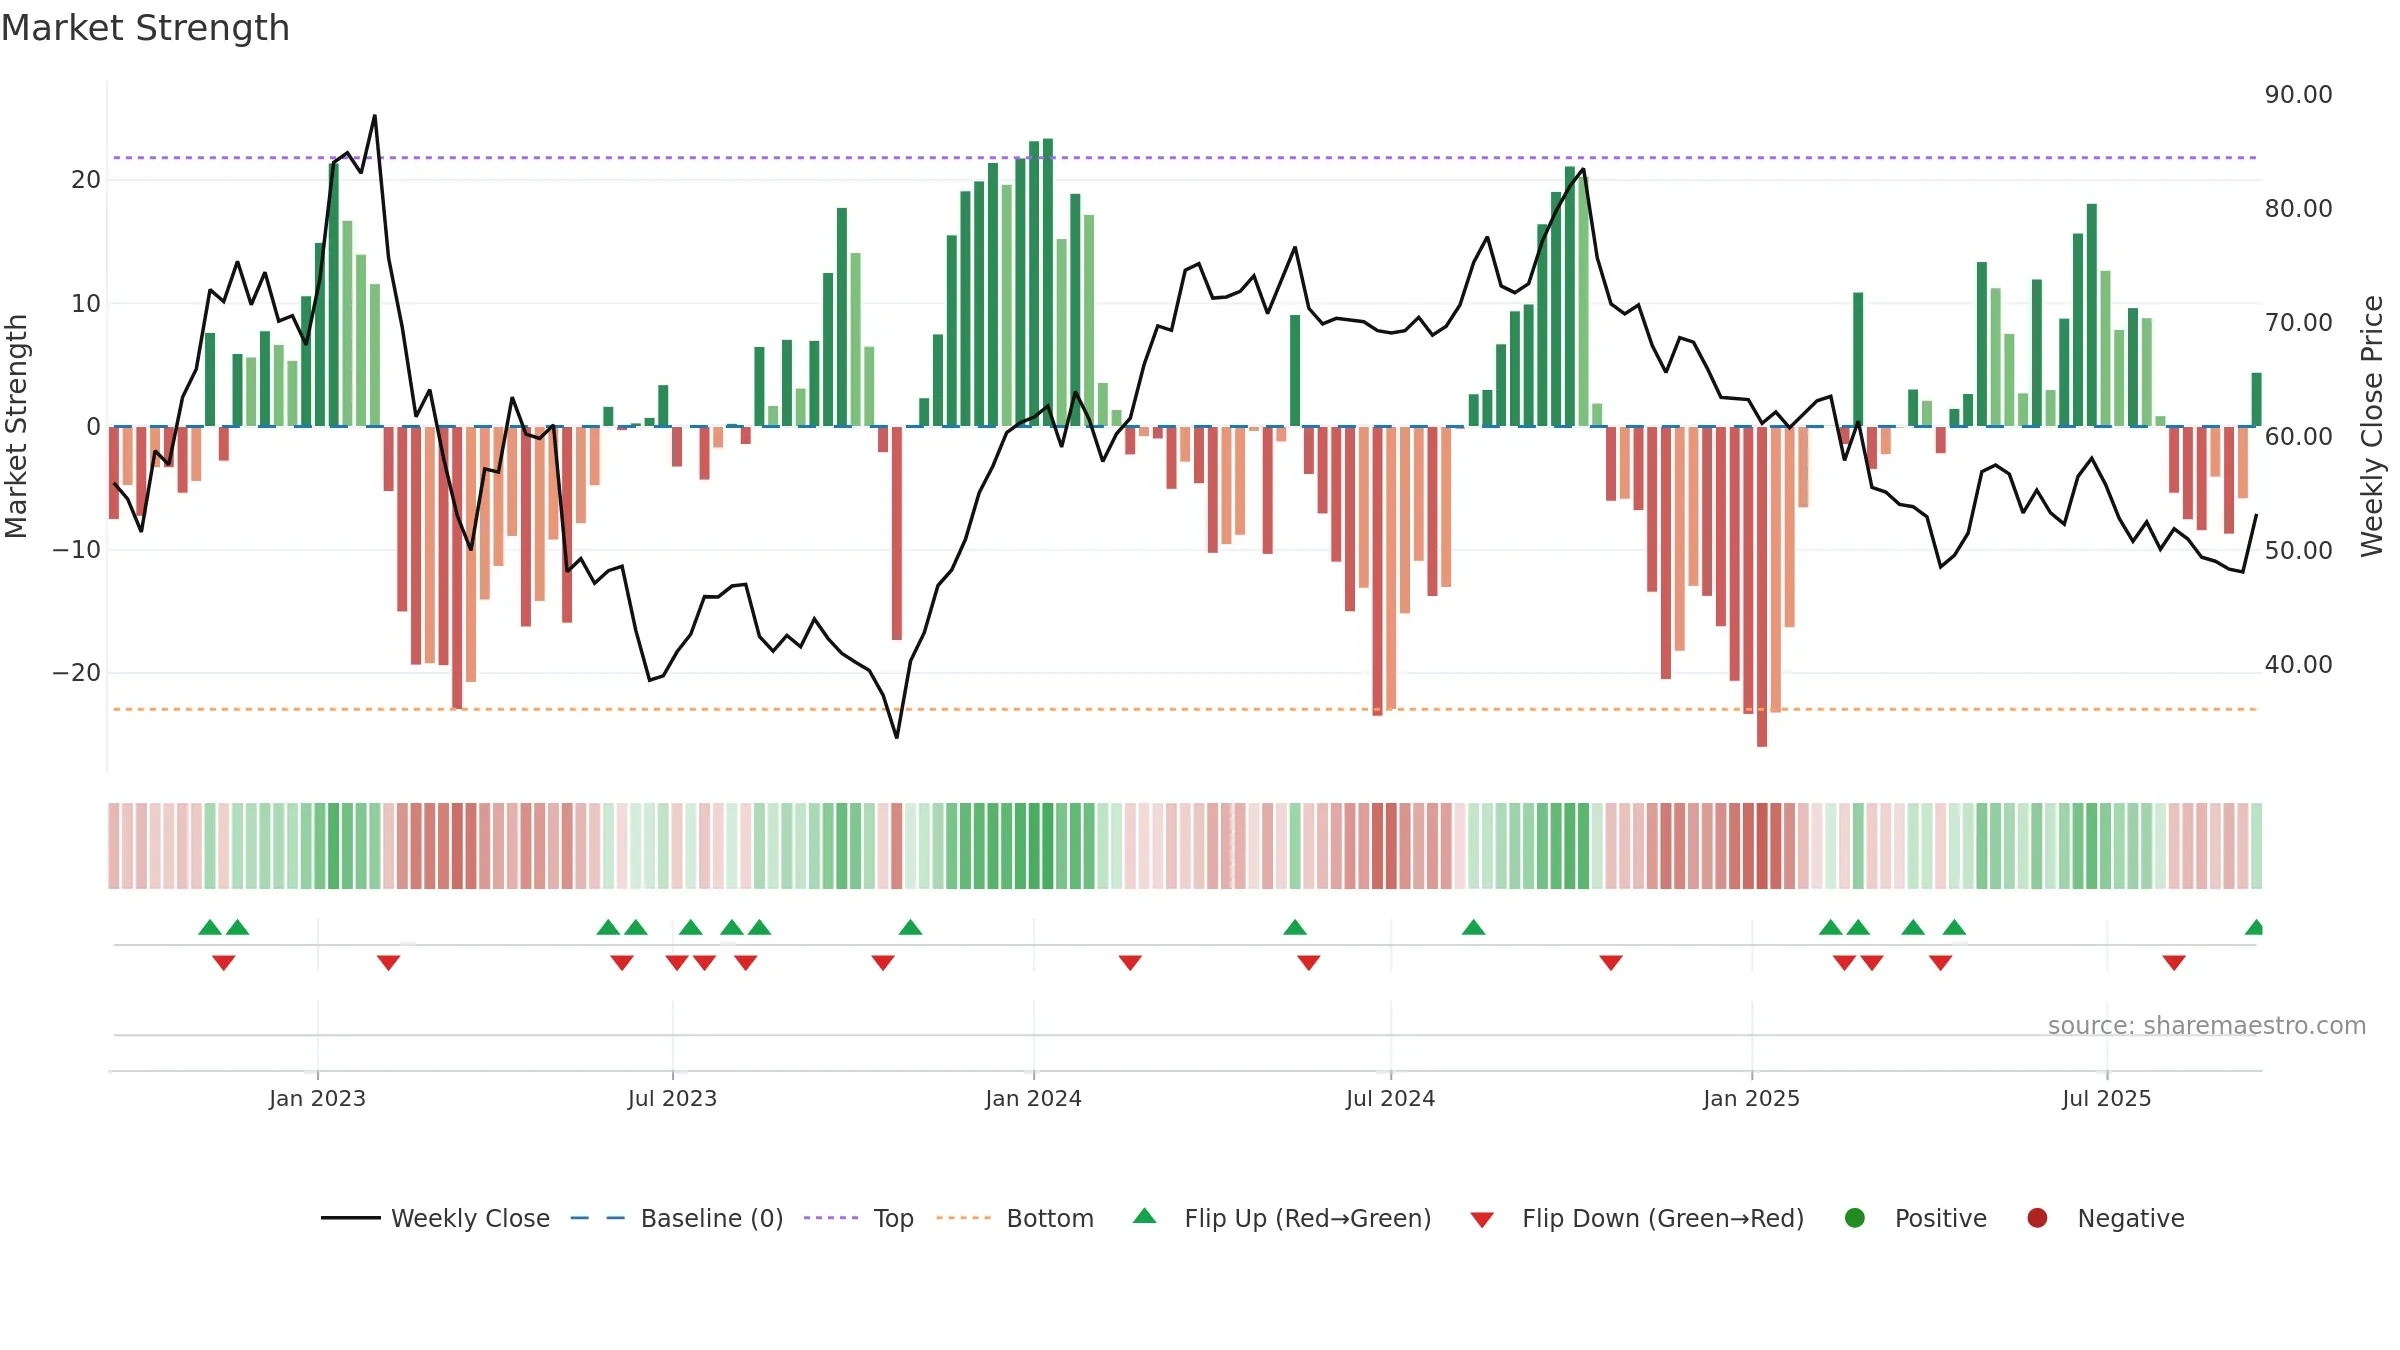
How to read this — Price slope is downward, indicating persistent supply pressure. Volume trend diverges from price — watch for fatigue or rotation. Weak MA stack argues for caution; rallies can fail near the 8–13 week region. Price holds above key averages, indicating constructive participation.
Down-slope argues for patience; rallies can fade sooner unless participation improves. Because liquidity isn’t confirming, prefer evidence of fresh demand before chasing moves.
Gauge maps the trend signal to a 0–100 scale.
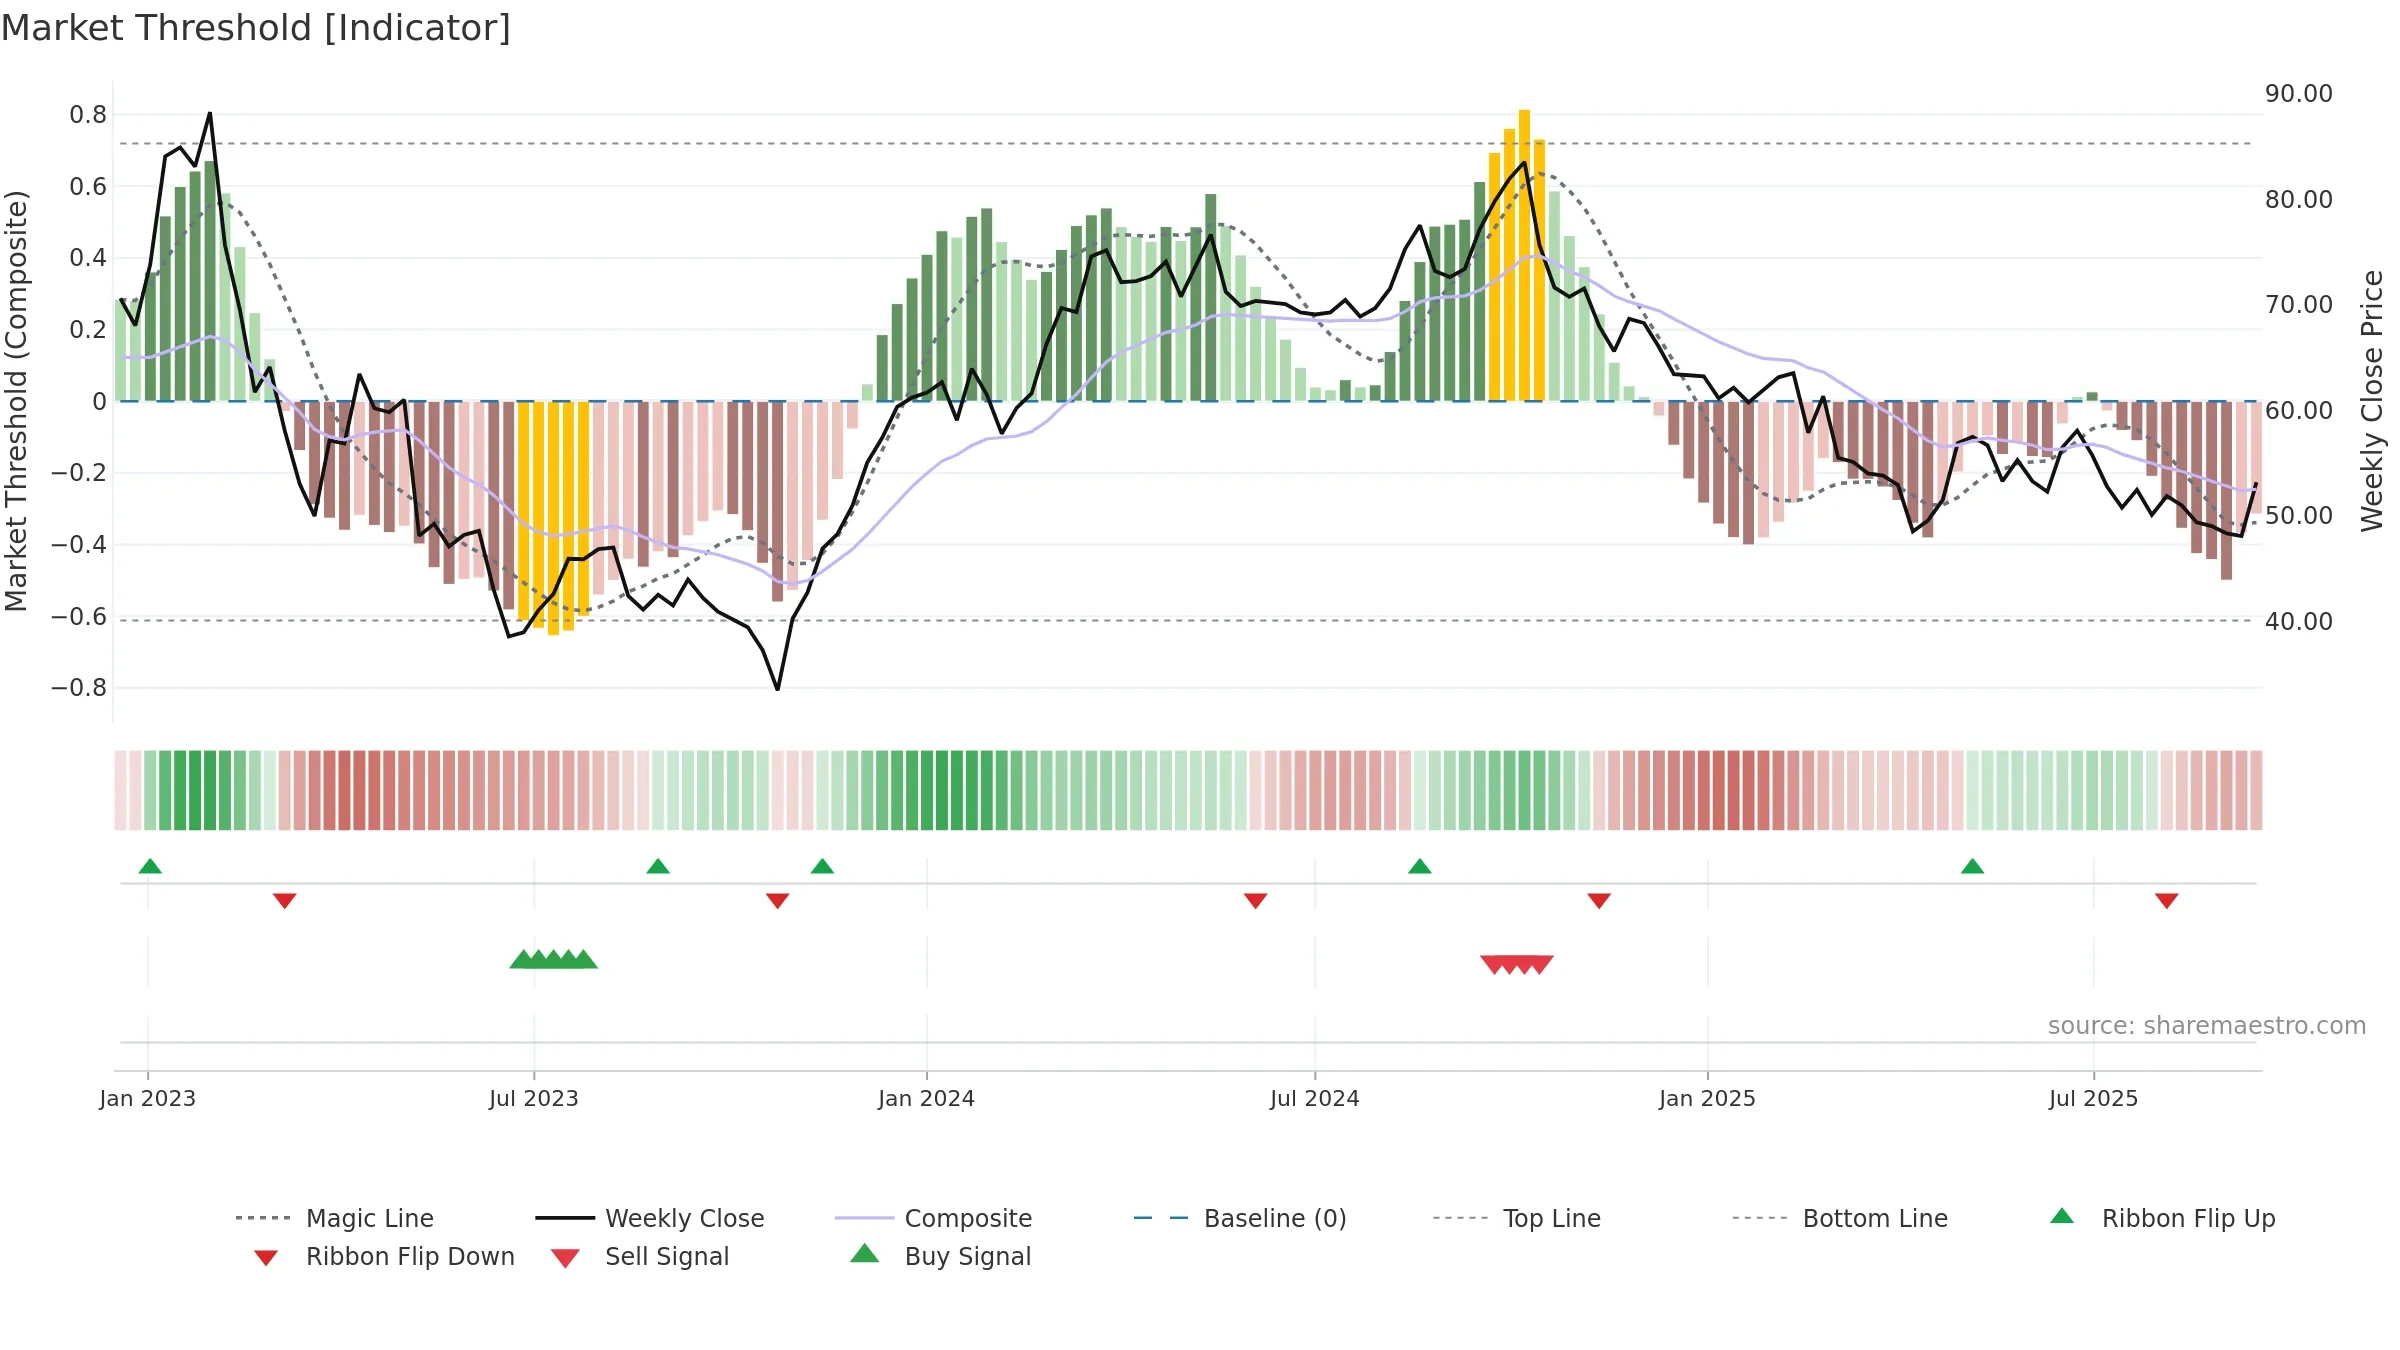
How to read this — Bearish backdrop but short-term momentum is improving; confirmation still needed.
Early improvement — look for a reclaim of 0.50→0.60 to validate.
Price is above fair value; upside may be capped without catalysts.
Conclusion
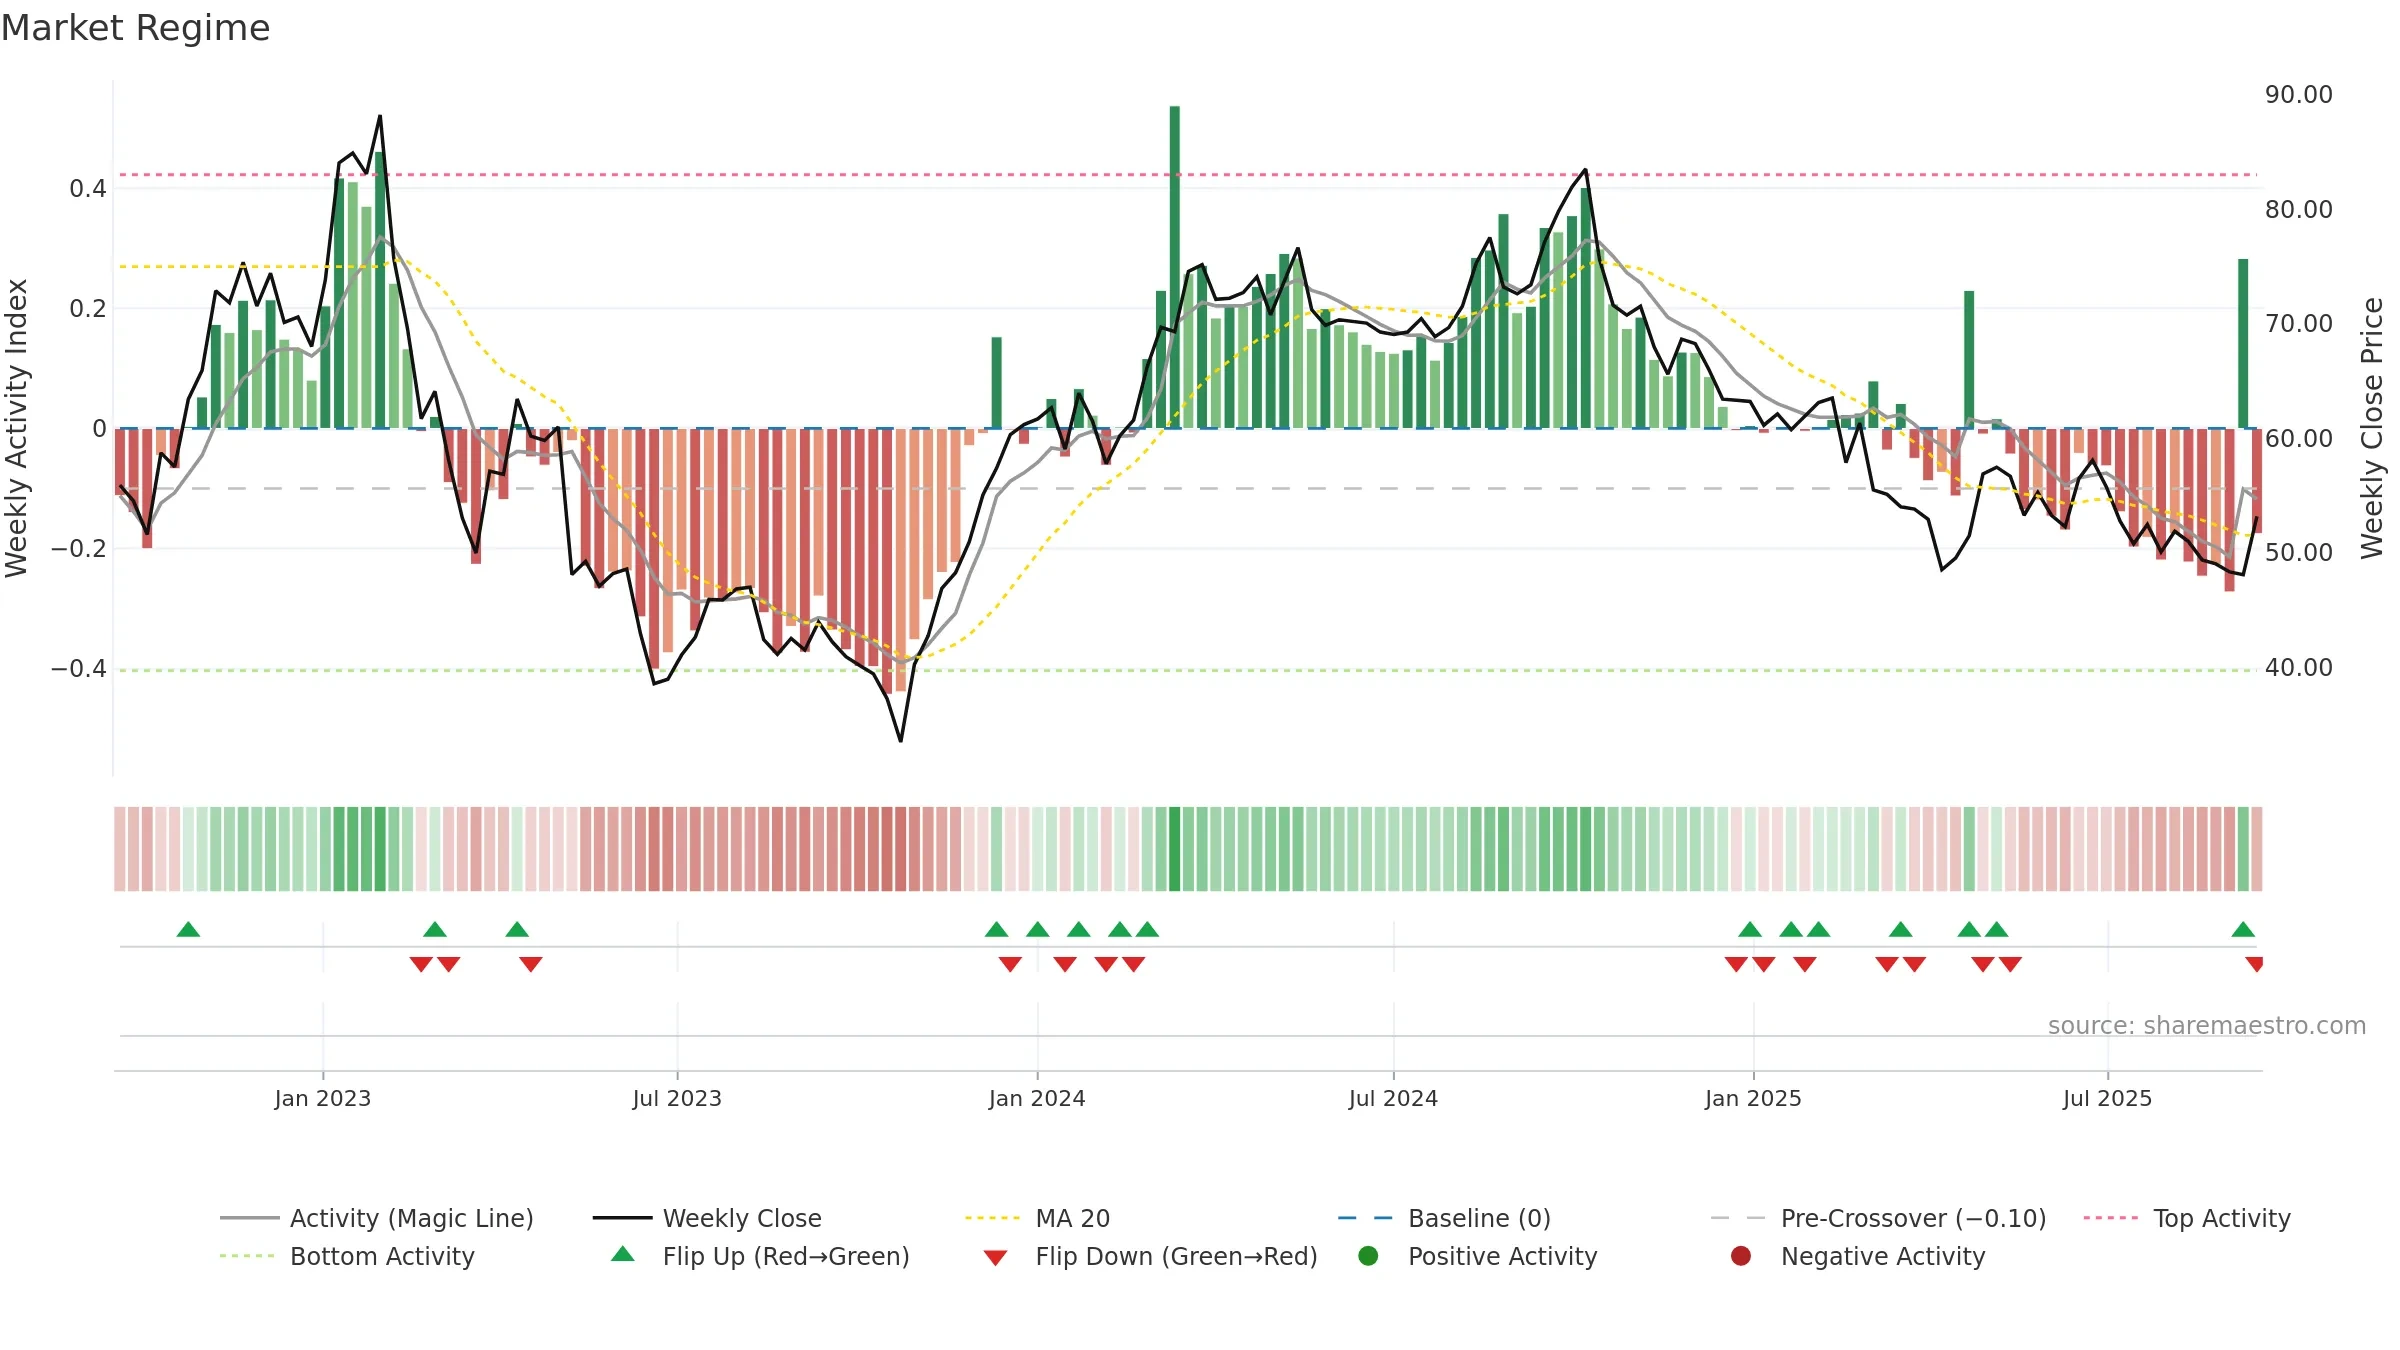
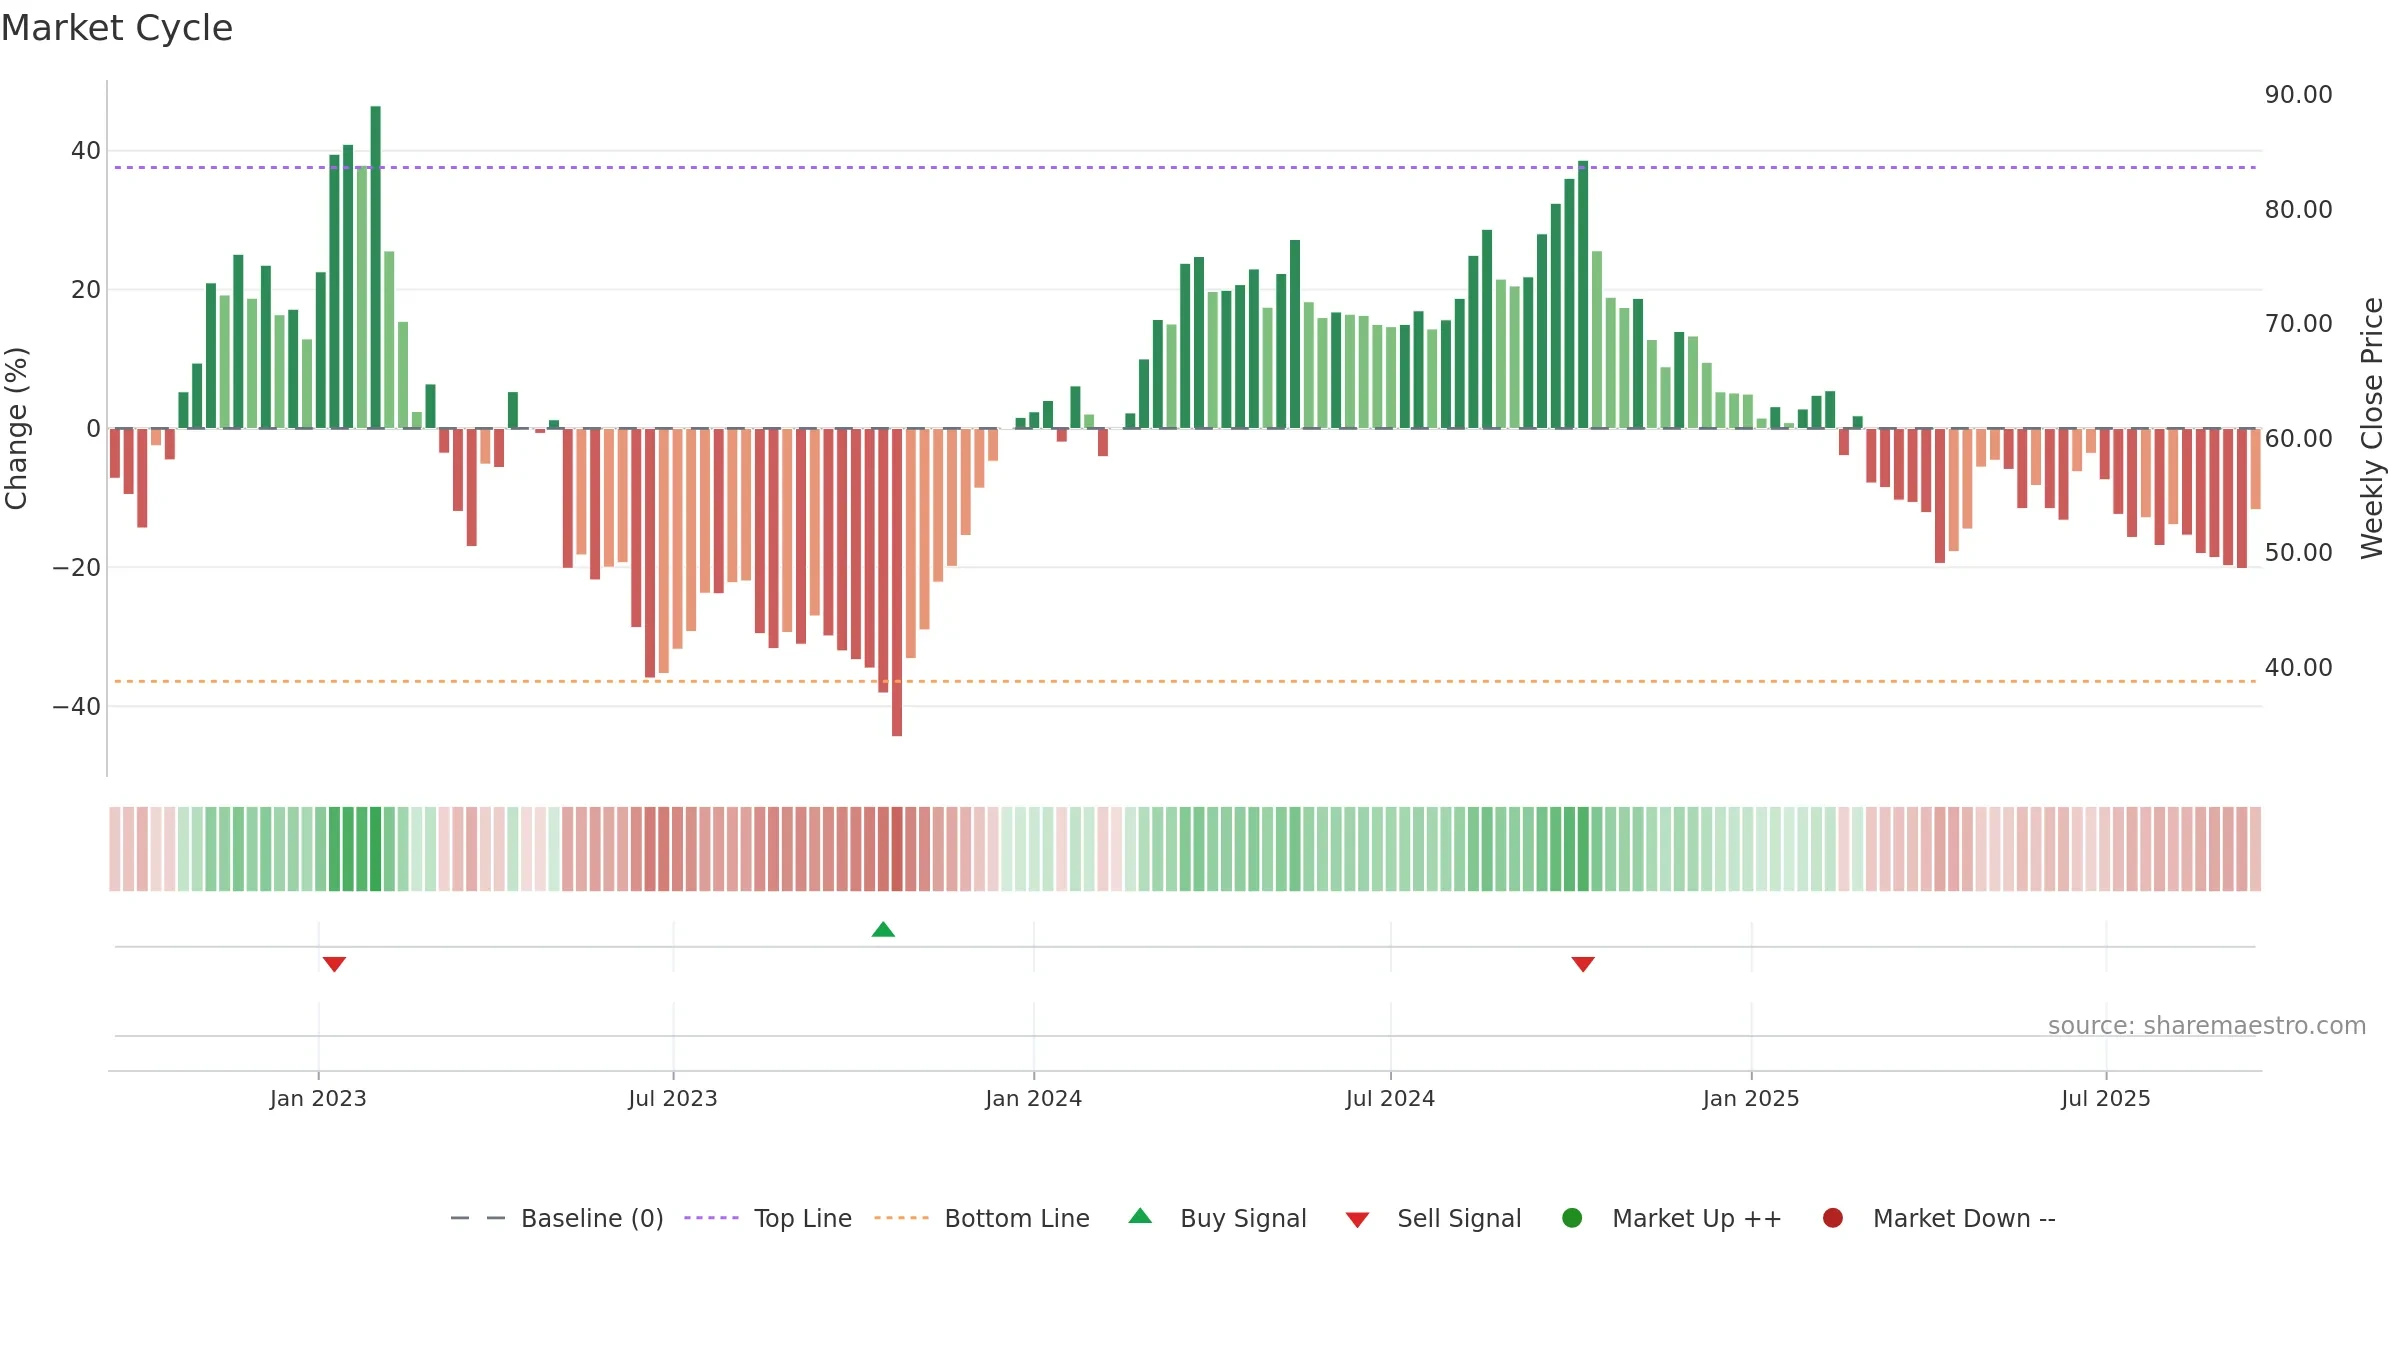
Positive setup. ★★★★☆ confidence. Price window: 6. Trend: Bottoming Attempt; gauge 12. In combination, liquidity diverges from price.
- Early improvement from bearish zone (bottoming attempt)
- Price holds above 8w & 26w averages
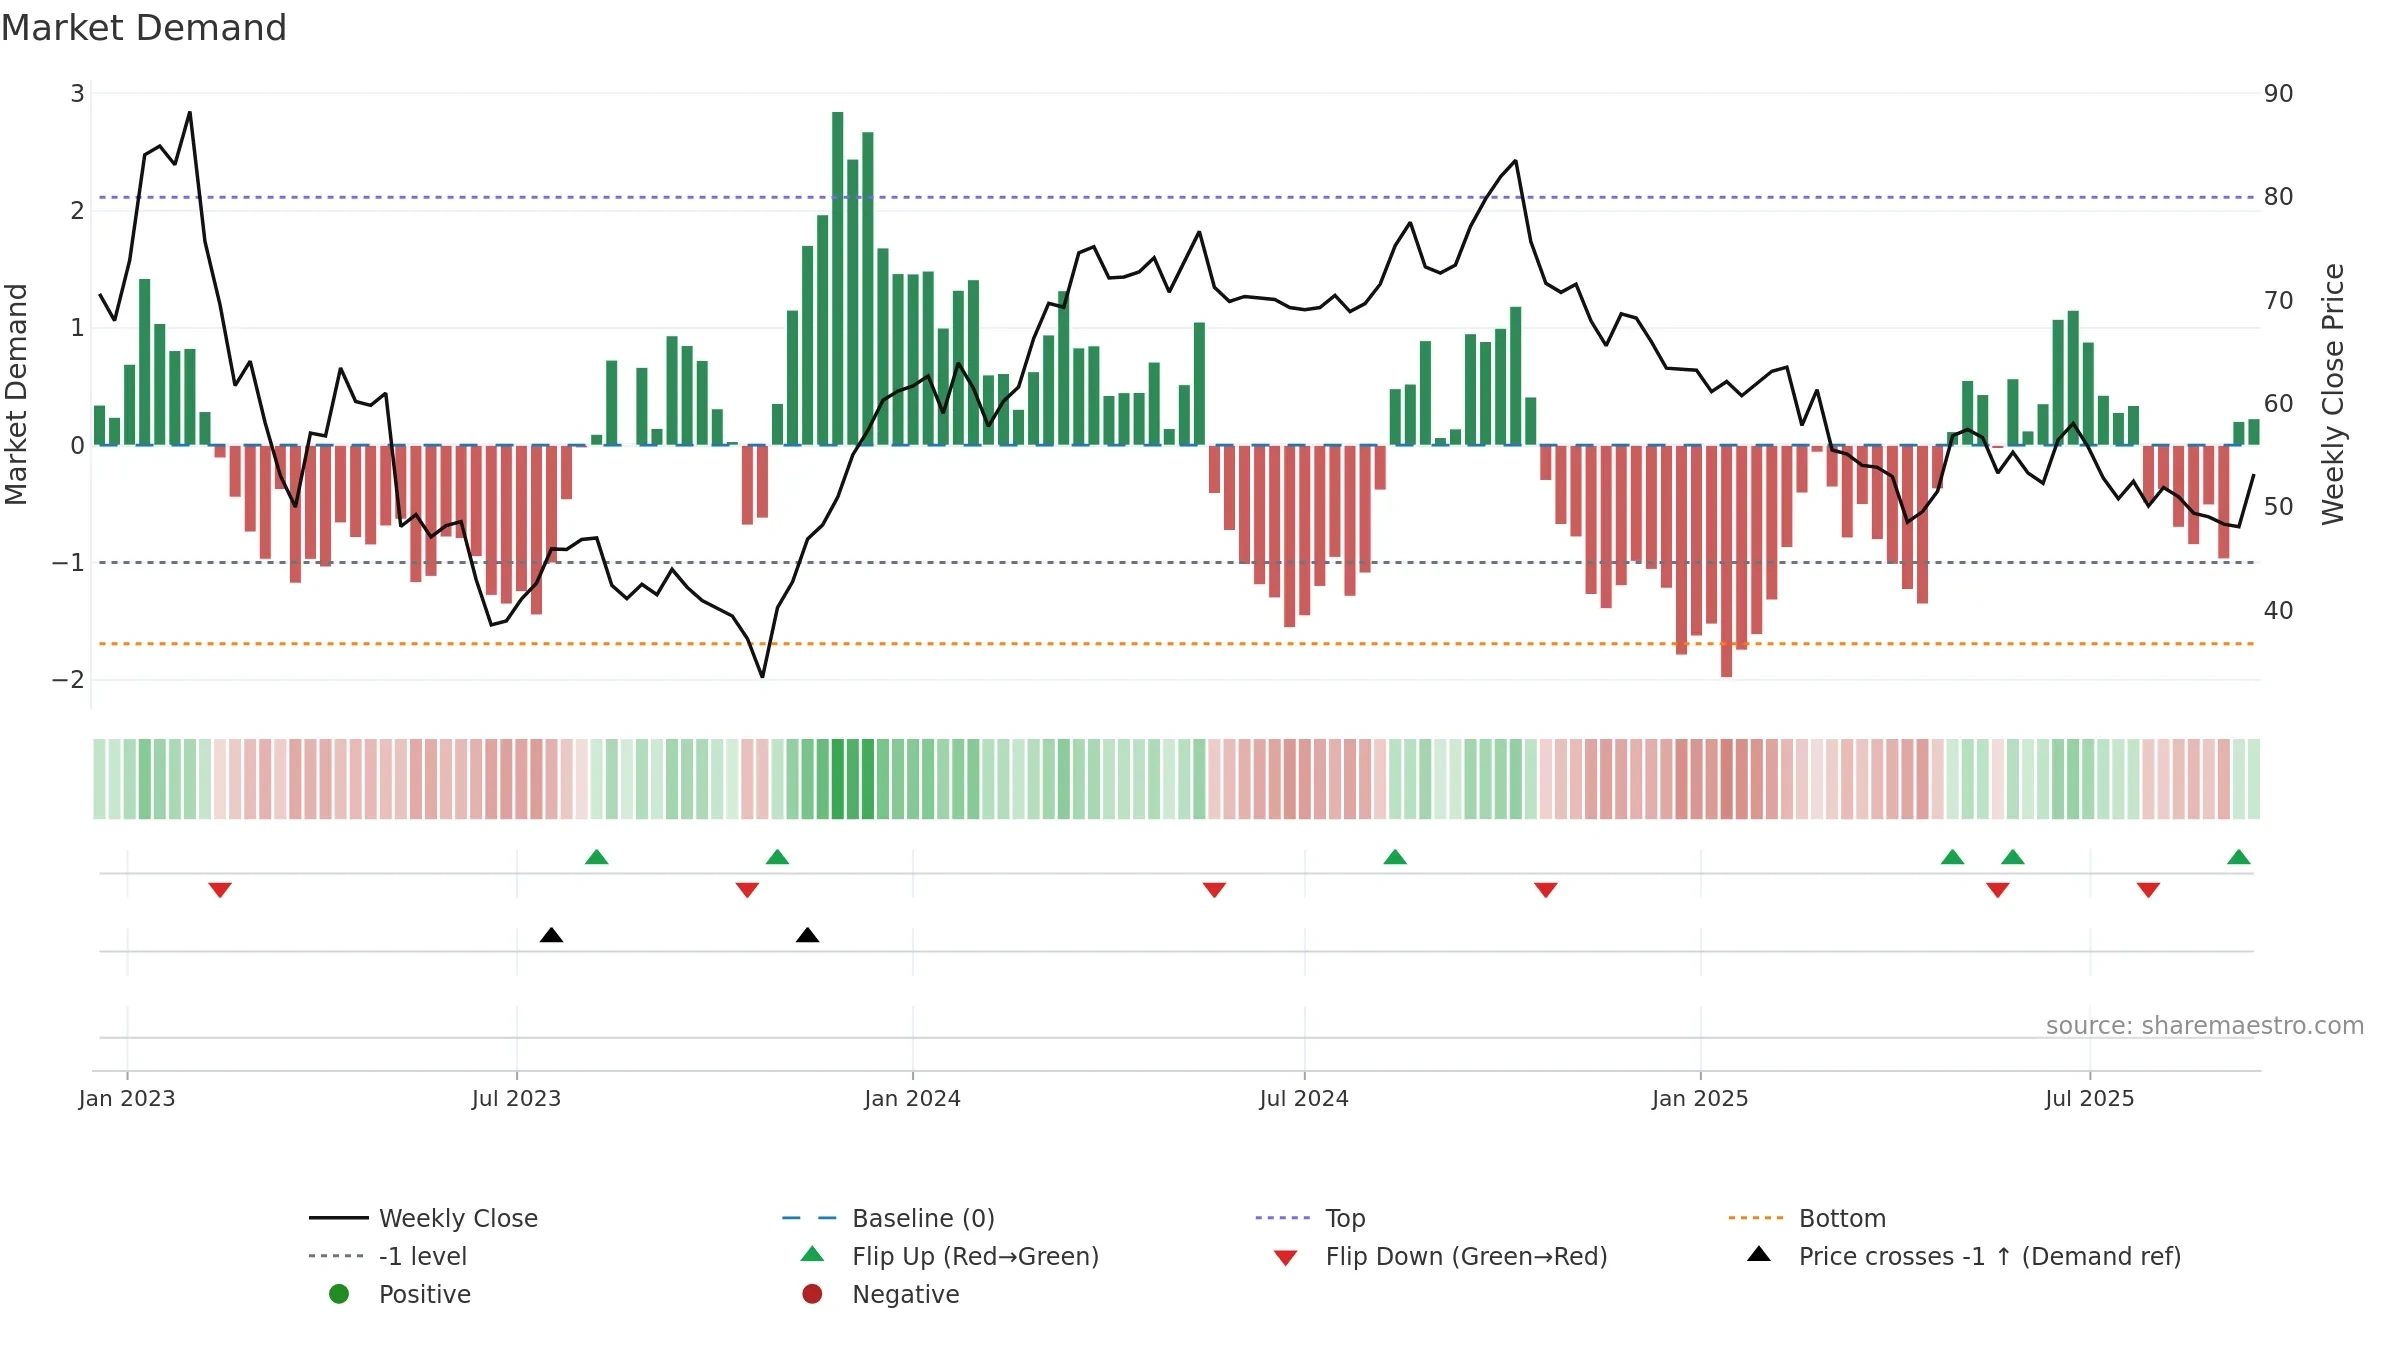
- Buyers step in at depressed levels (accumulation)
- Weak moving-average stack
- Liquidity diverges from price
Why: Price window 6.19% over 8w. Close is 2.50% above the prior-window high. Return volatility 2.45%. Volume trend rising. Liquidity divergence with price. Trend state bottoming attempt. Low-regime (≤0.25) upticks 5/7 (71.0%) • Accumulating. MA stack weak. Momentum neutral and rising. Valuation limited upside without catalysts.
Tip: Most metrics include a hover tooltip where they appear in the report.