Sabra Health Care REIT, Inc.
SBRA NASDAQ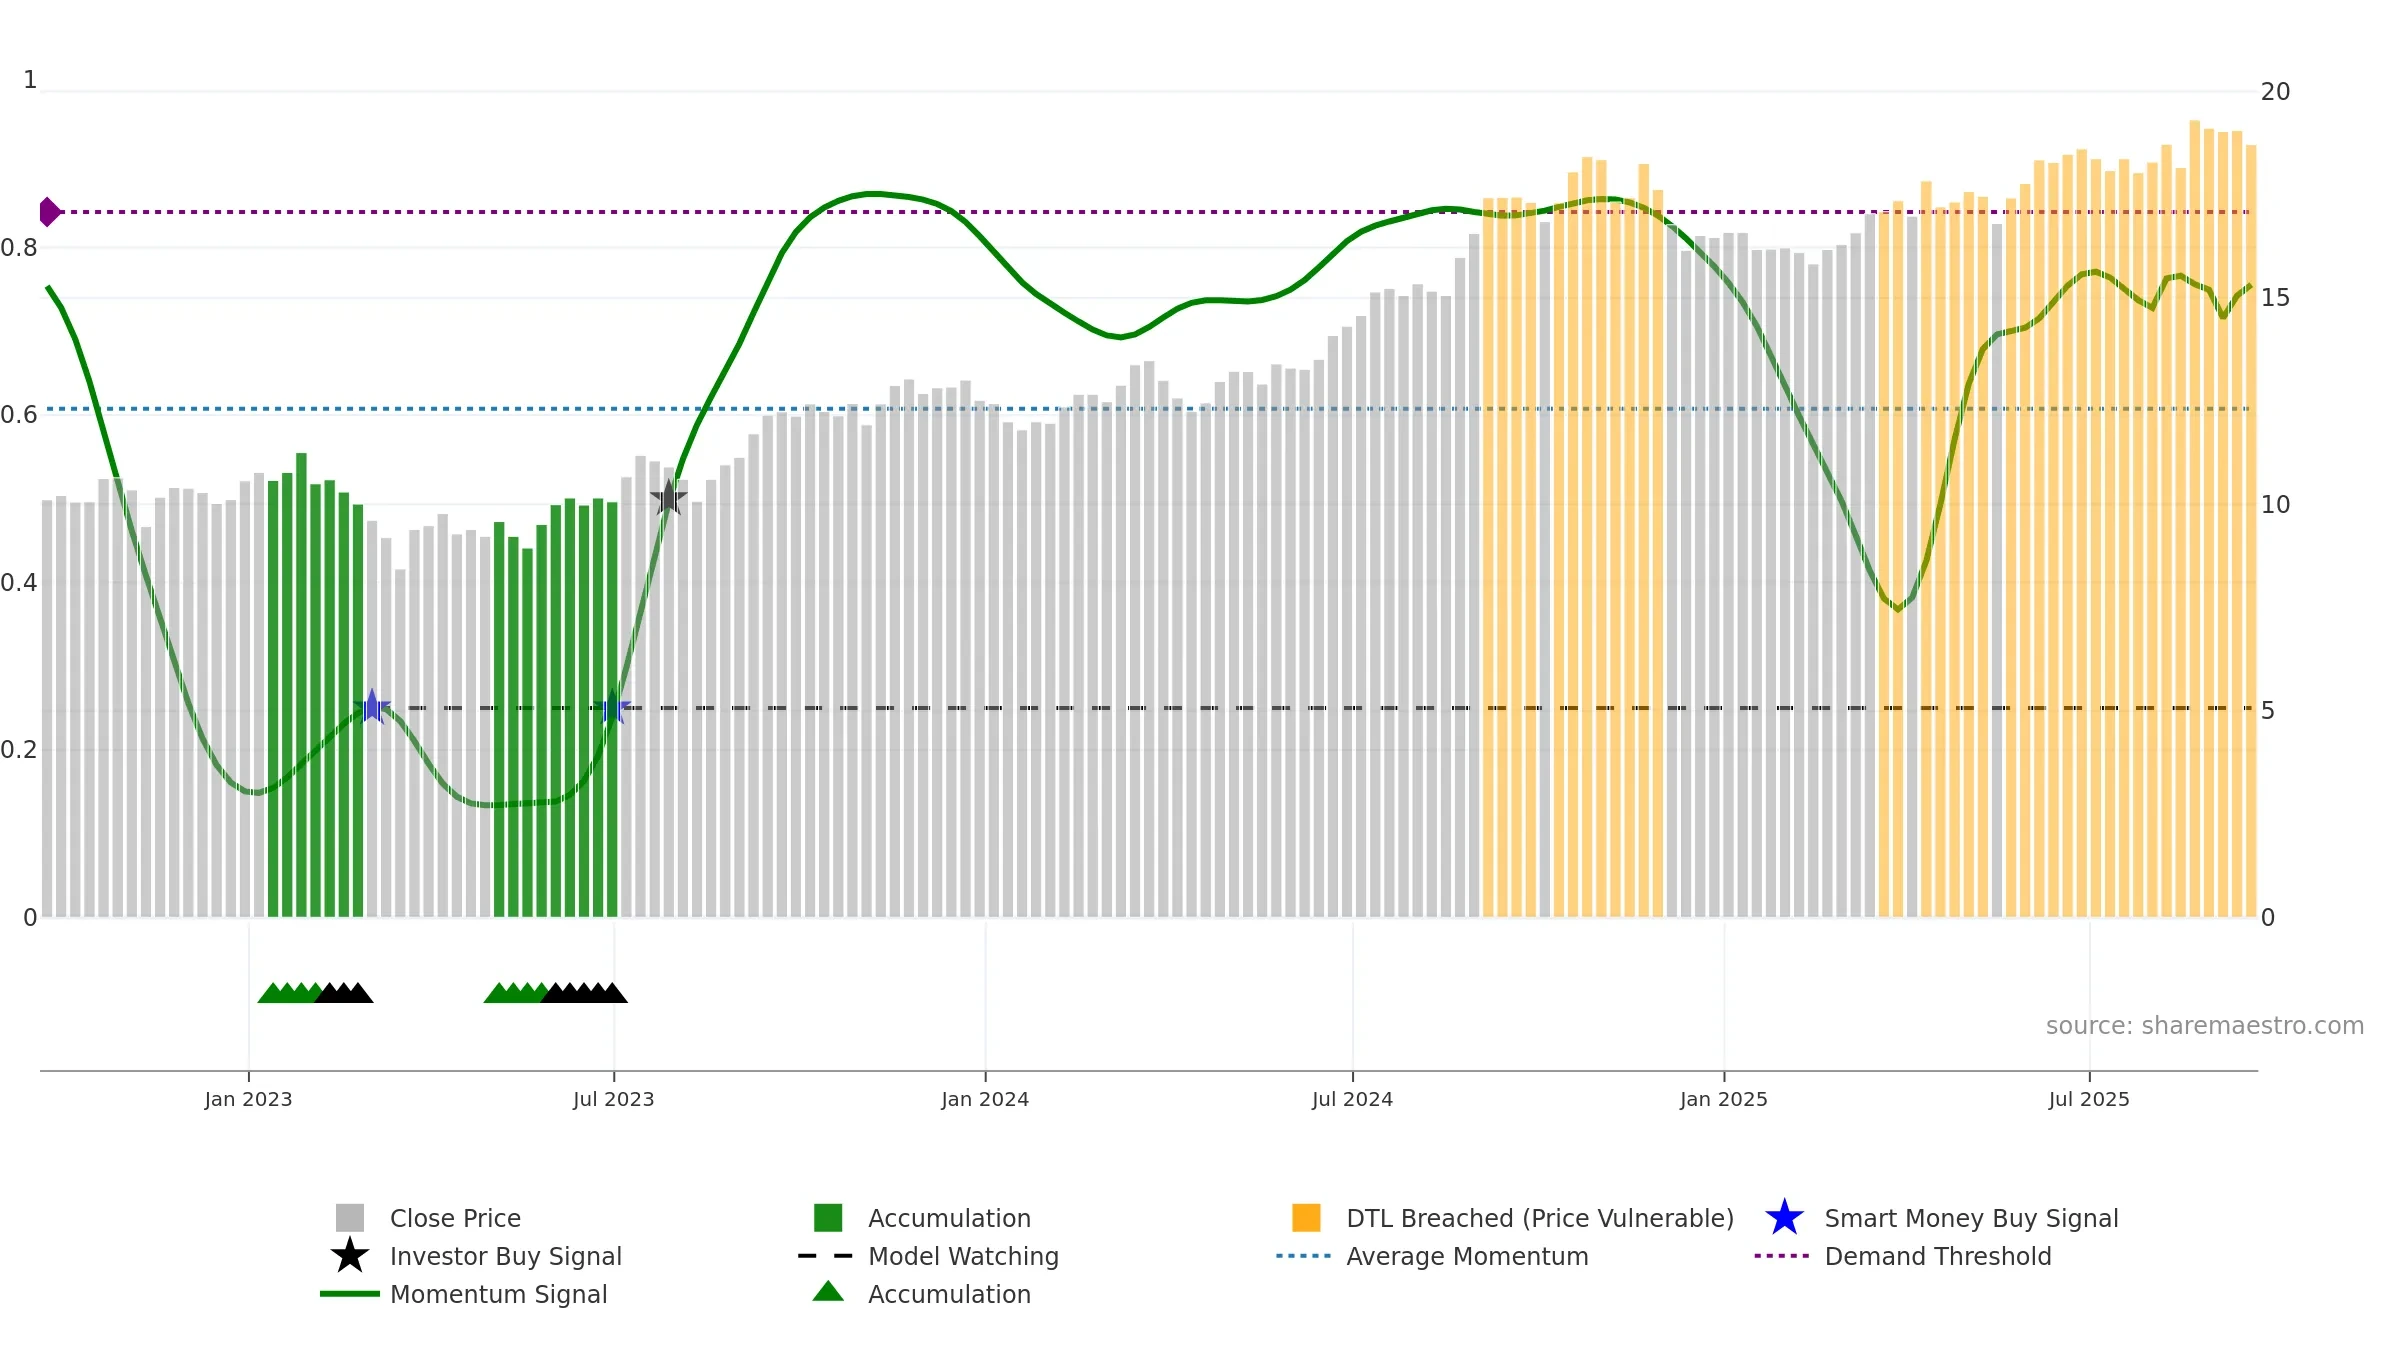
Weekly Summary
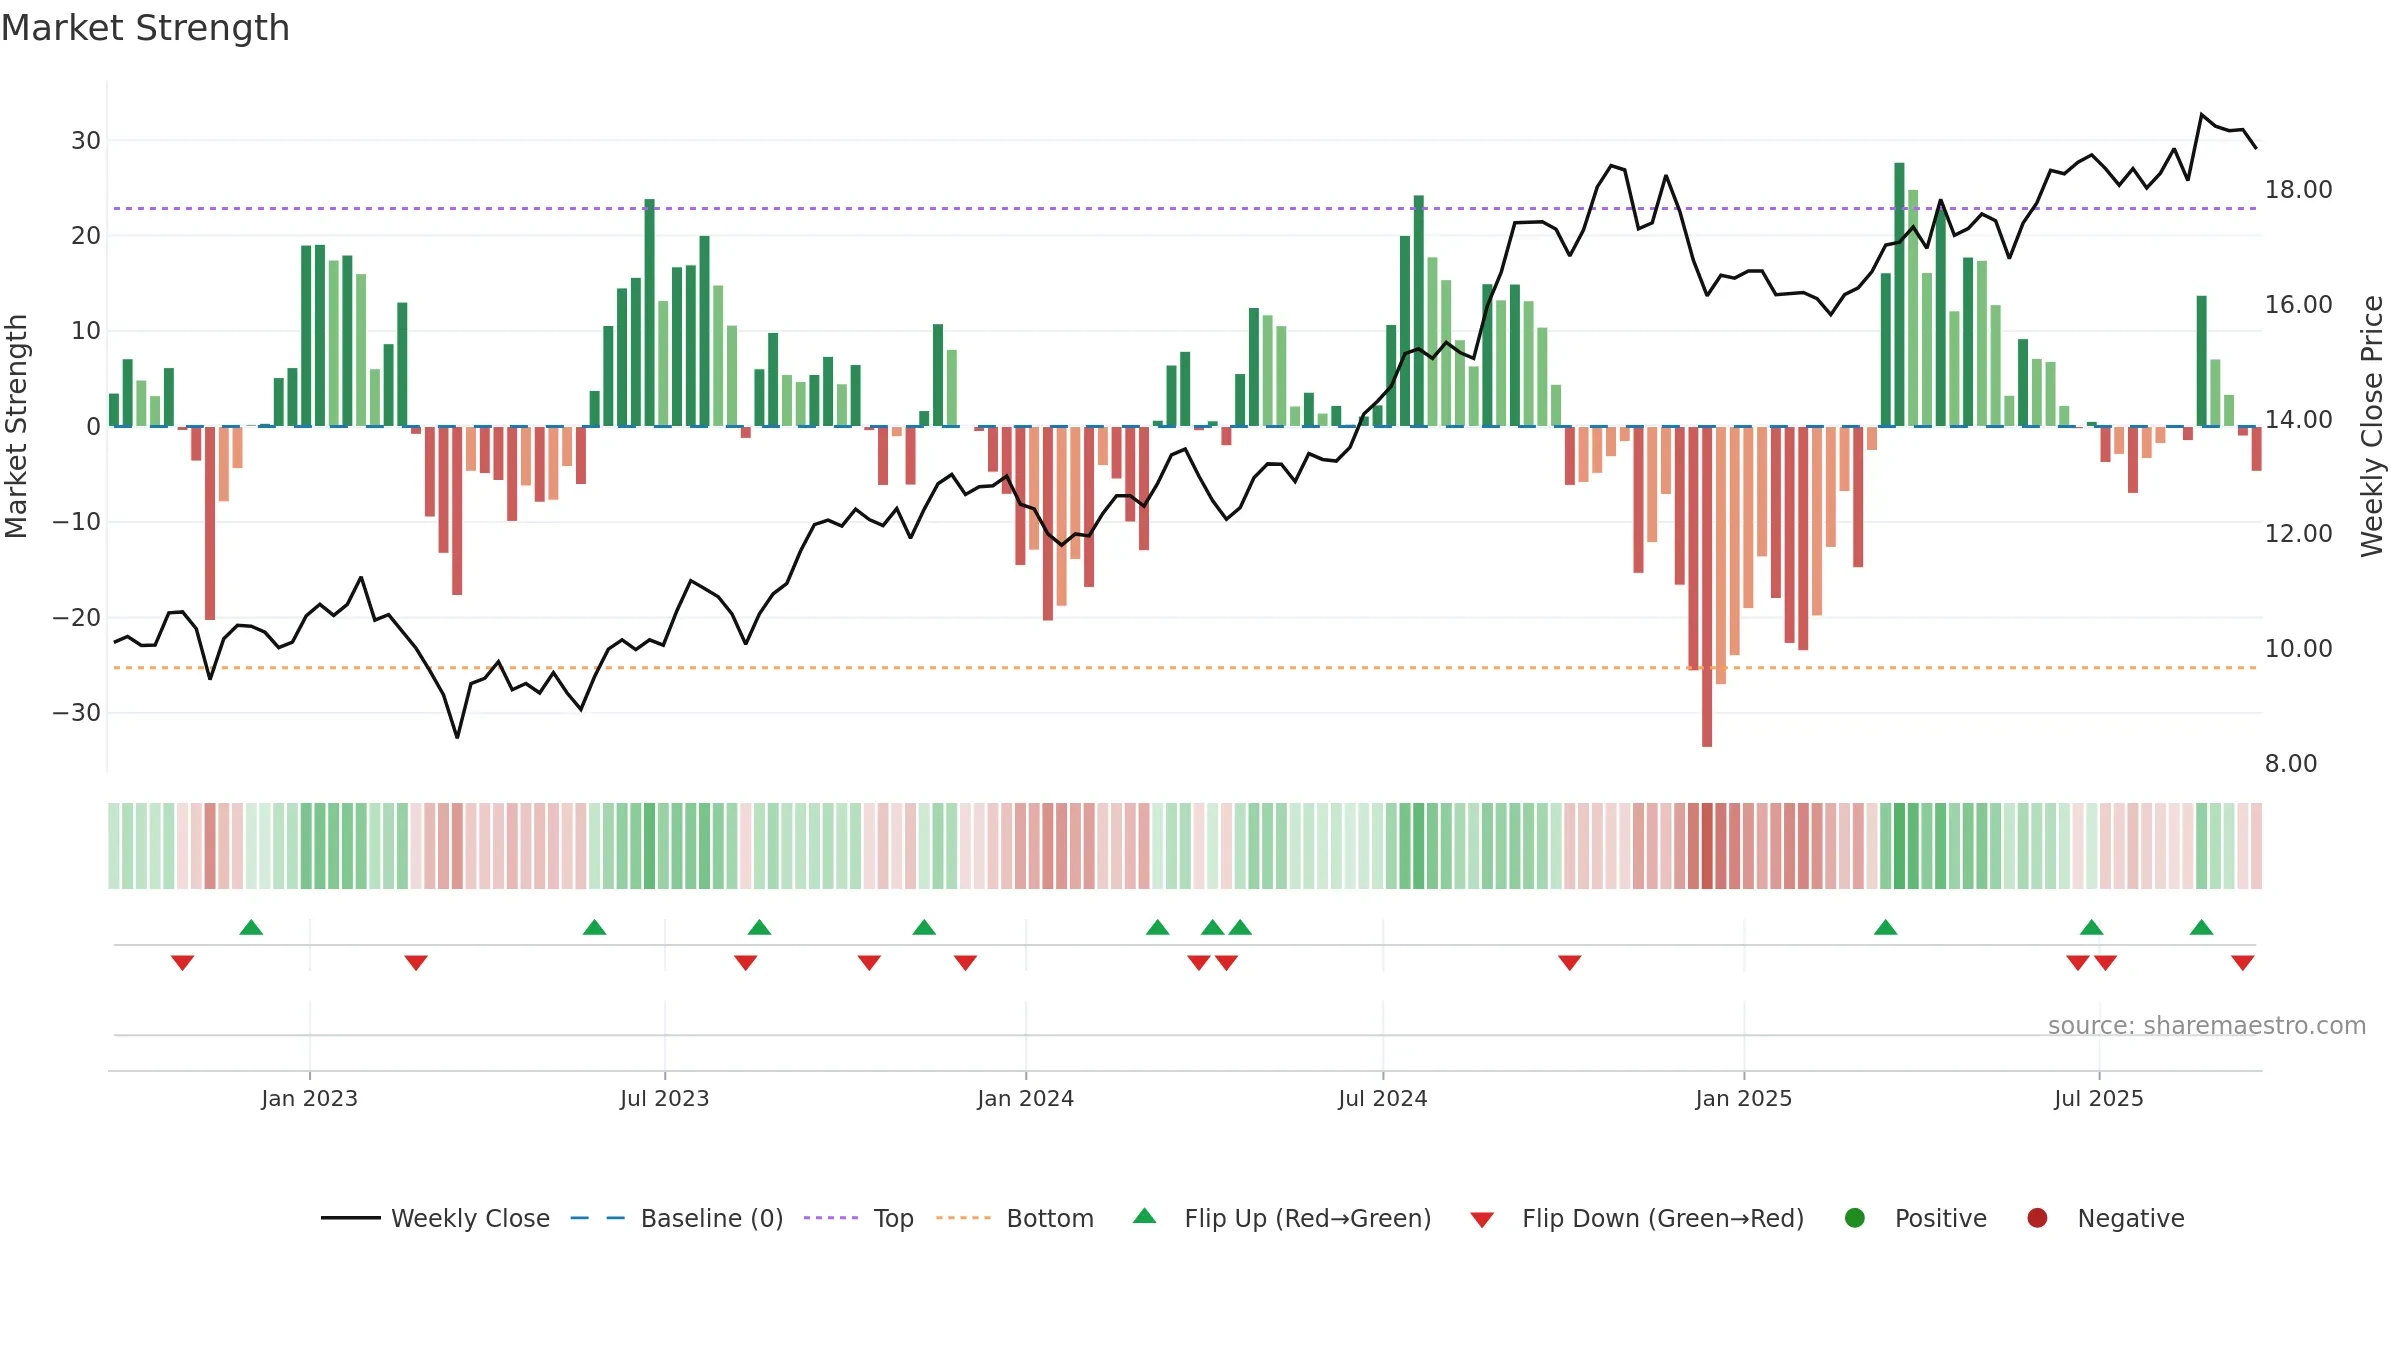
Sabra Health Care REIT, Inc. closed at 18.7100 (-0.80% WoW) . Data window ends Fri, 19 Sep 2025.
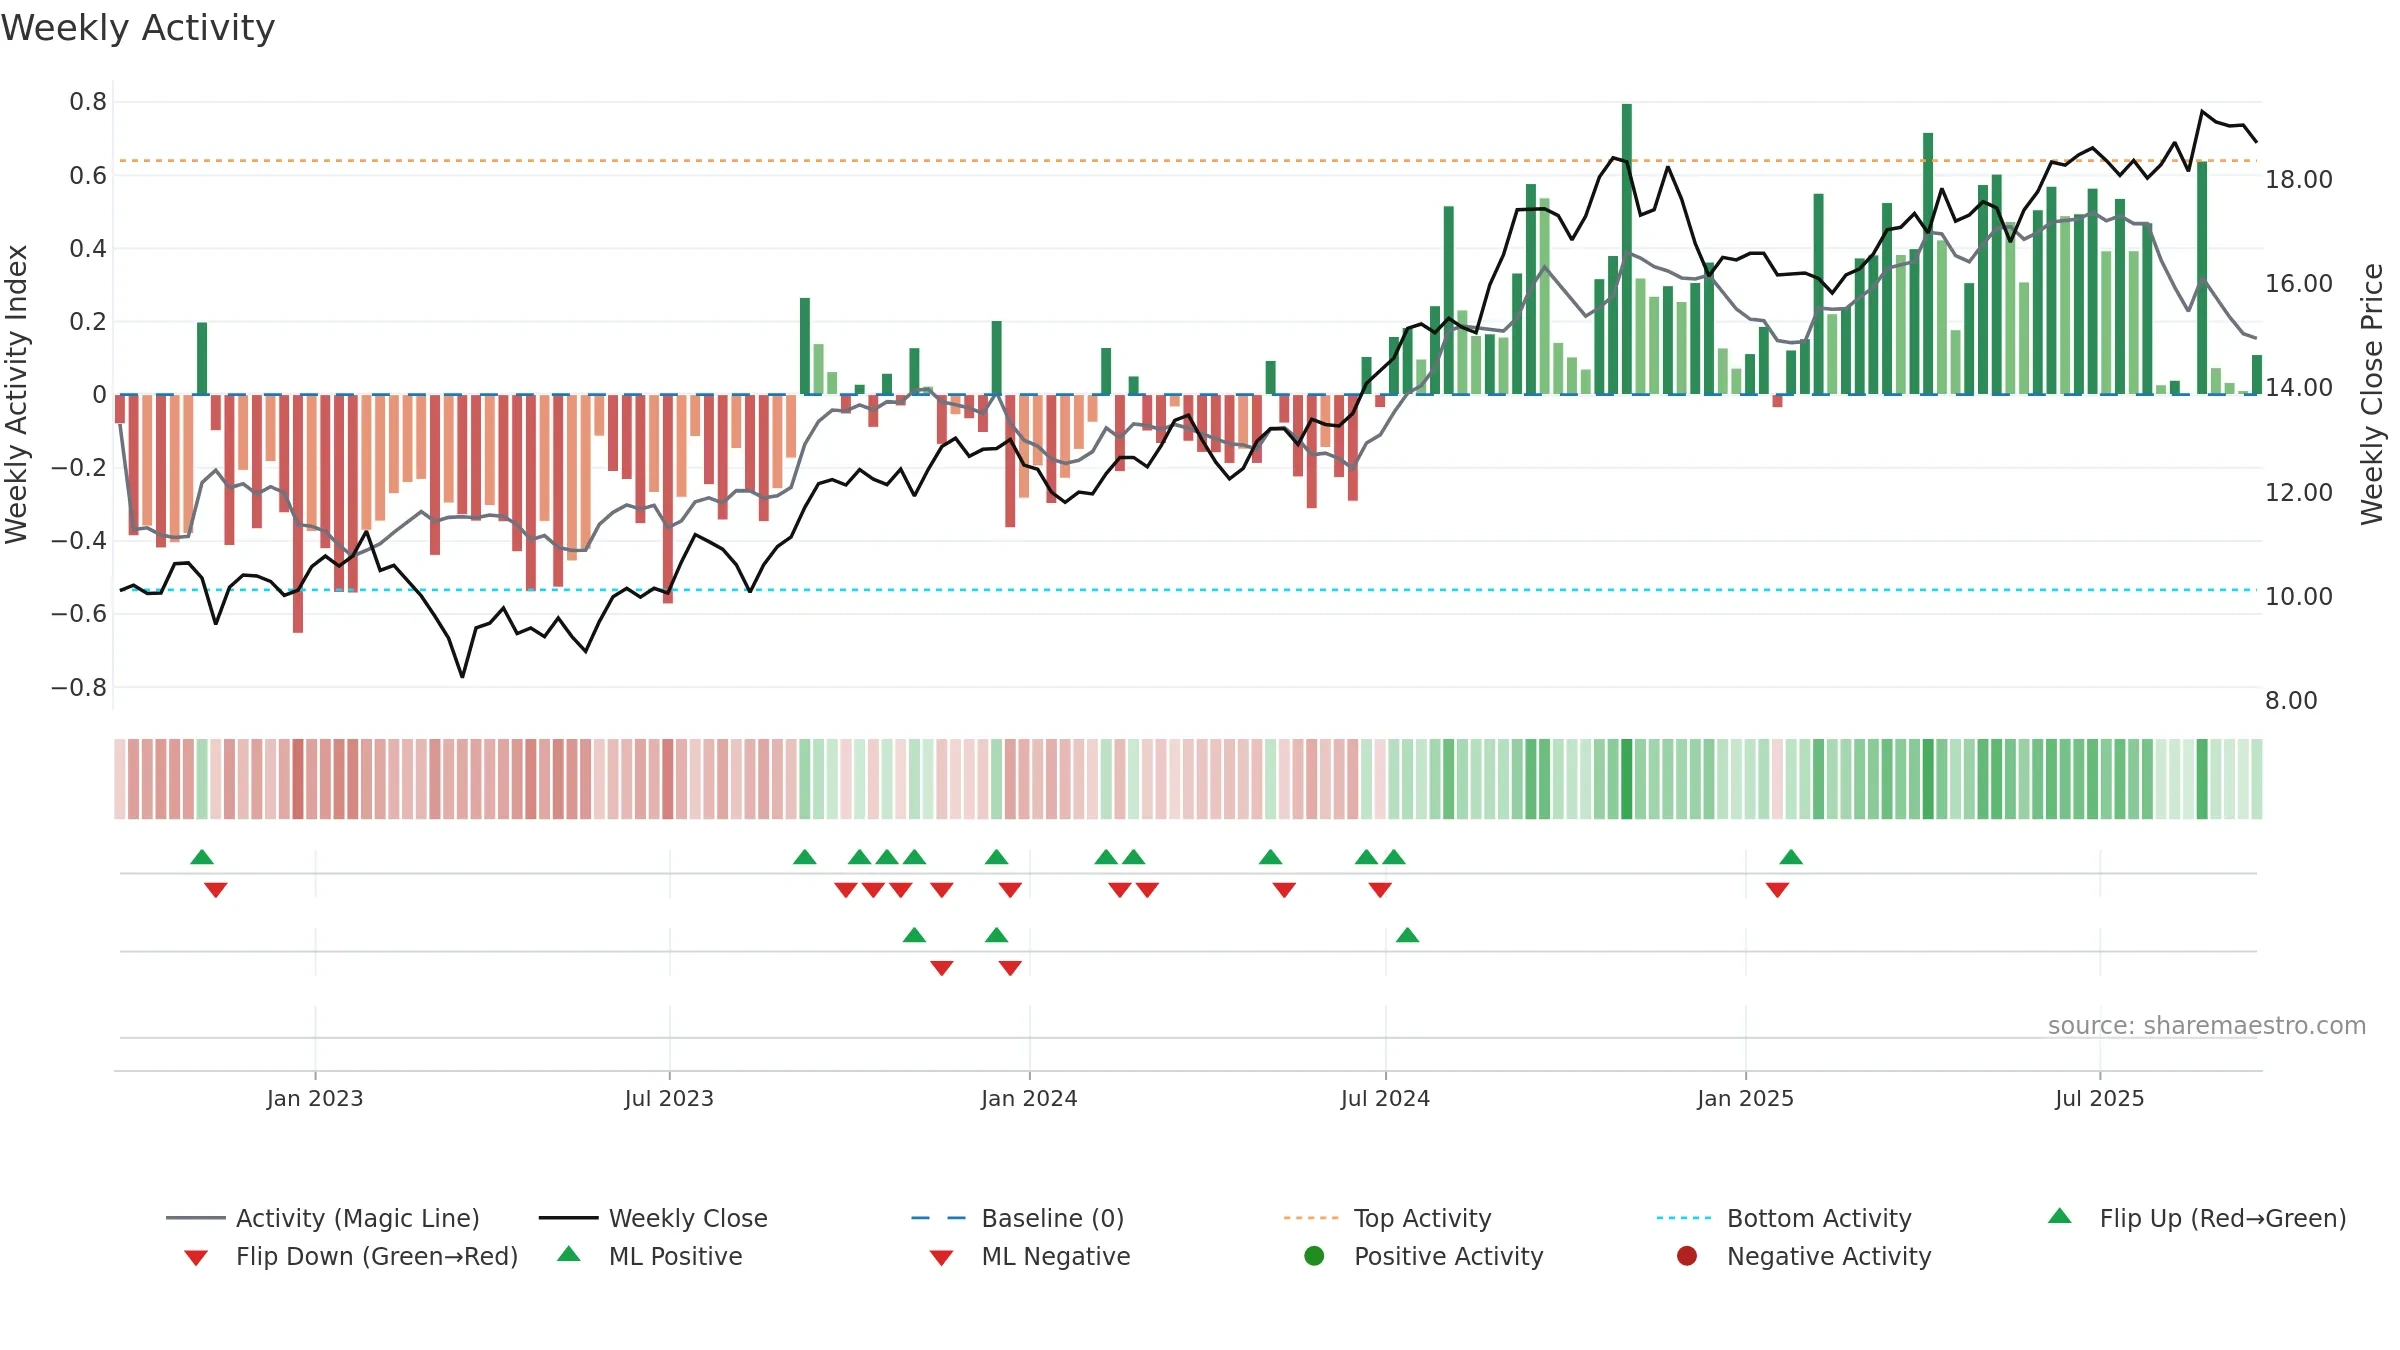
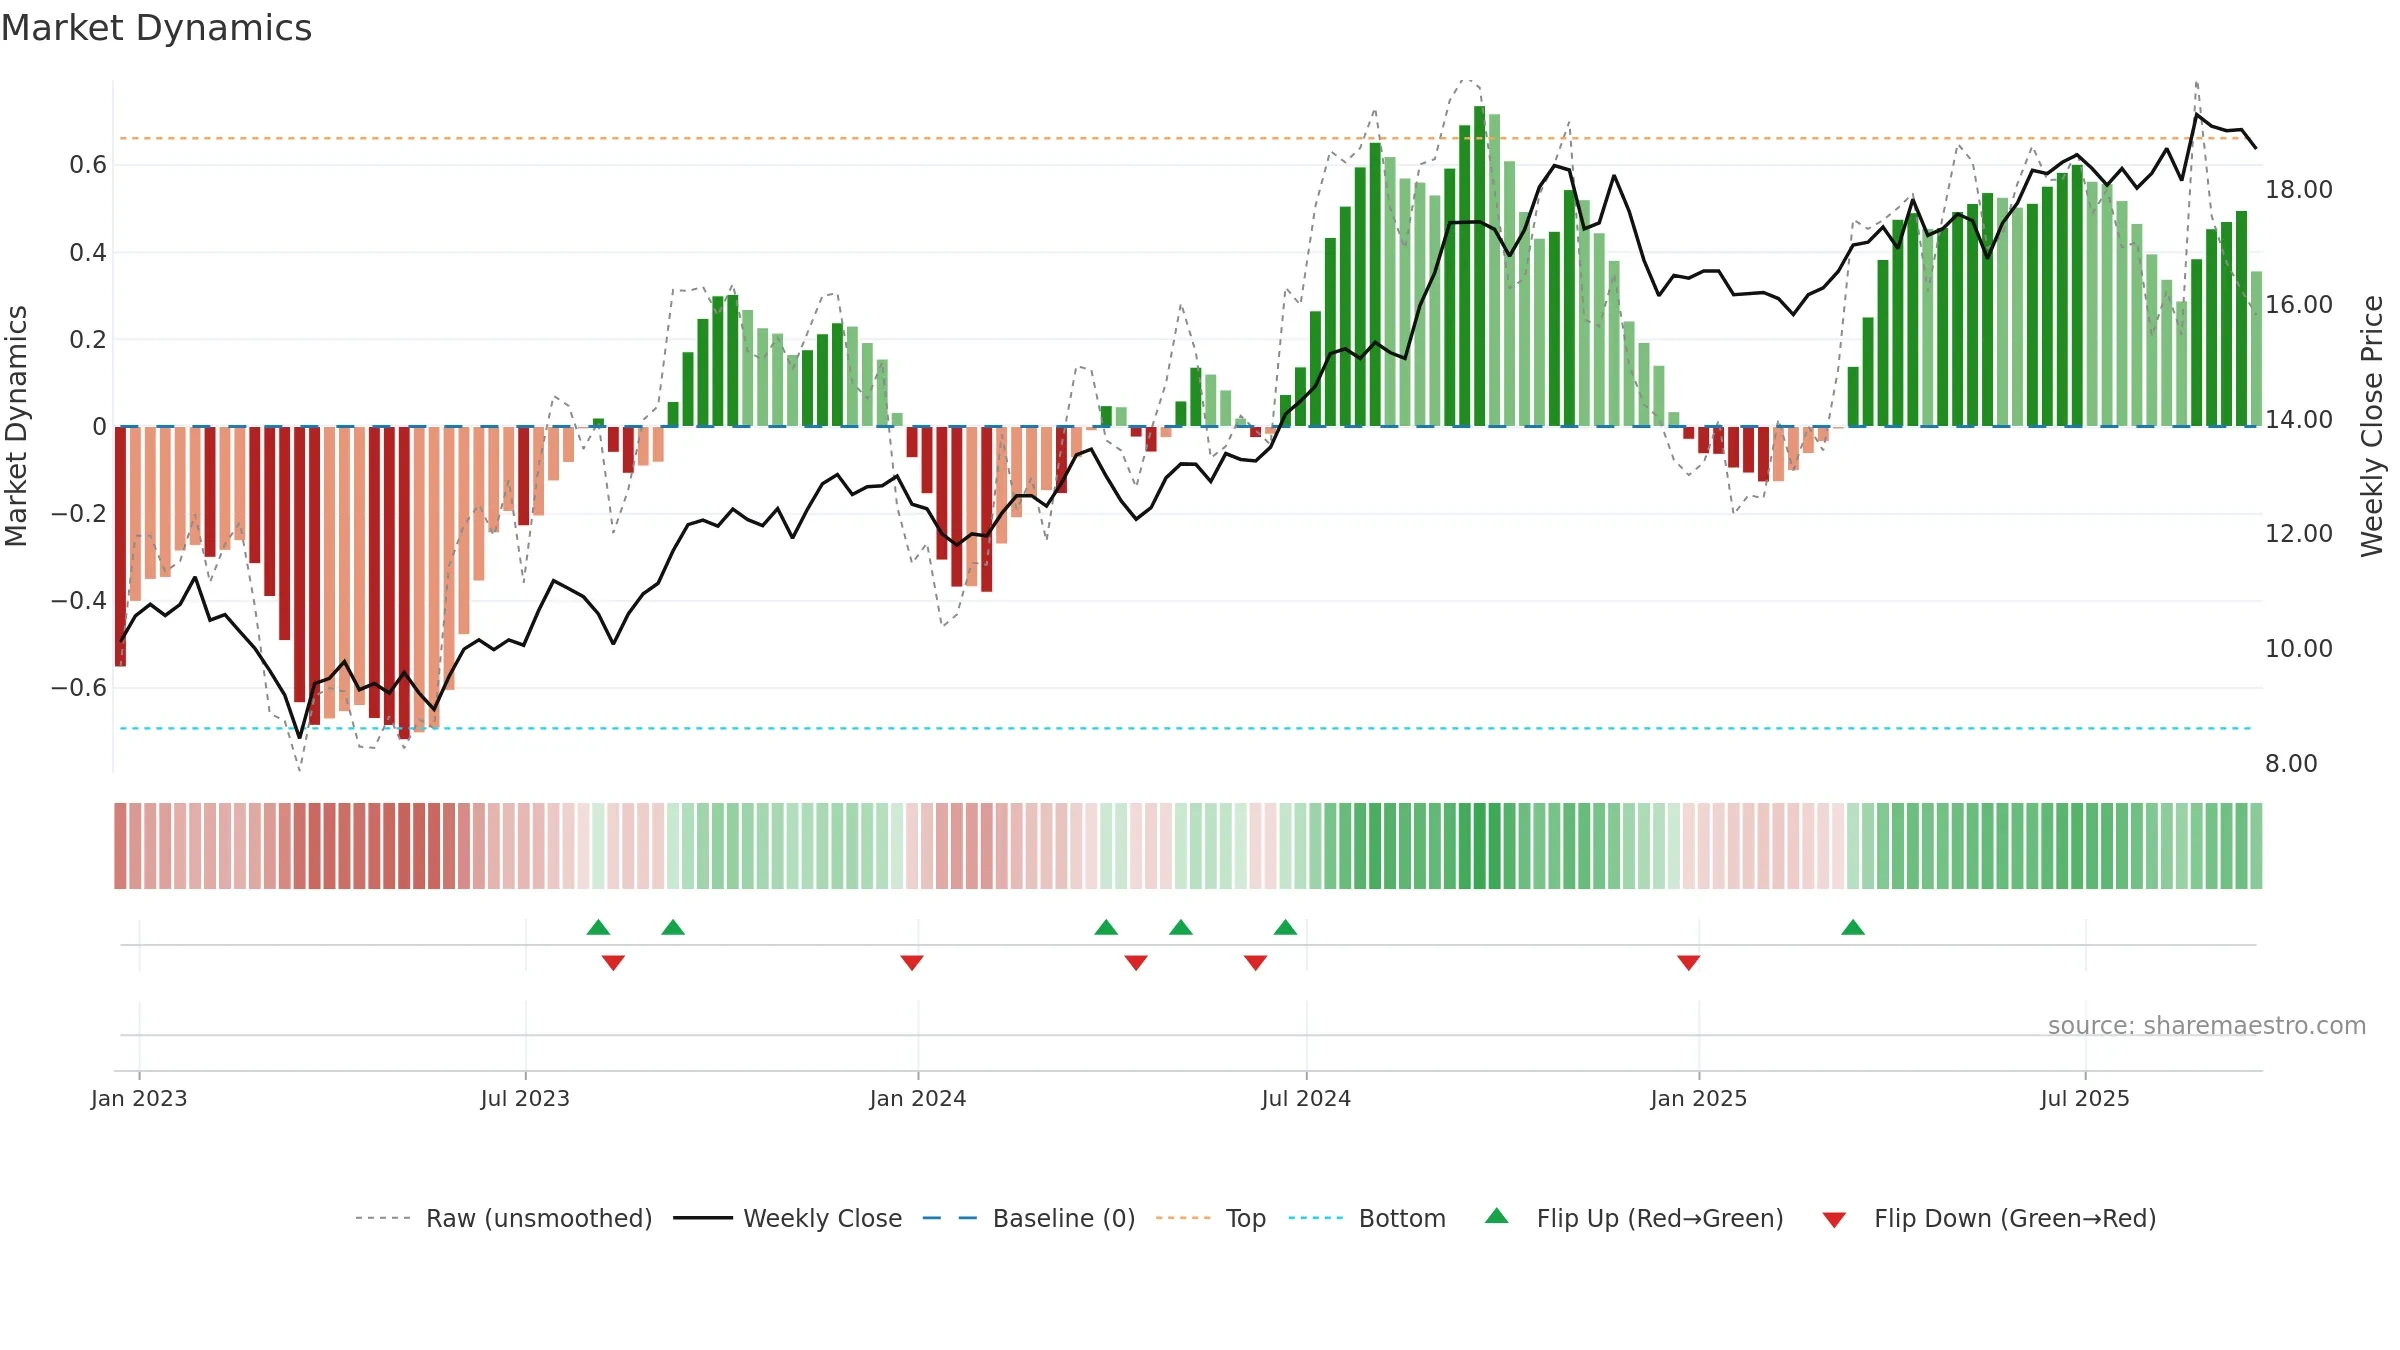
How to read this — Price slope is upward, indicating persistent buying over the window. Low weekly volatility favours steadier follow-through. Volume trend diverges from price — watch for fatigue or rotation. Returns are negatively correlated with volume — strength may come on lighter activity. Distance to baseline is narrowing — reverting closer to its fair-value track. Constructive MA stack supports the up-drift; pullbacks may find support at the 8–13 week region.
Up-slope supports buying interest; pullbacks may be contained if activity stays firm. Because liquidity isn’t confirming, prefer evidence of fresh demand before chasing moves.
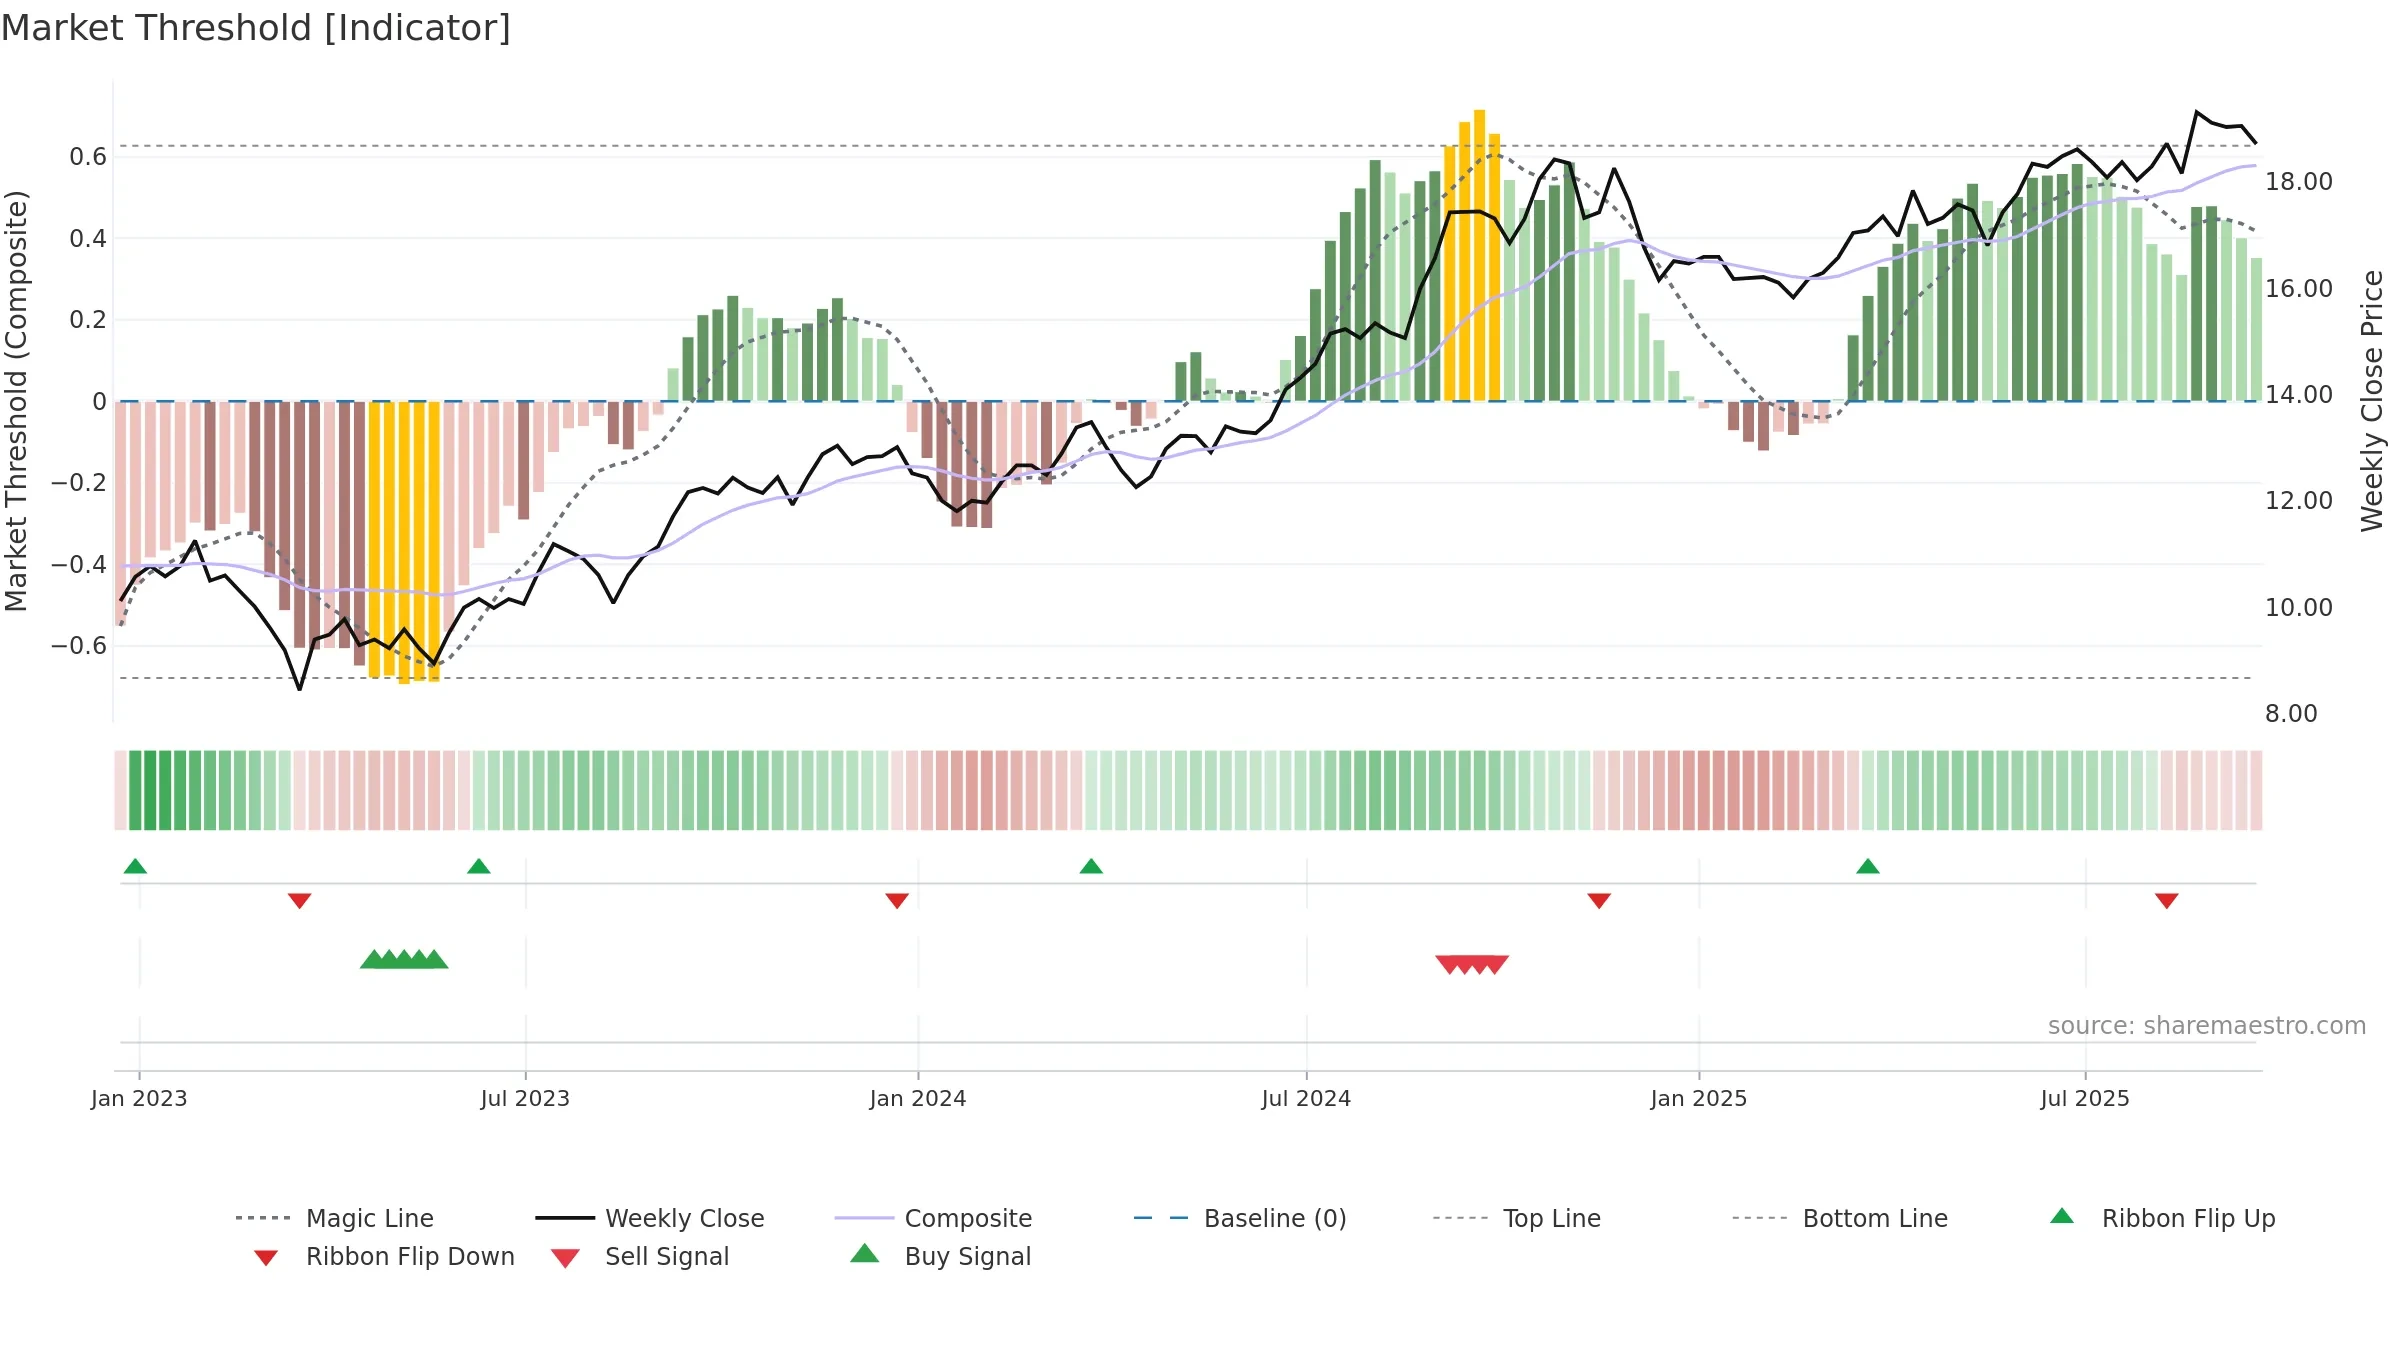
Gauge maps the trend signal to a 0–100 scale.
How to read this — Gauge is elevated but momentum is rolling over; topping risk is rising.
Stay alert: protect gains or seek confirmation before adding risk.

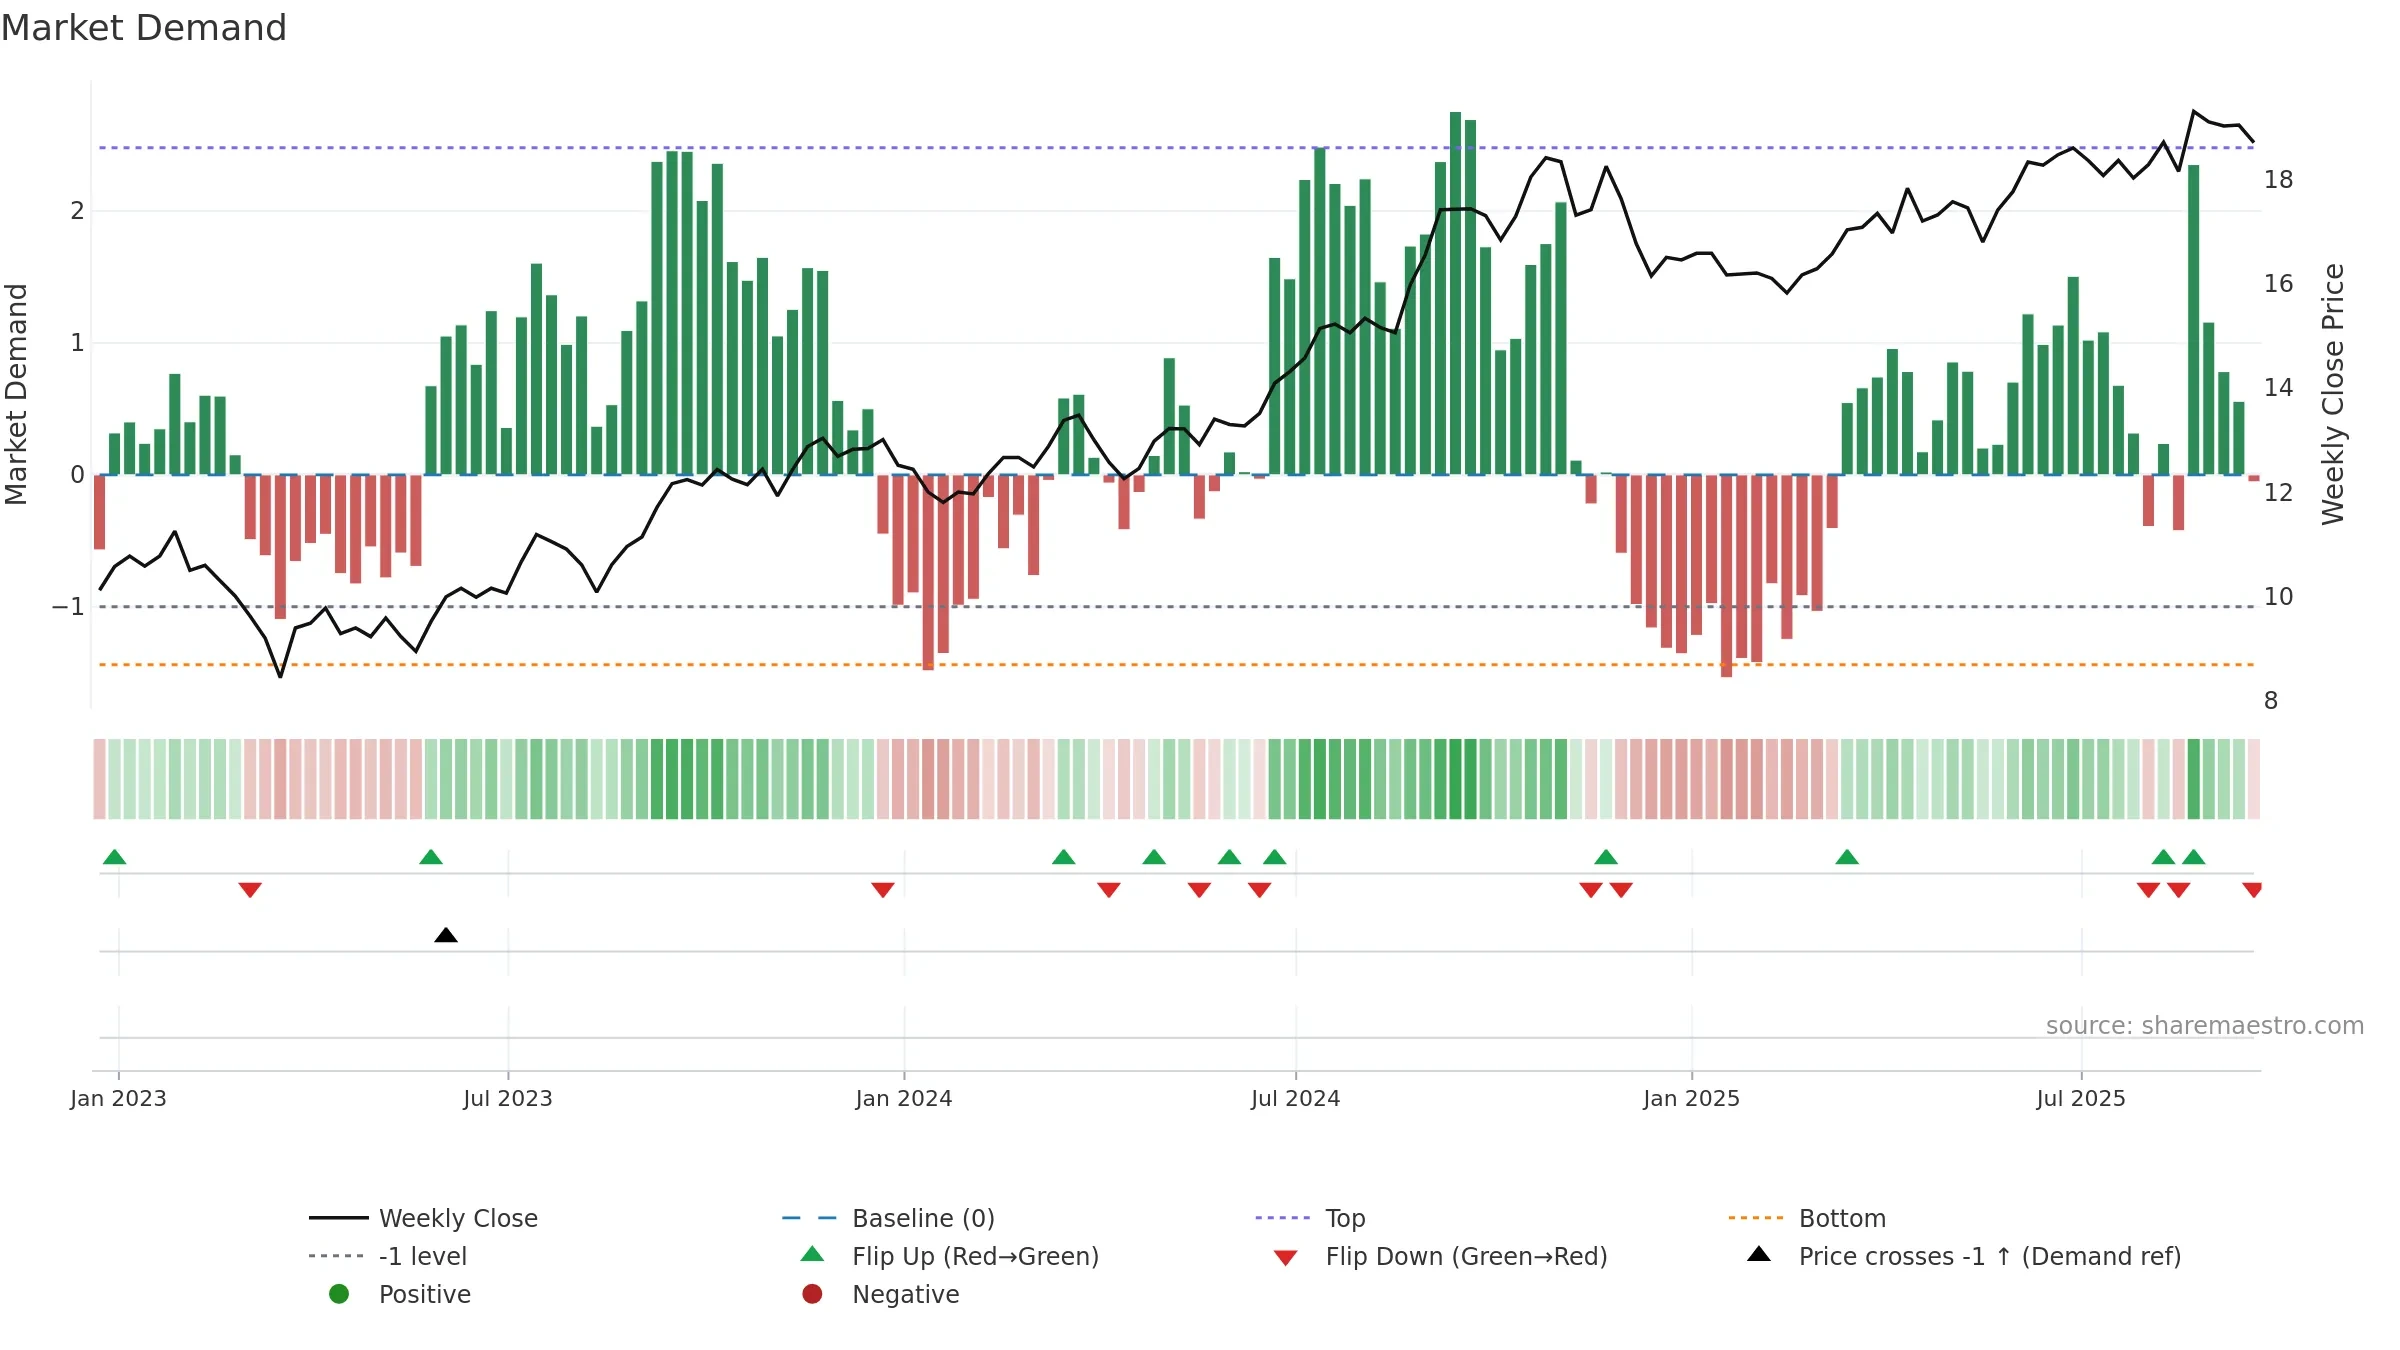
Relative strength is Negative
(< 0%, underperforming).
Latest MRS: -8.23% (week ending Fri, 19 Sep 2025).
Slope: Falling over 8w.
Notes:
- Below zero line indicates relative weakness vs benchmark.
- MRS slope falling over ~8 weeks.
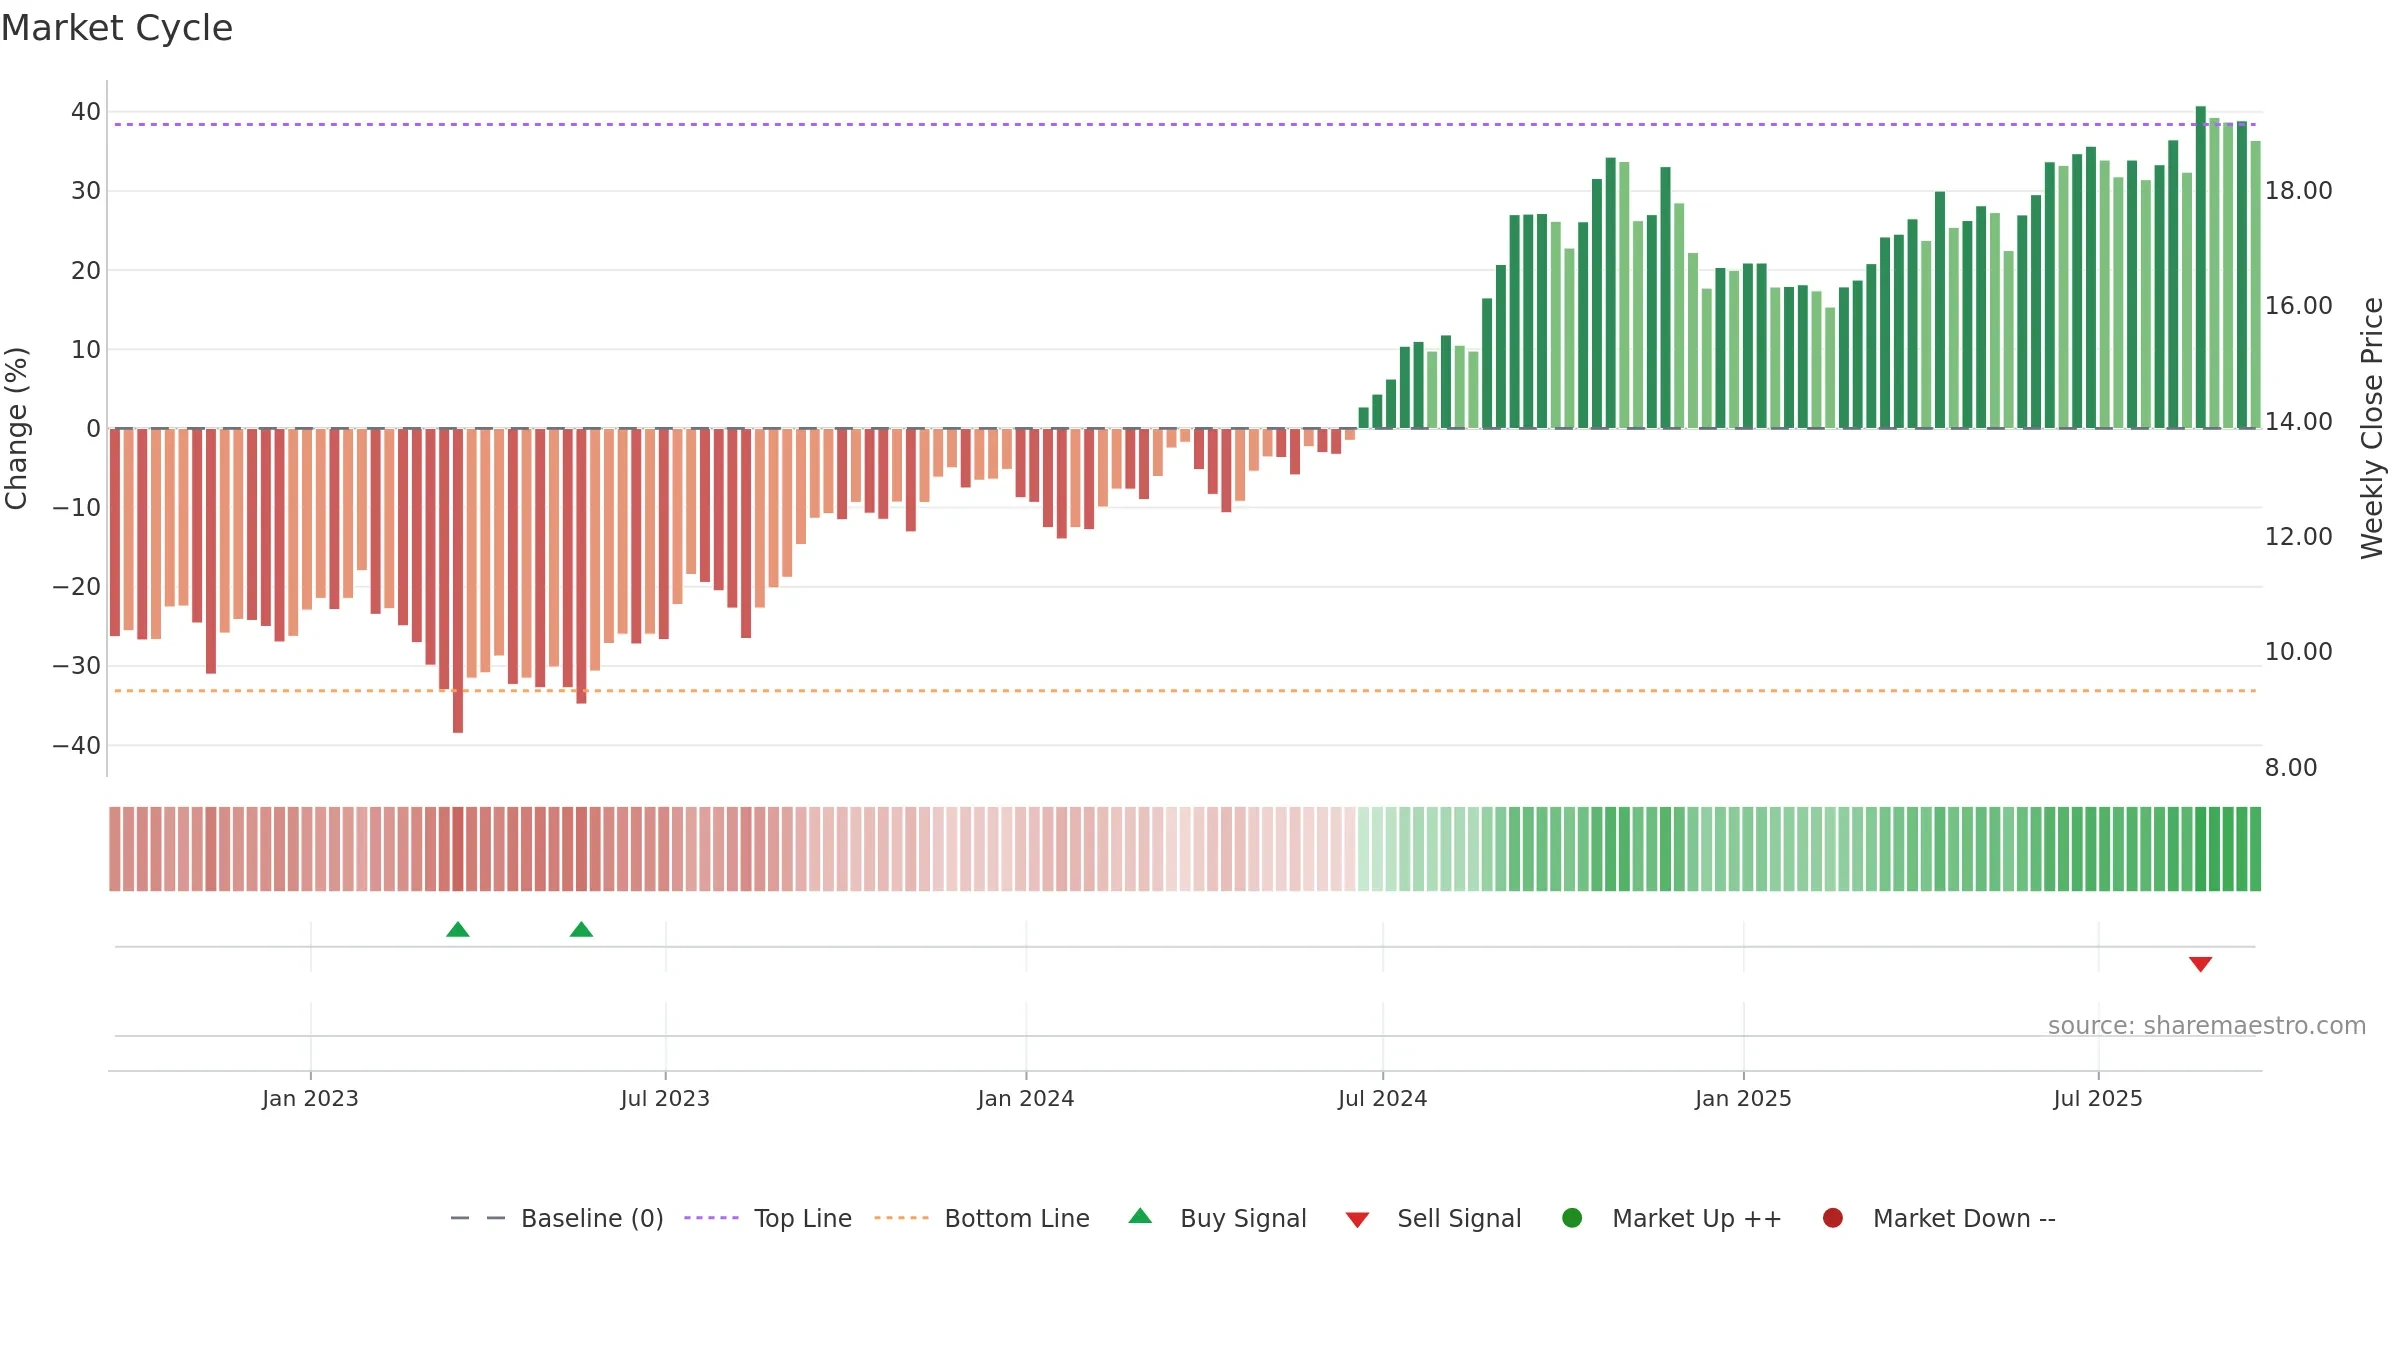
Price is above fair value; upside may be capped without catalysts.
Conclusion
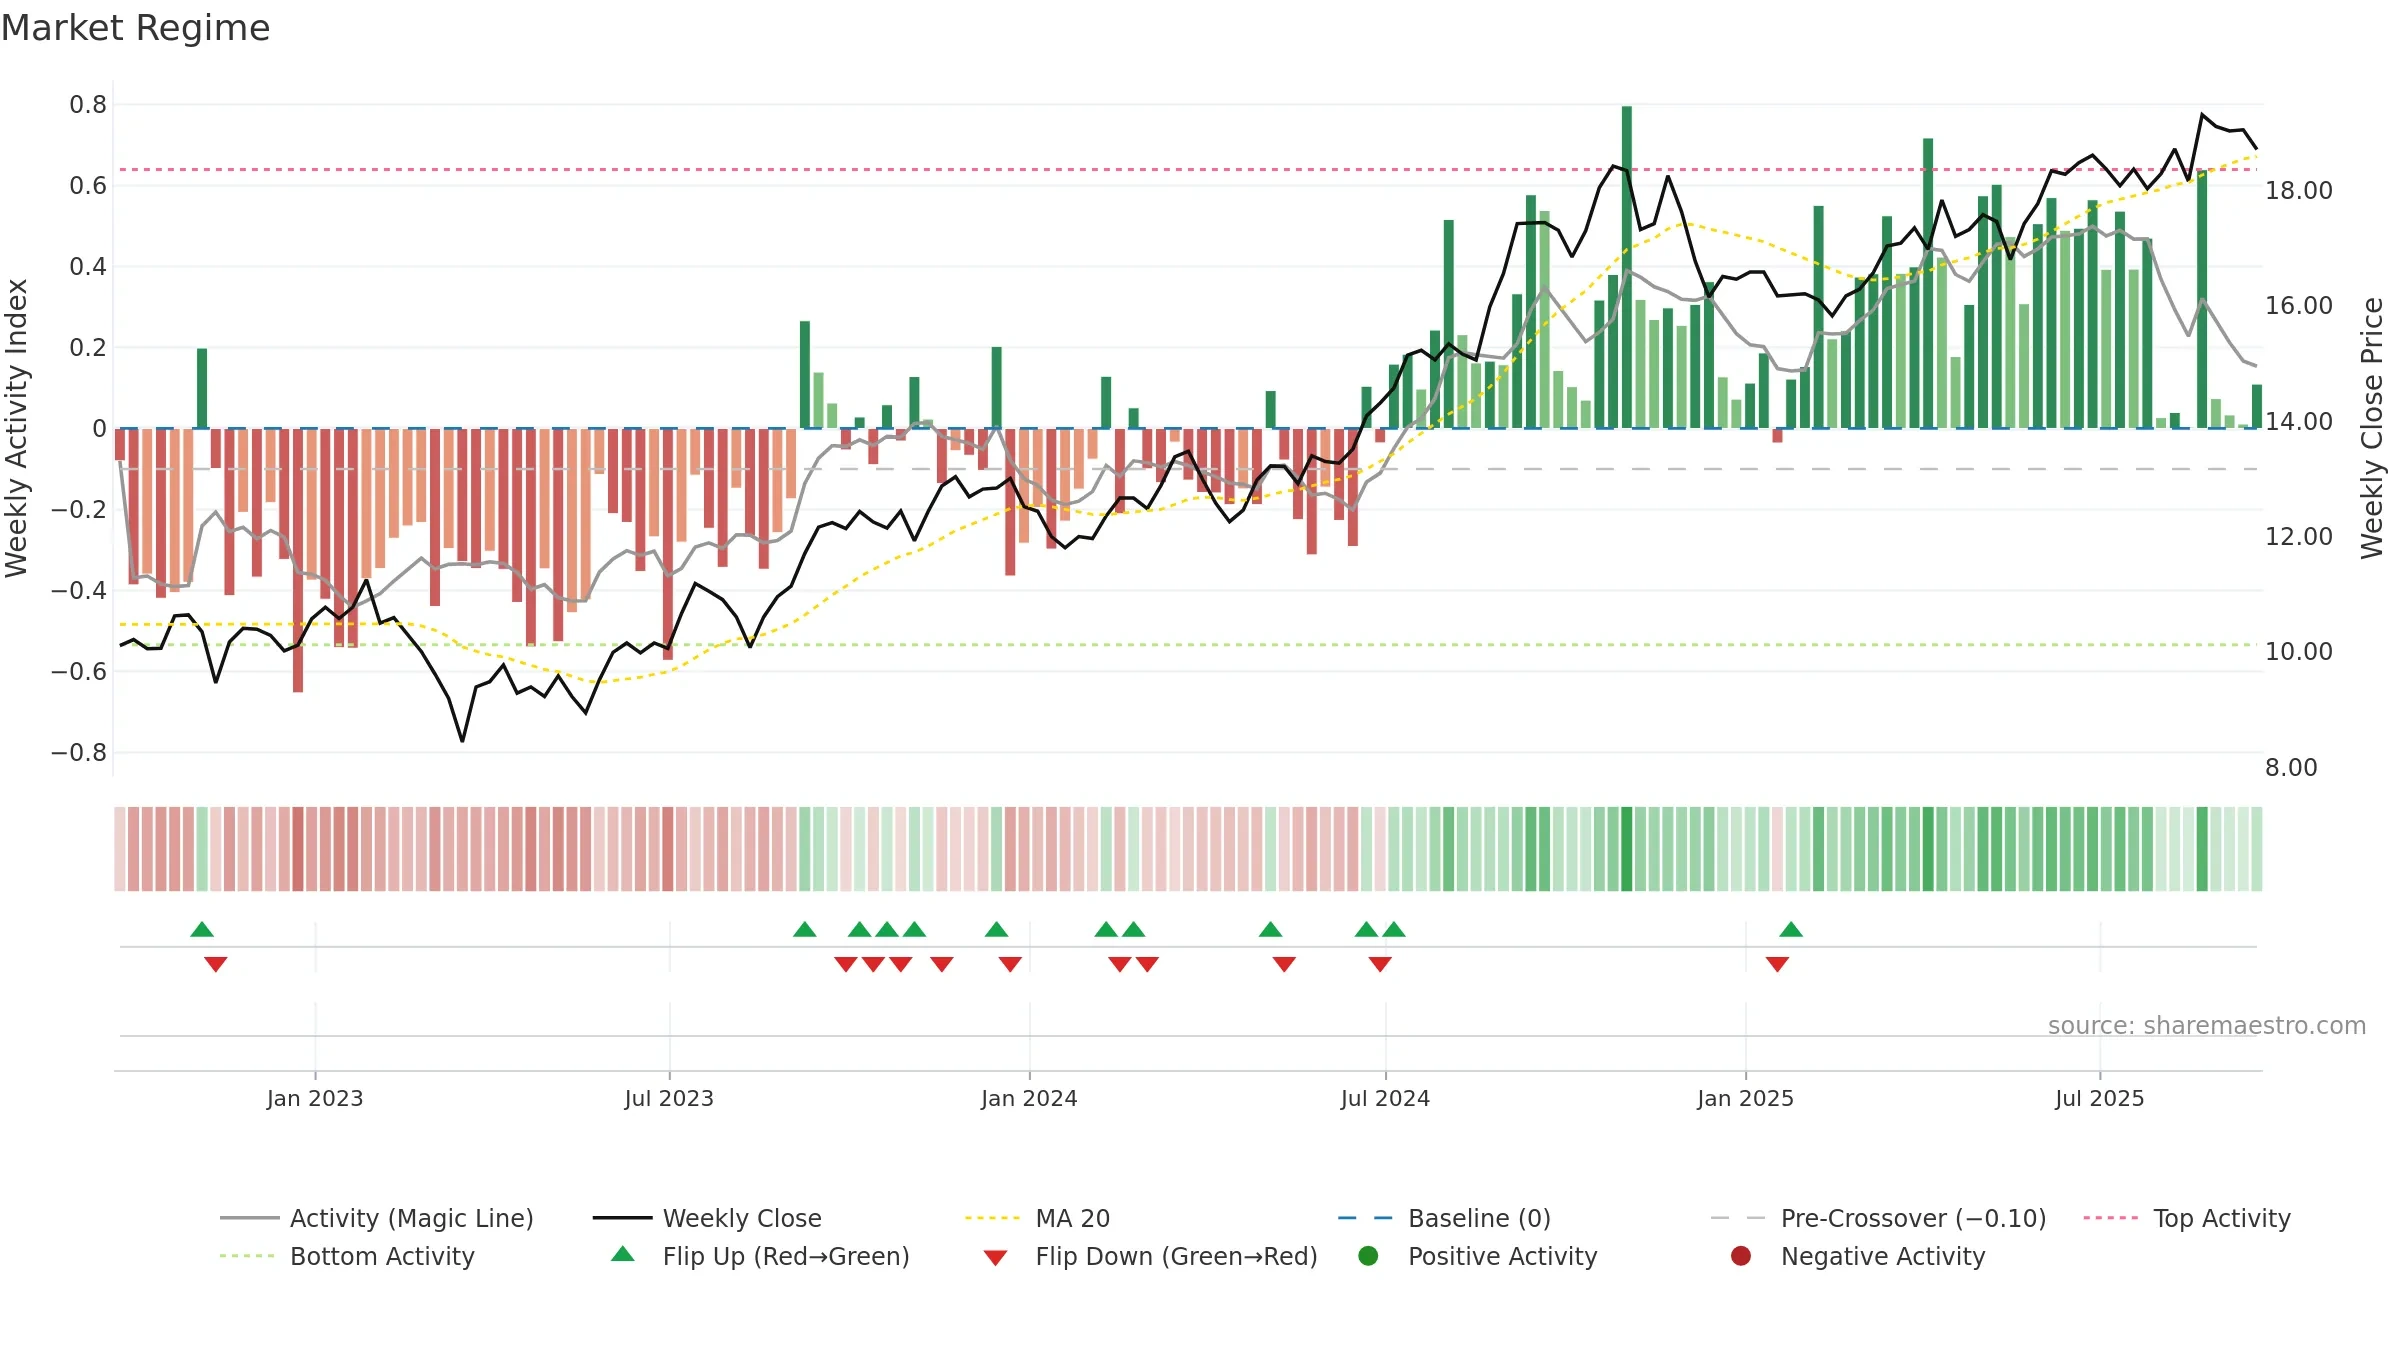
Negative setup. ★★☆☆☆ confidence. Trend: Uptrend at Risk · 2.30% over window · vol 1.02% · liquidity divergence · posture mixed · RS weak
- Constructive moving-average stack
- Low return volatility supports durability
- High level but momentum rolling over (topping risk)
- Momentum is weak/falling
- Price is not above key averages
- Liquidity diverges from price
Why: Price window 2.30% over w. Close is -3.11% below the prior-window high. Return volatility 1.02%. Volume trend falling. Liquidity divergence with price. Trend state uptrend at risk. MA stack constructive. Momentum bullish and falling. Valuation limited upside without catalysts.
Tip: Most metrics include a hover tooltip where they appear in the report.