Sanginita Chemicals Limited
SANGINITA NSE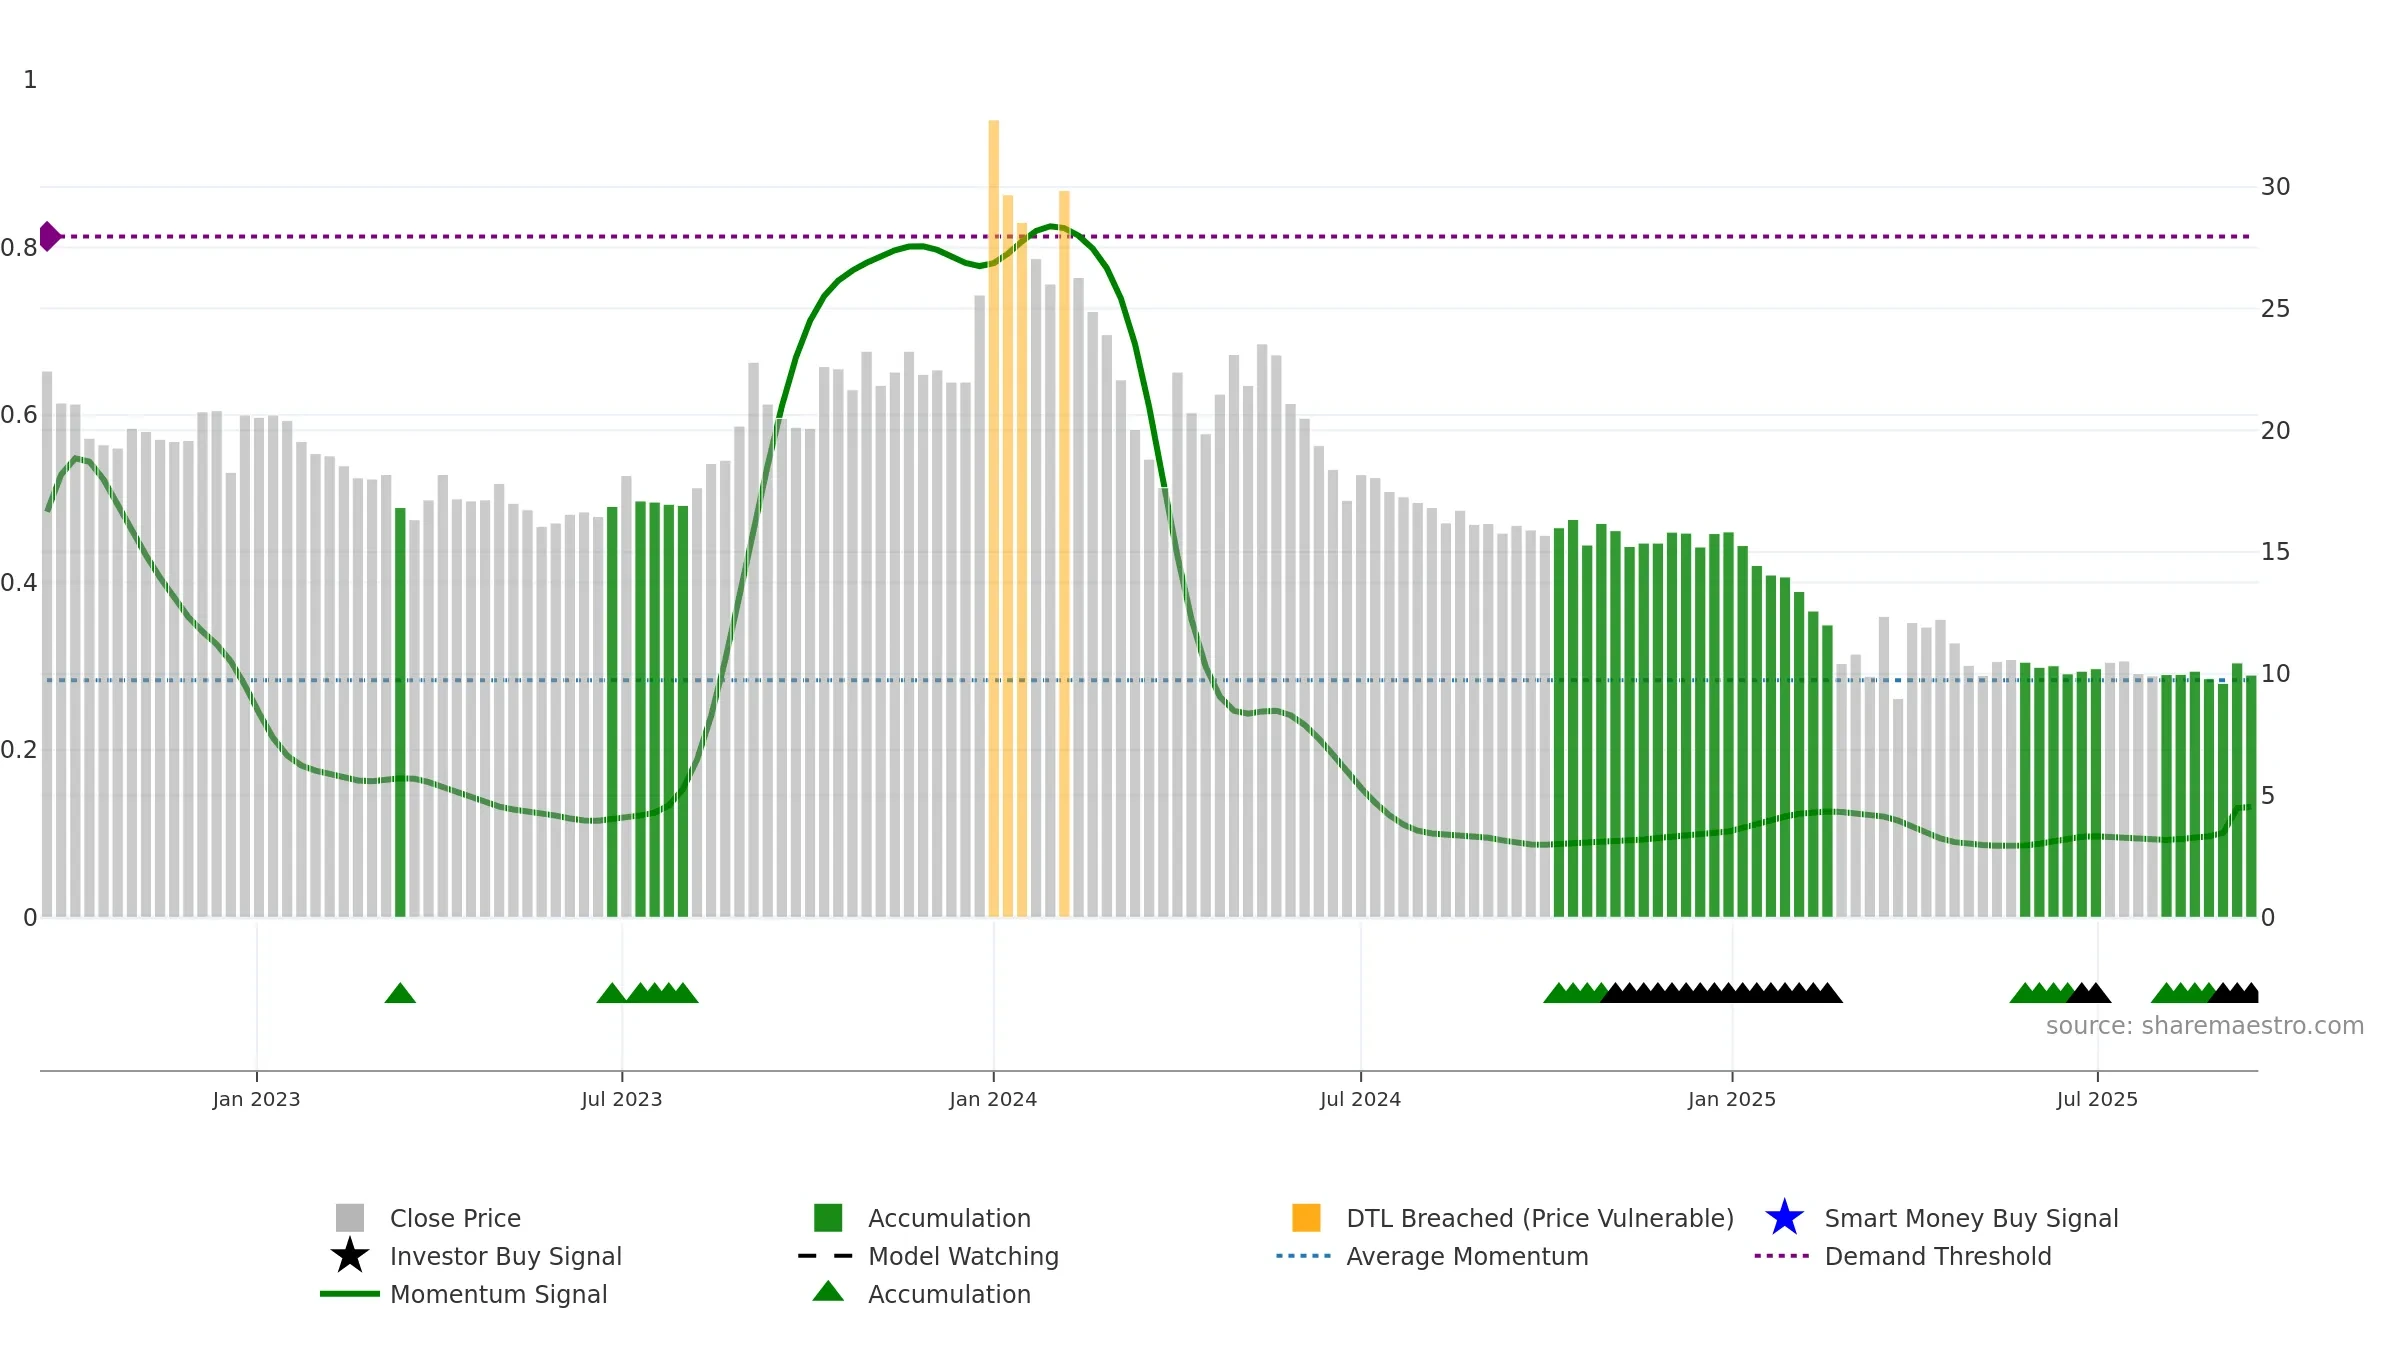
Weekly Report
Sanginita Chemicals Limited closed at 9.9500 (-5.15% WoW) . Data window ends Mon, 15 Sep 2025.
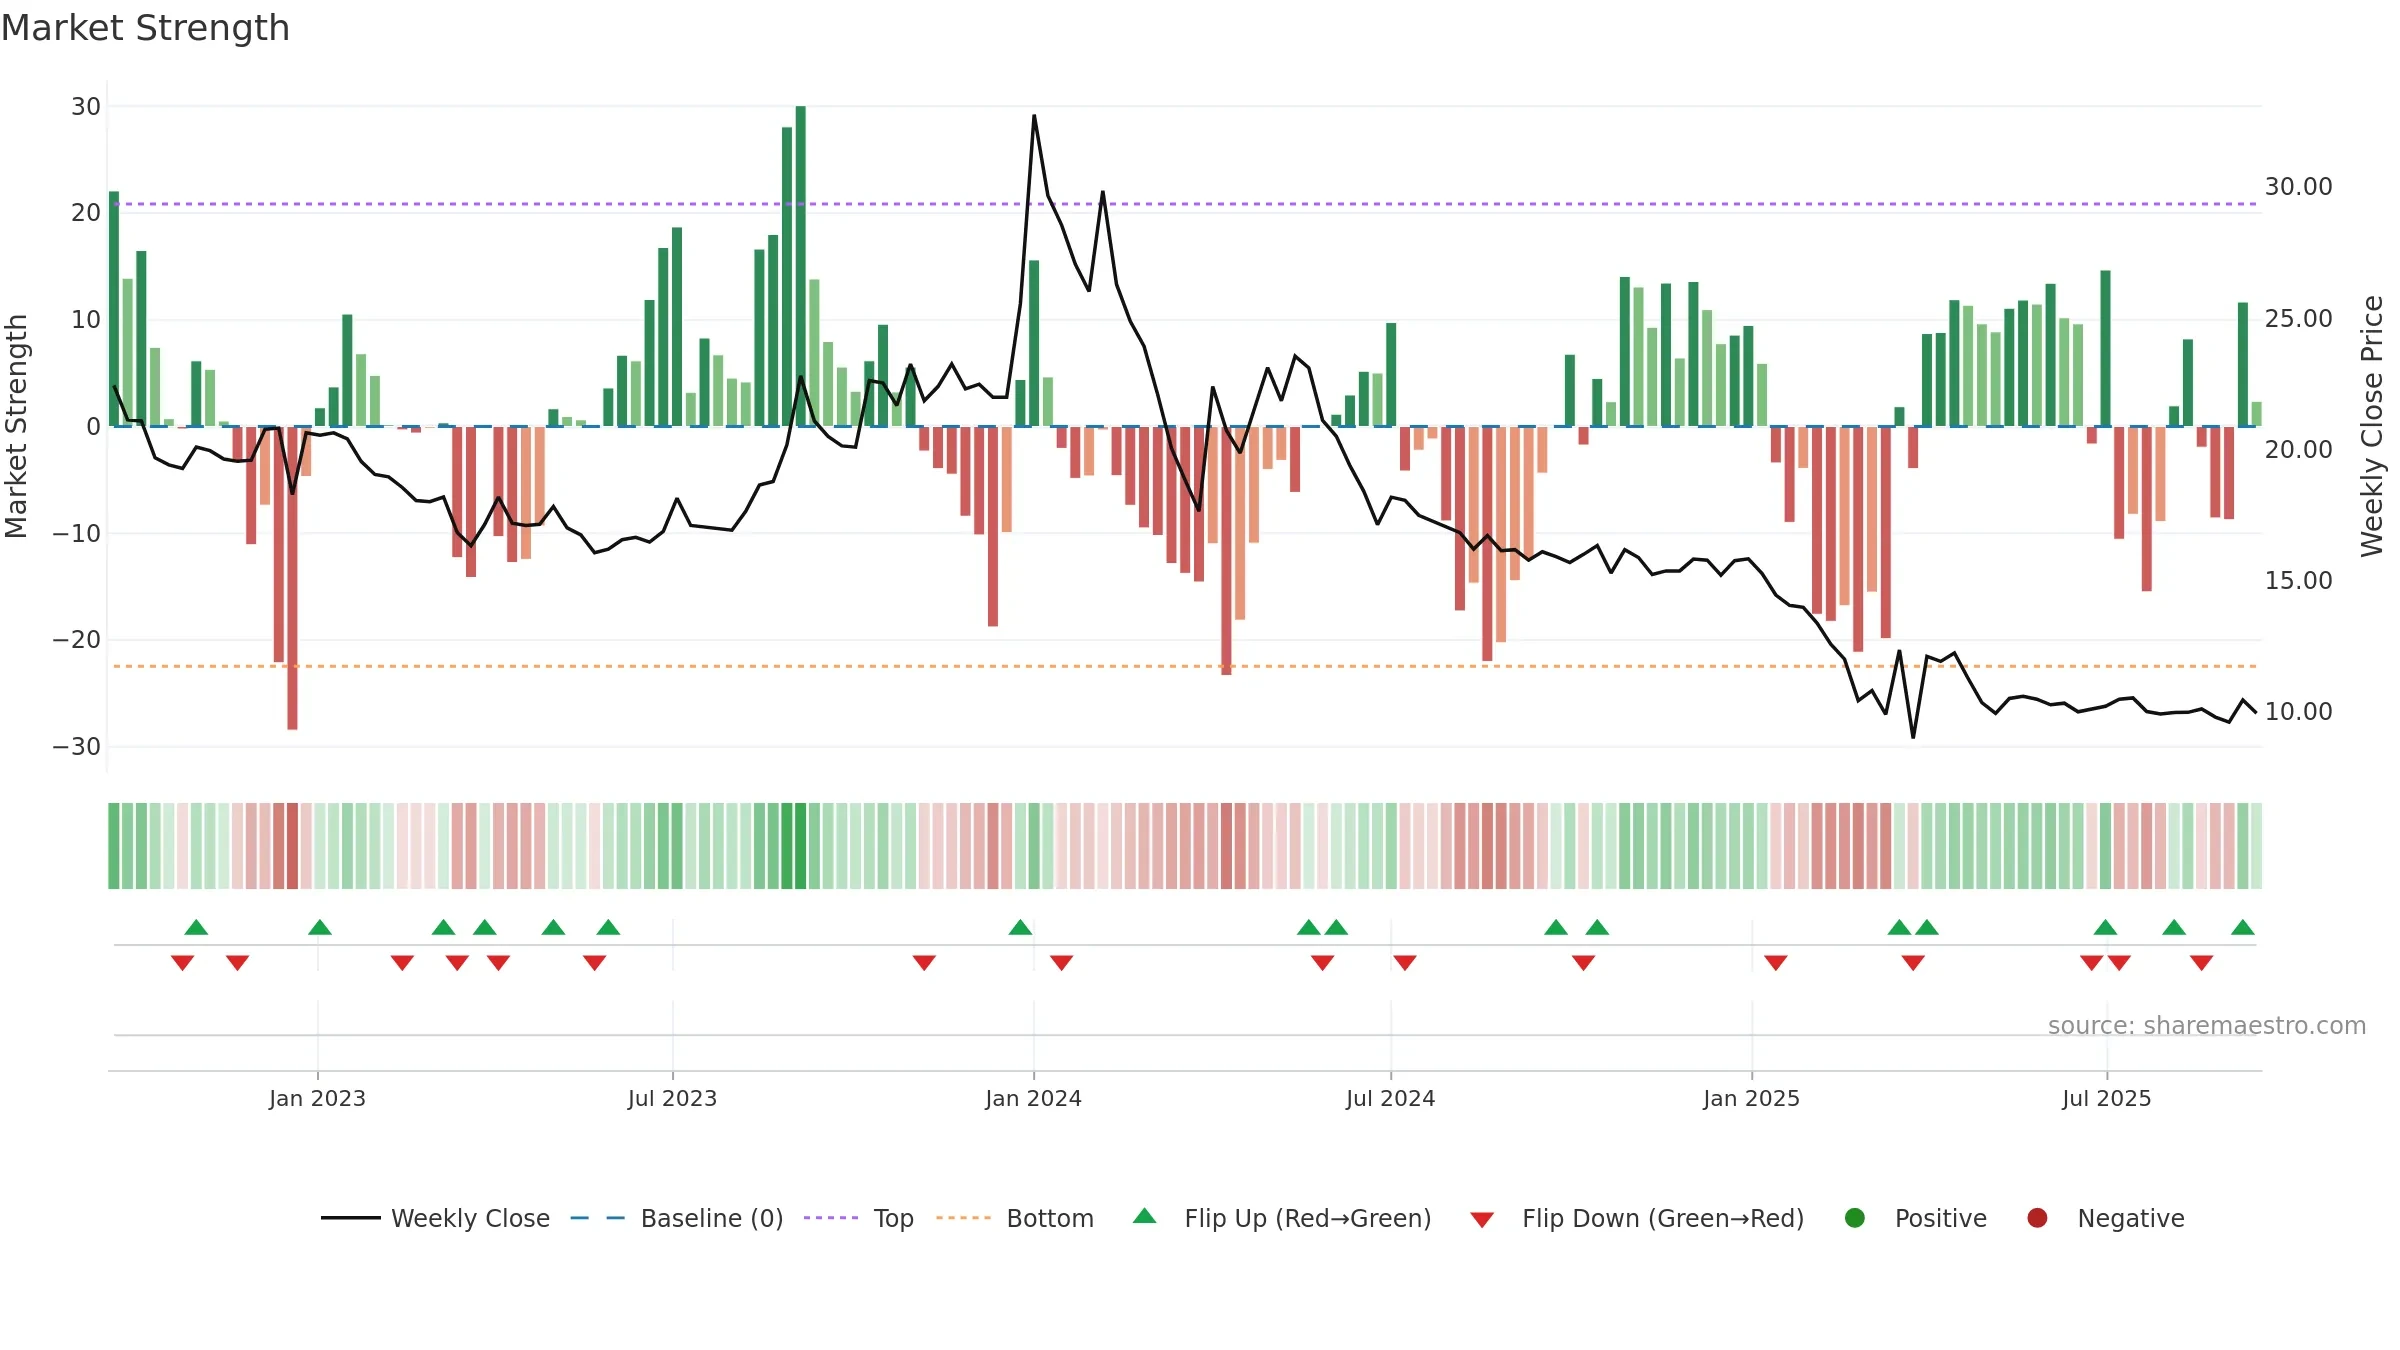
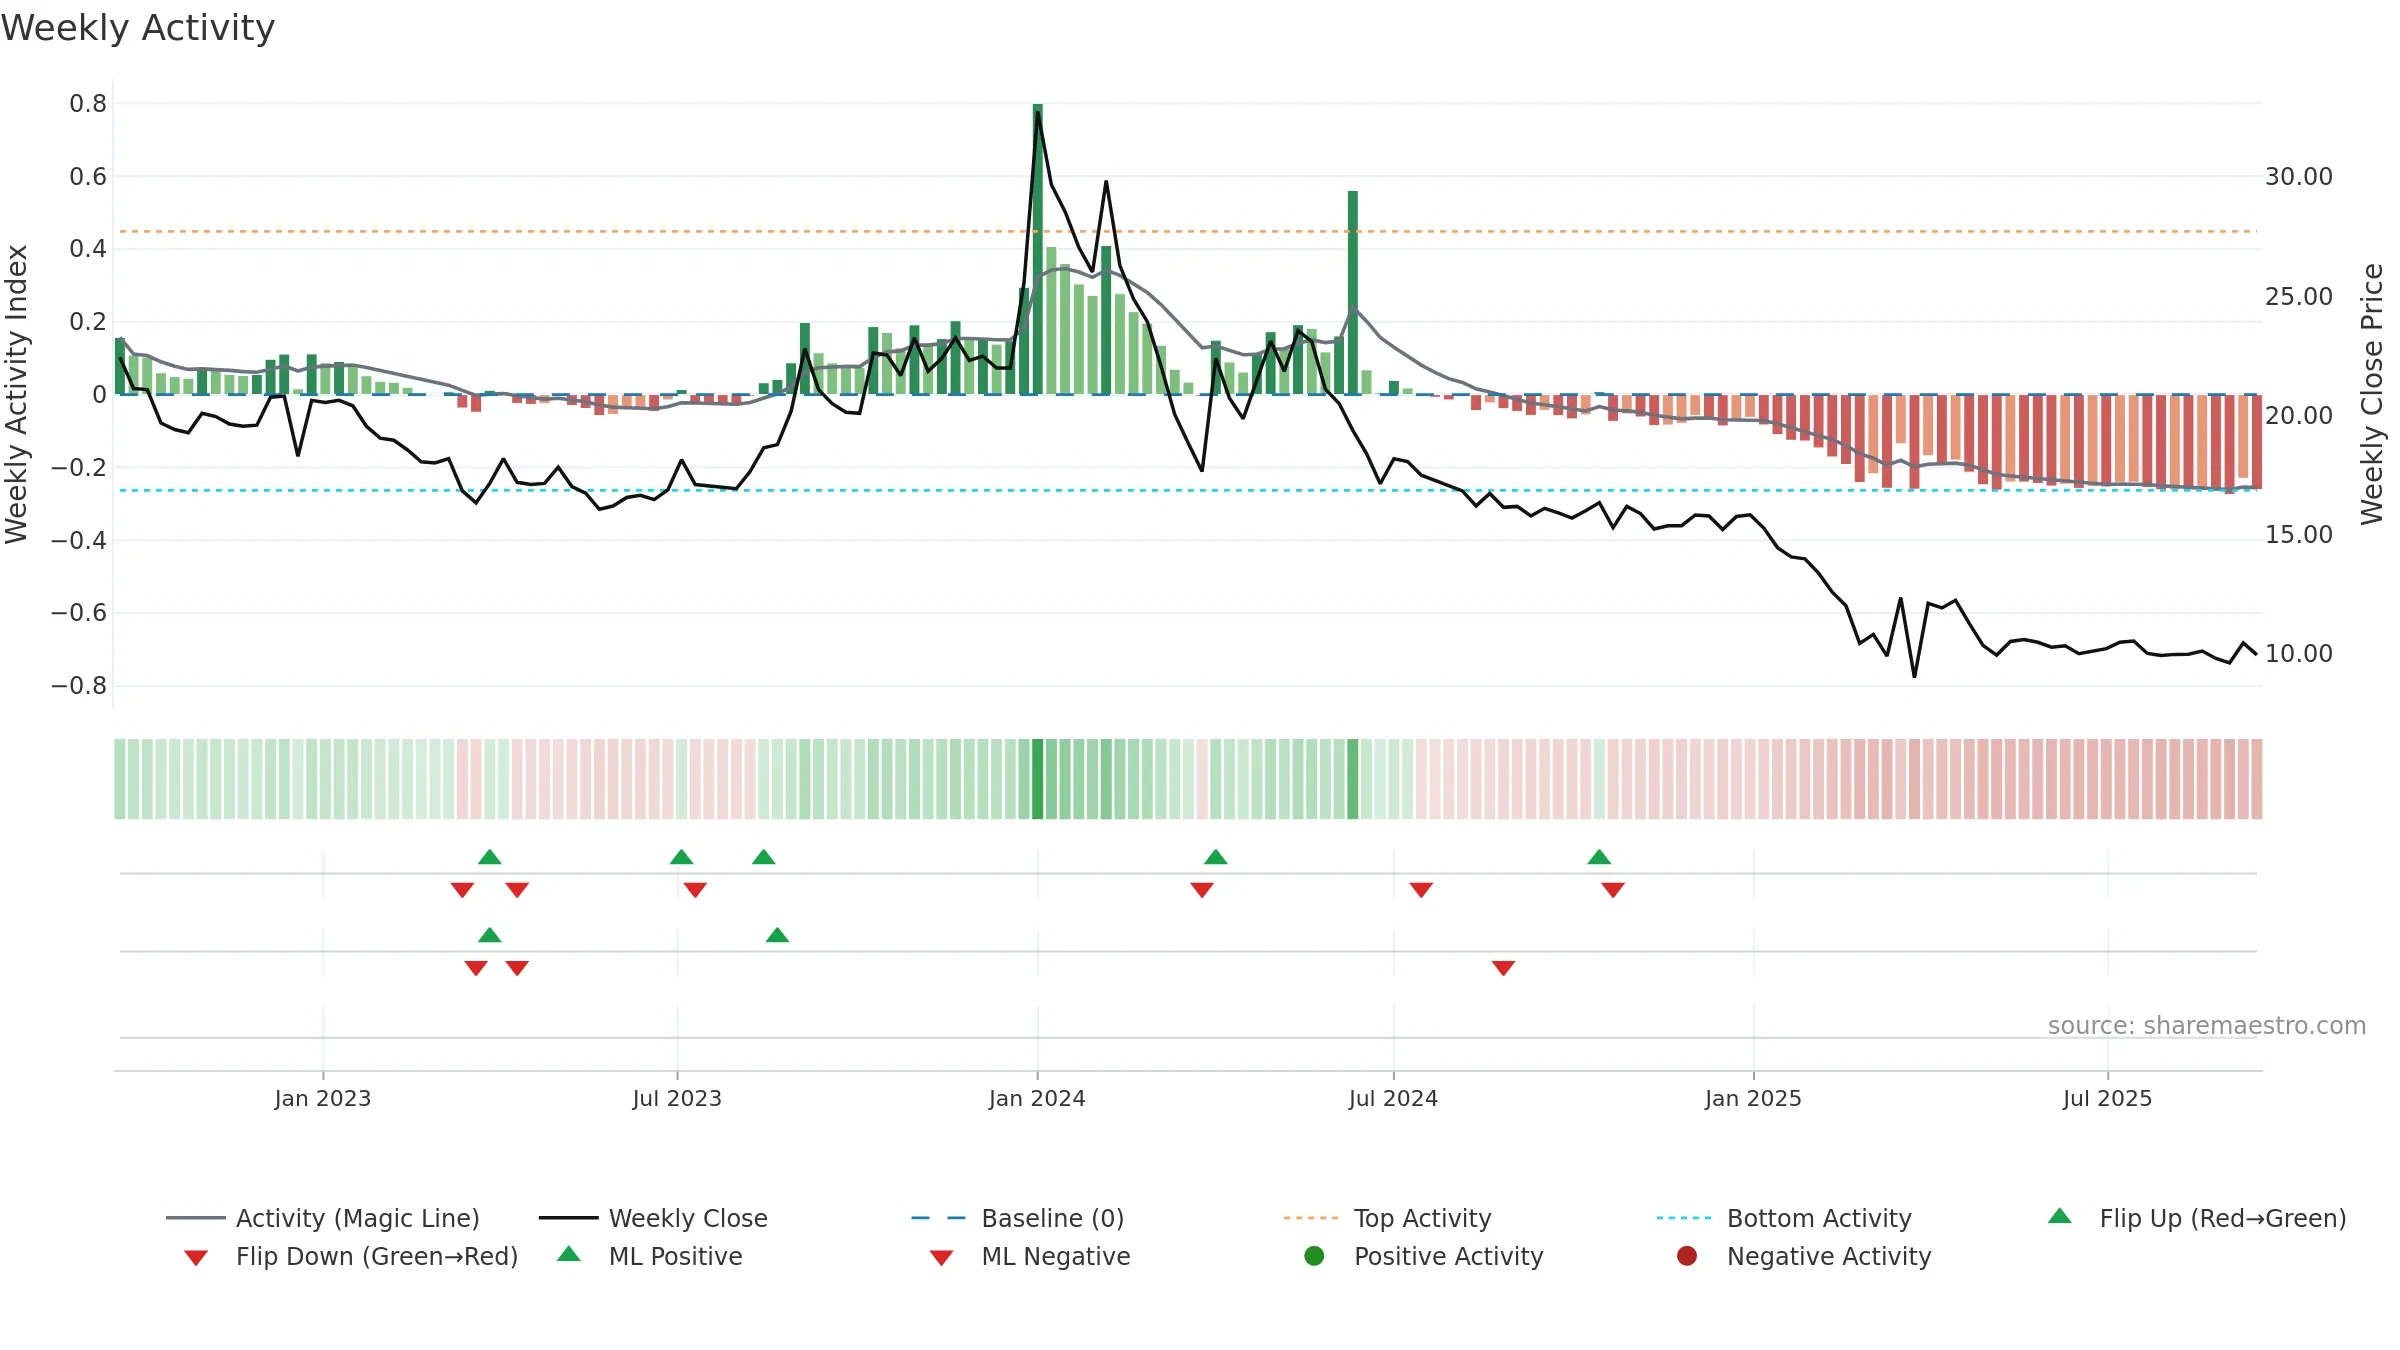
How to read this — Price slope is upward, indicating persistent buying over the window. Volume and price are moving in the same direction — a constructive confirmation. Returns are positively correlated with volume — strength tends to arrive on higher activity. Weak MA stack argues for caution; rallies can fail near the 8–13 week region. Fresh short-term downside crossover weakens near-term tone. Price sits below key averages, keeping pressure on the tape.
Up-slope supports buying interest; pullbacks may be contained if activity stays firm.
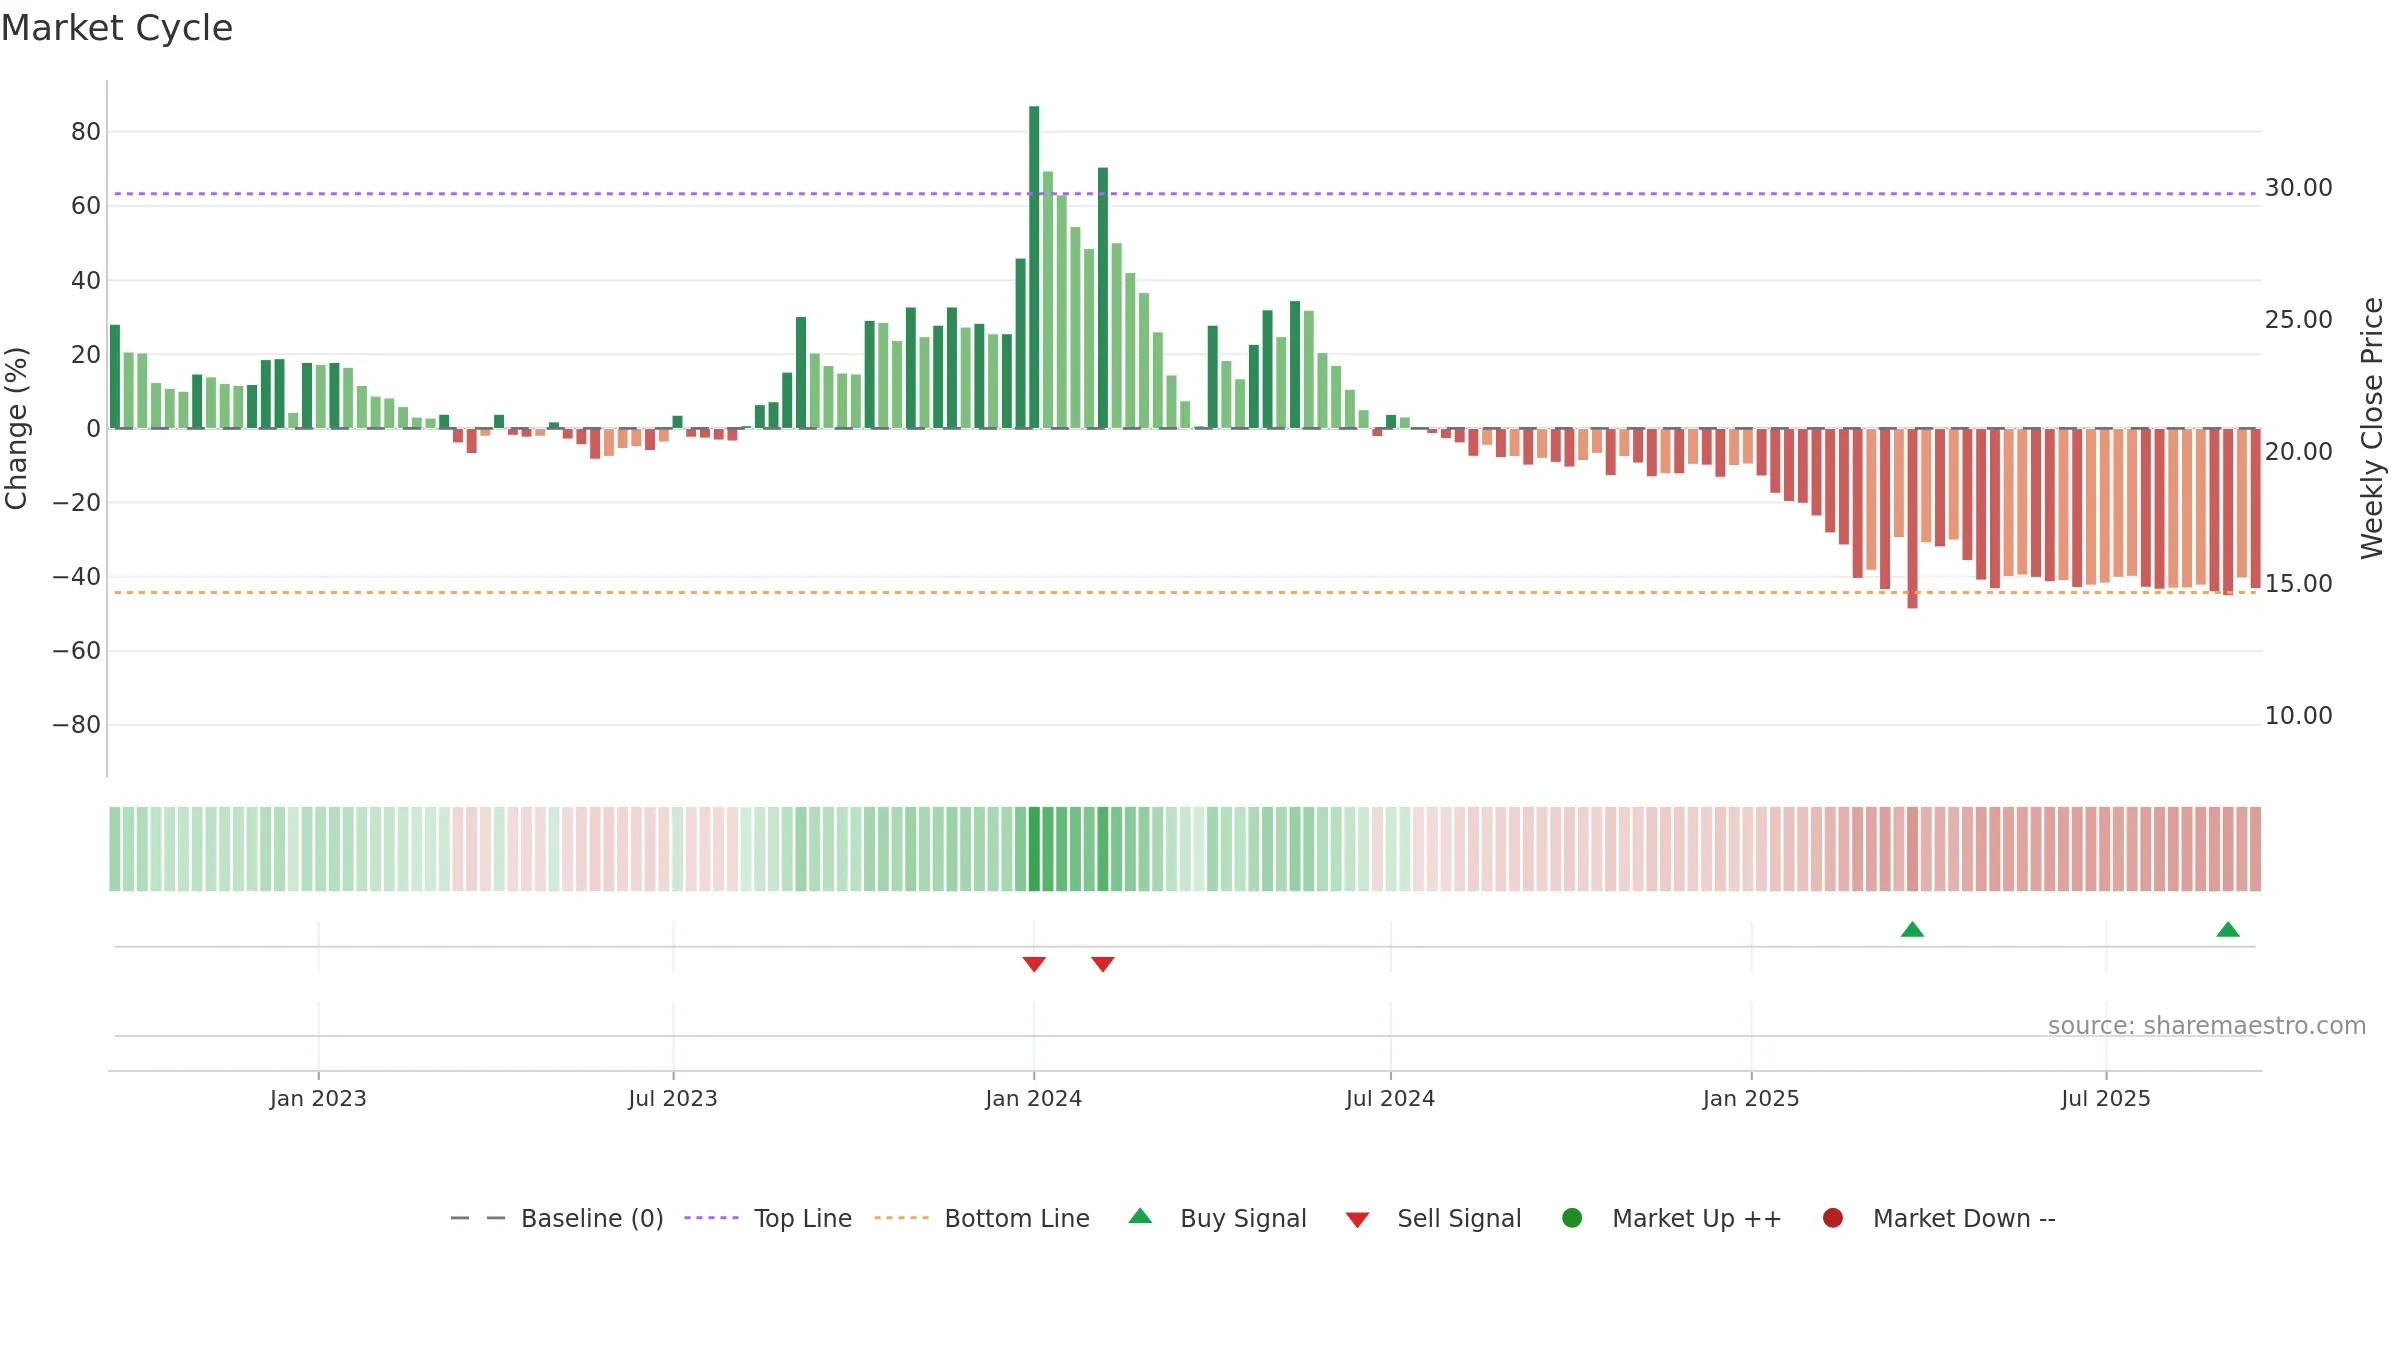
Gauge maps the trend signal to a 0–100 scale.
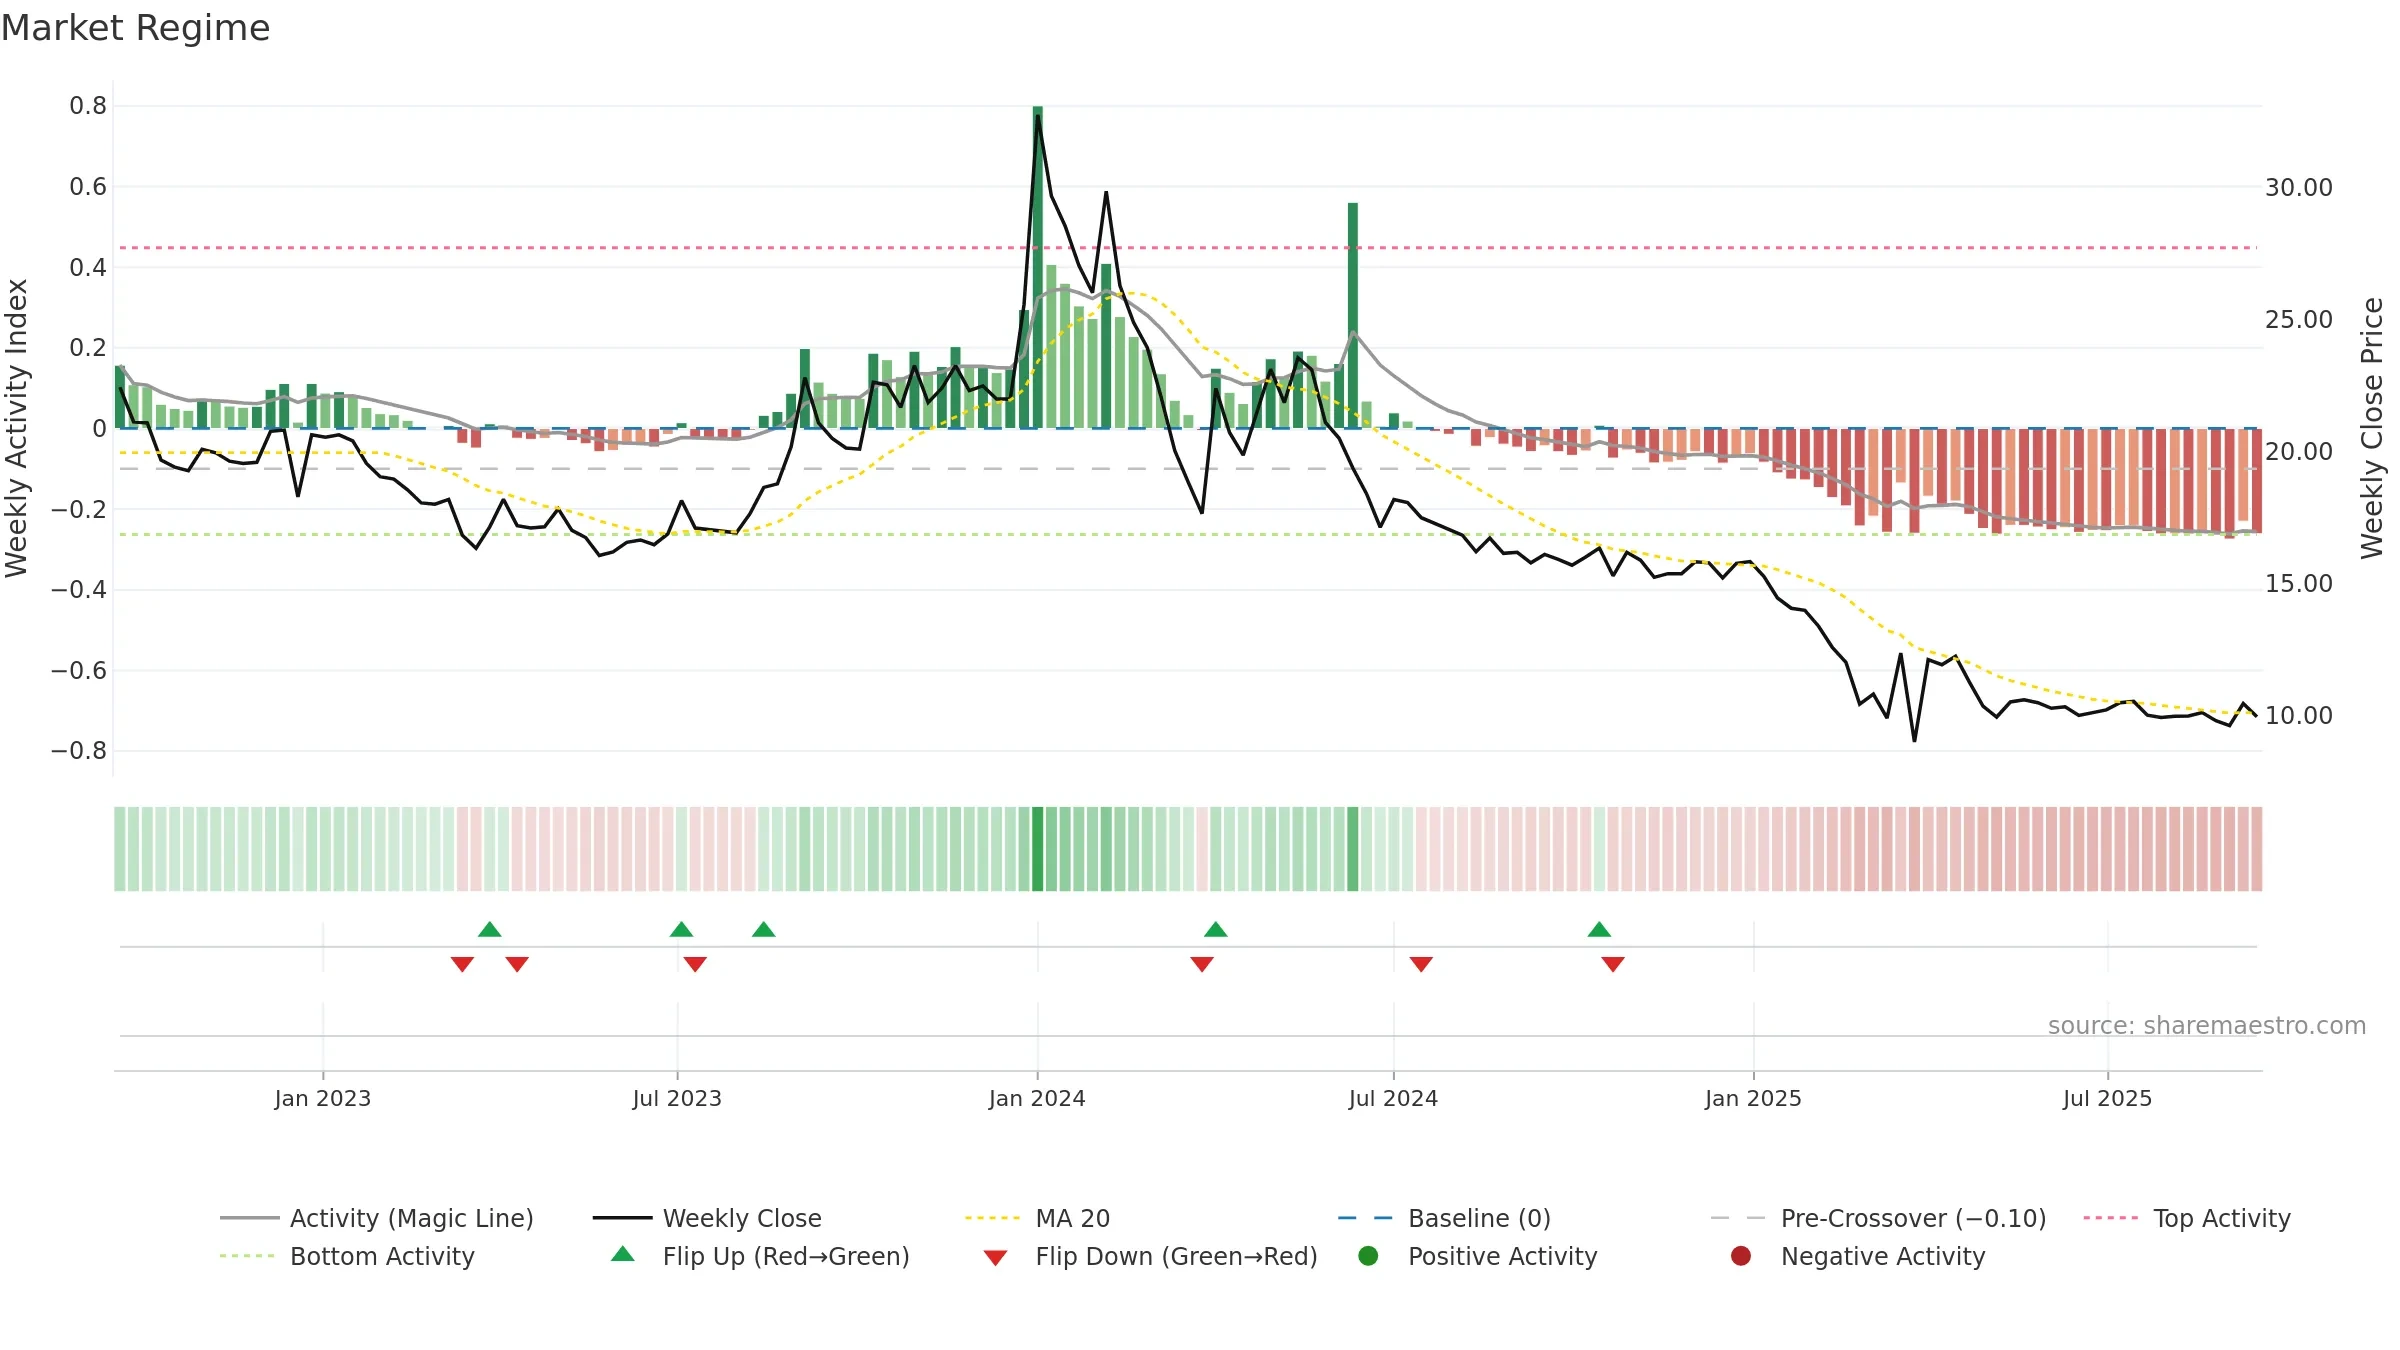
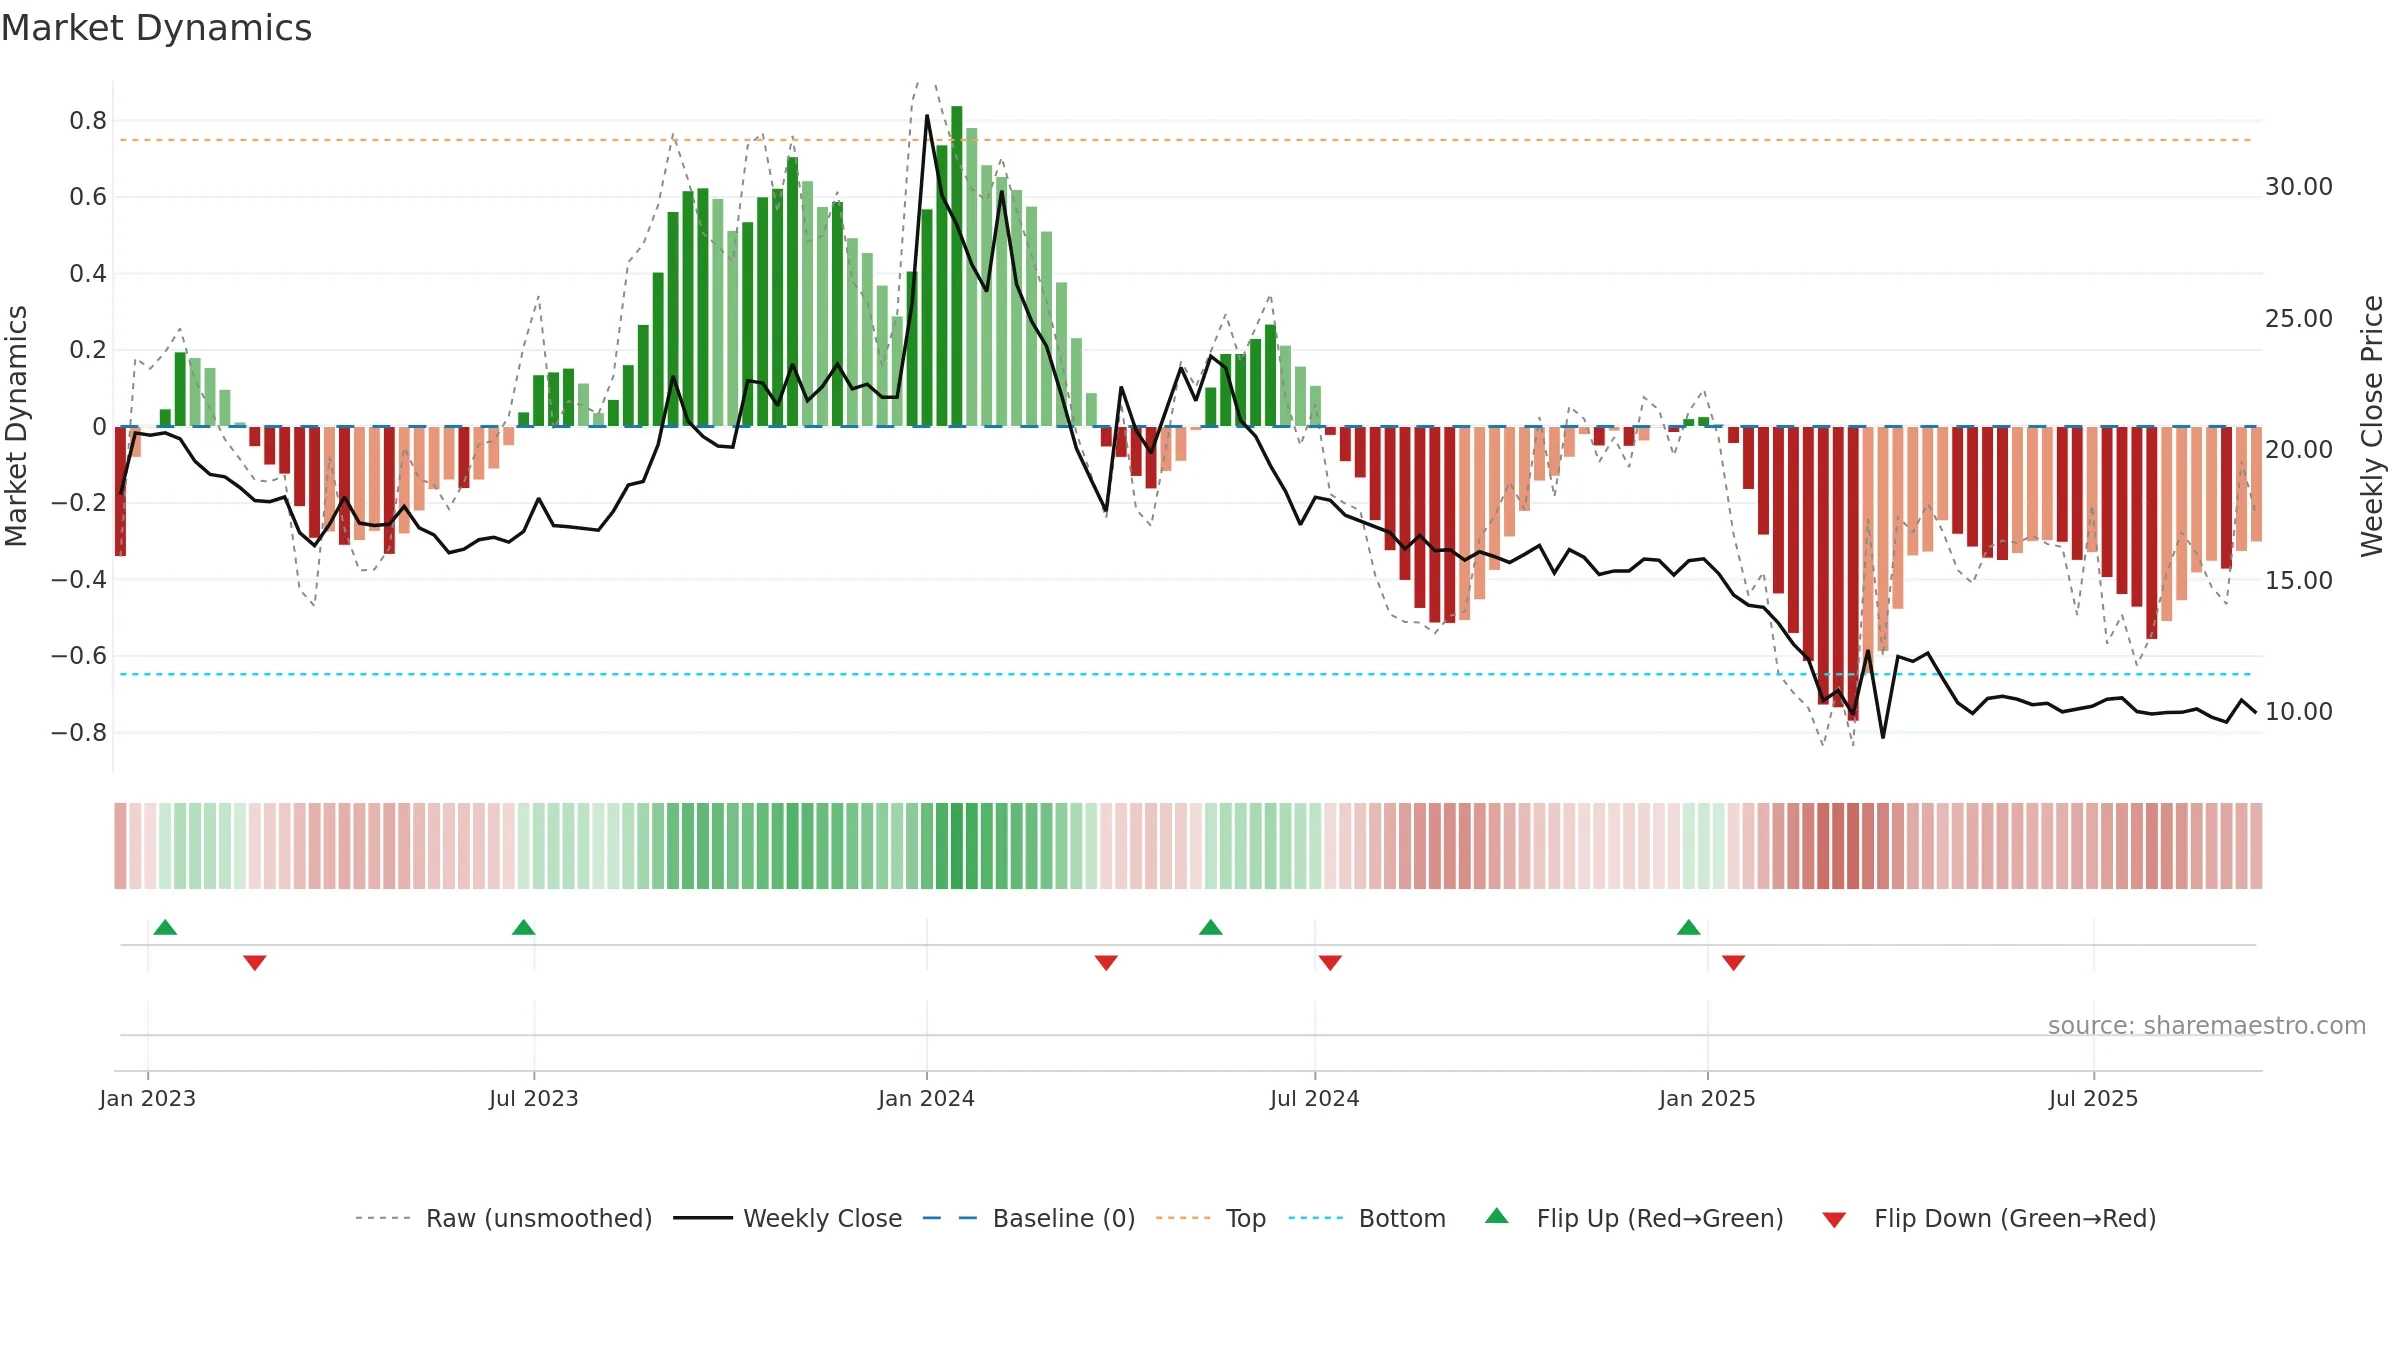
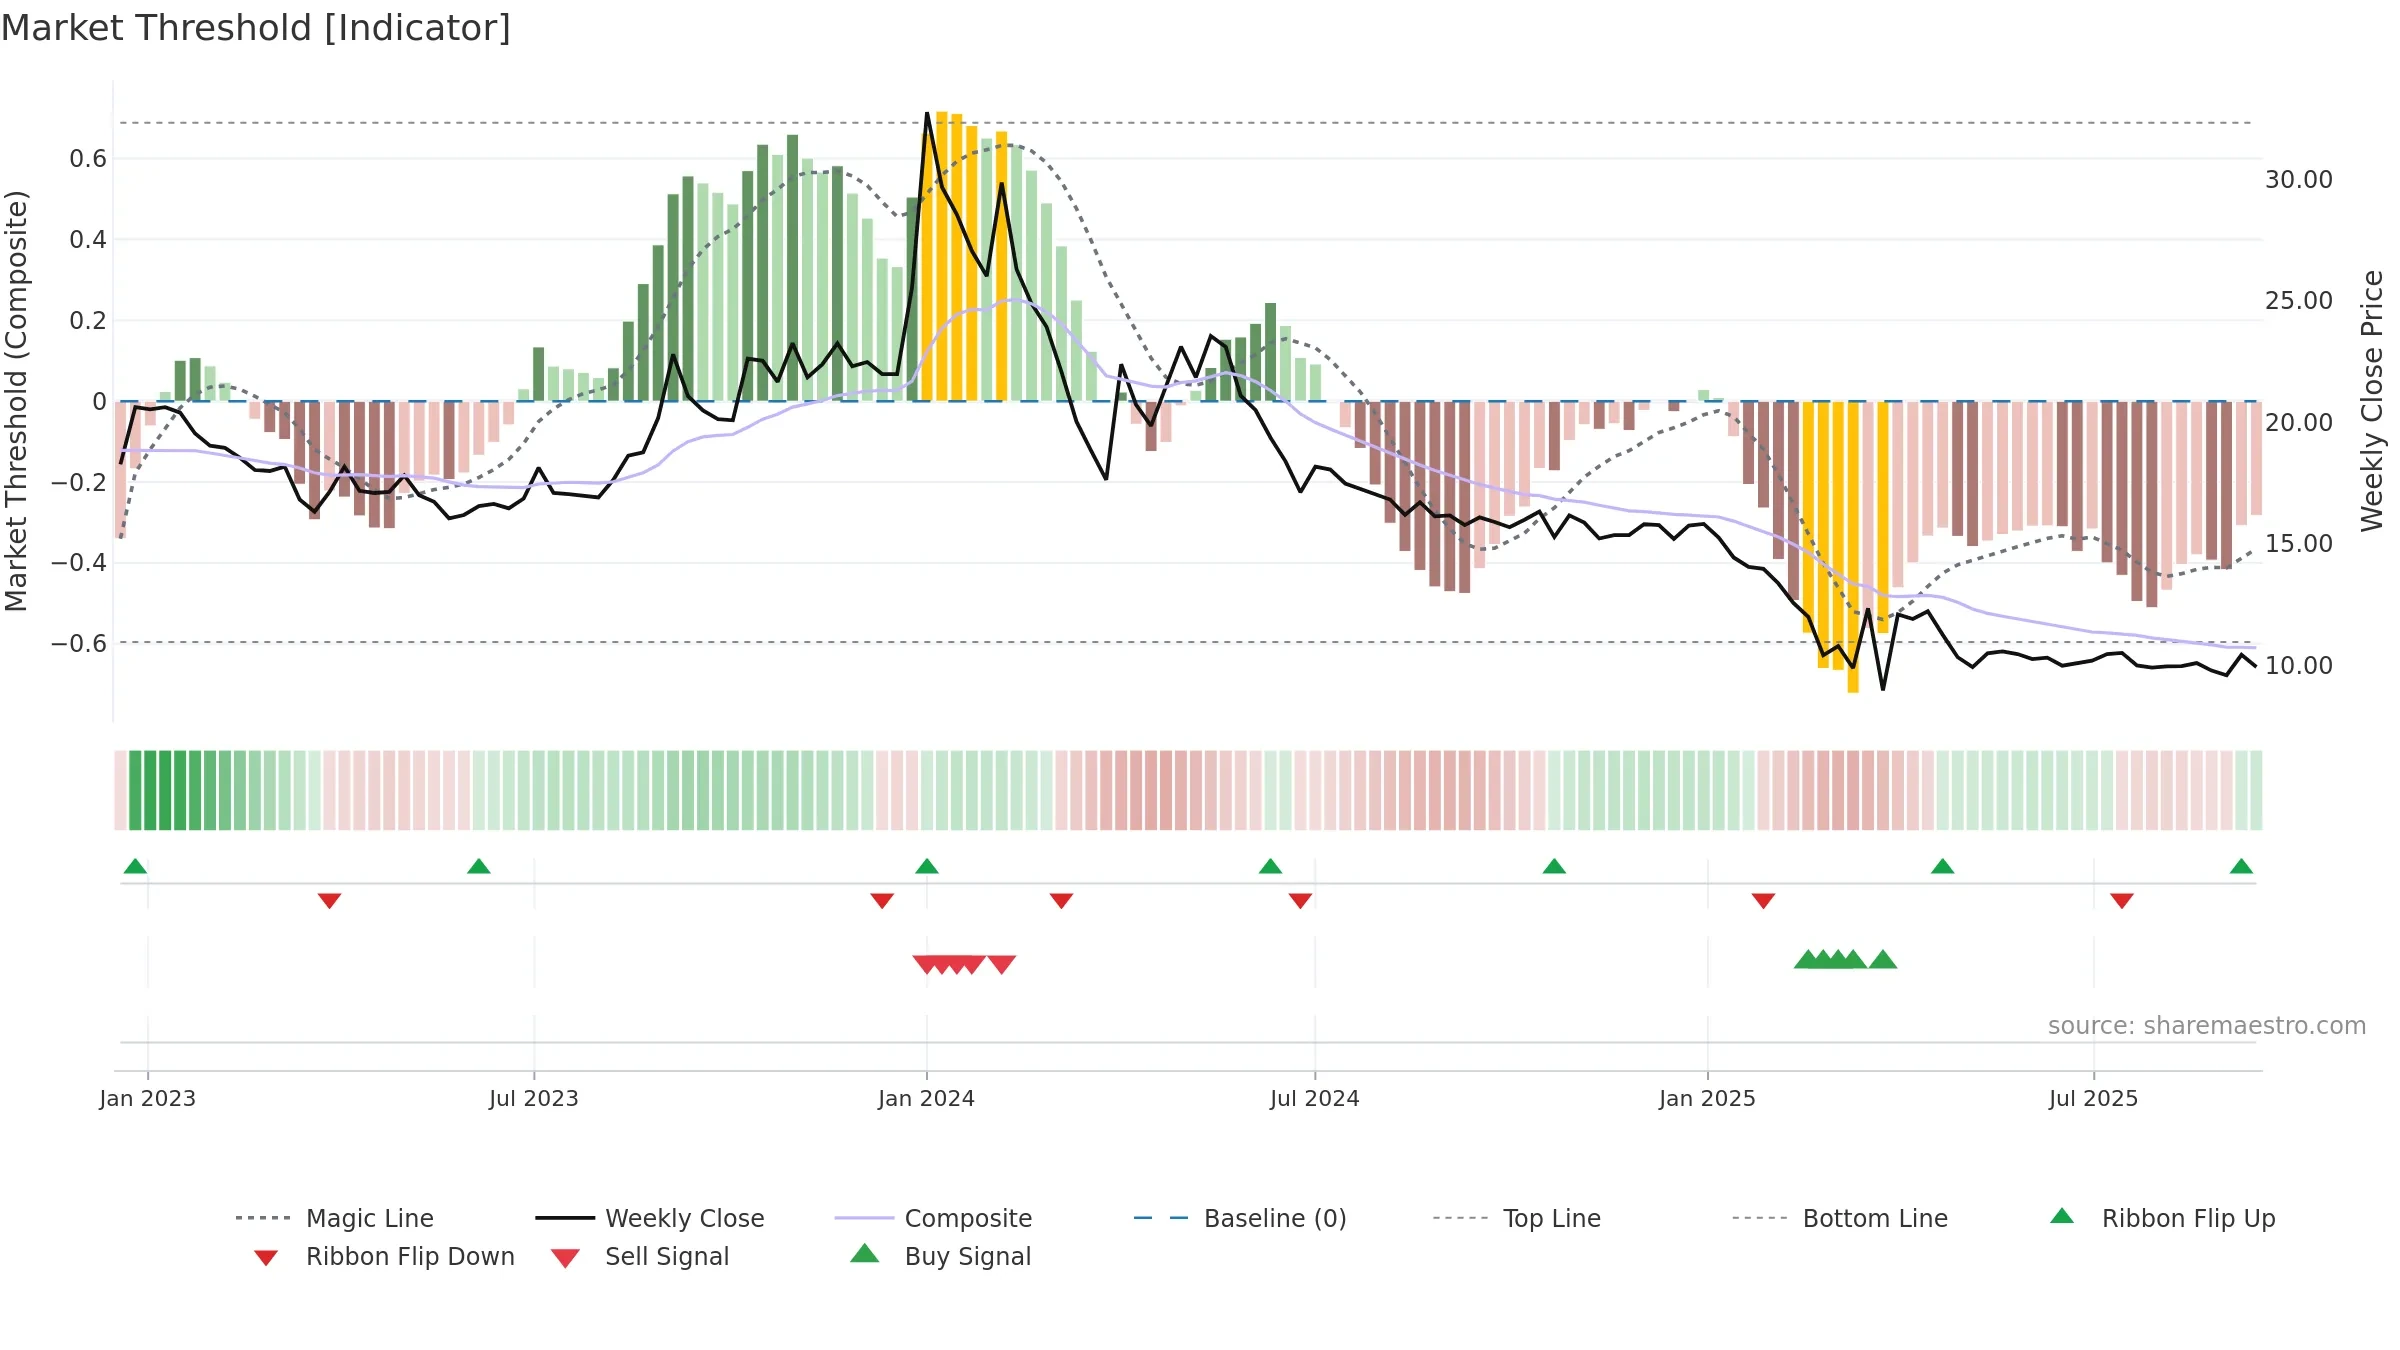
How to read this — Bearish backdrop but short-term momentum is improving; confirmation still needed.
Early improvement — look for a reclaim of 0.50→0.60 to validate.
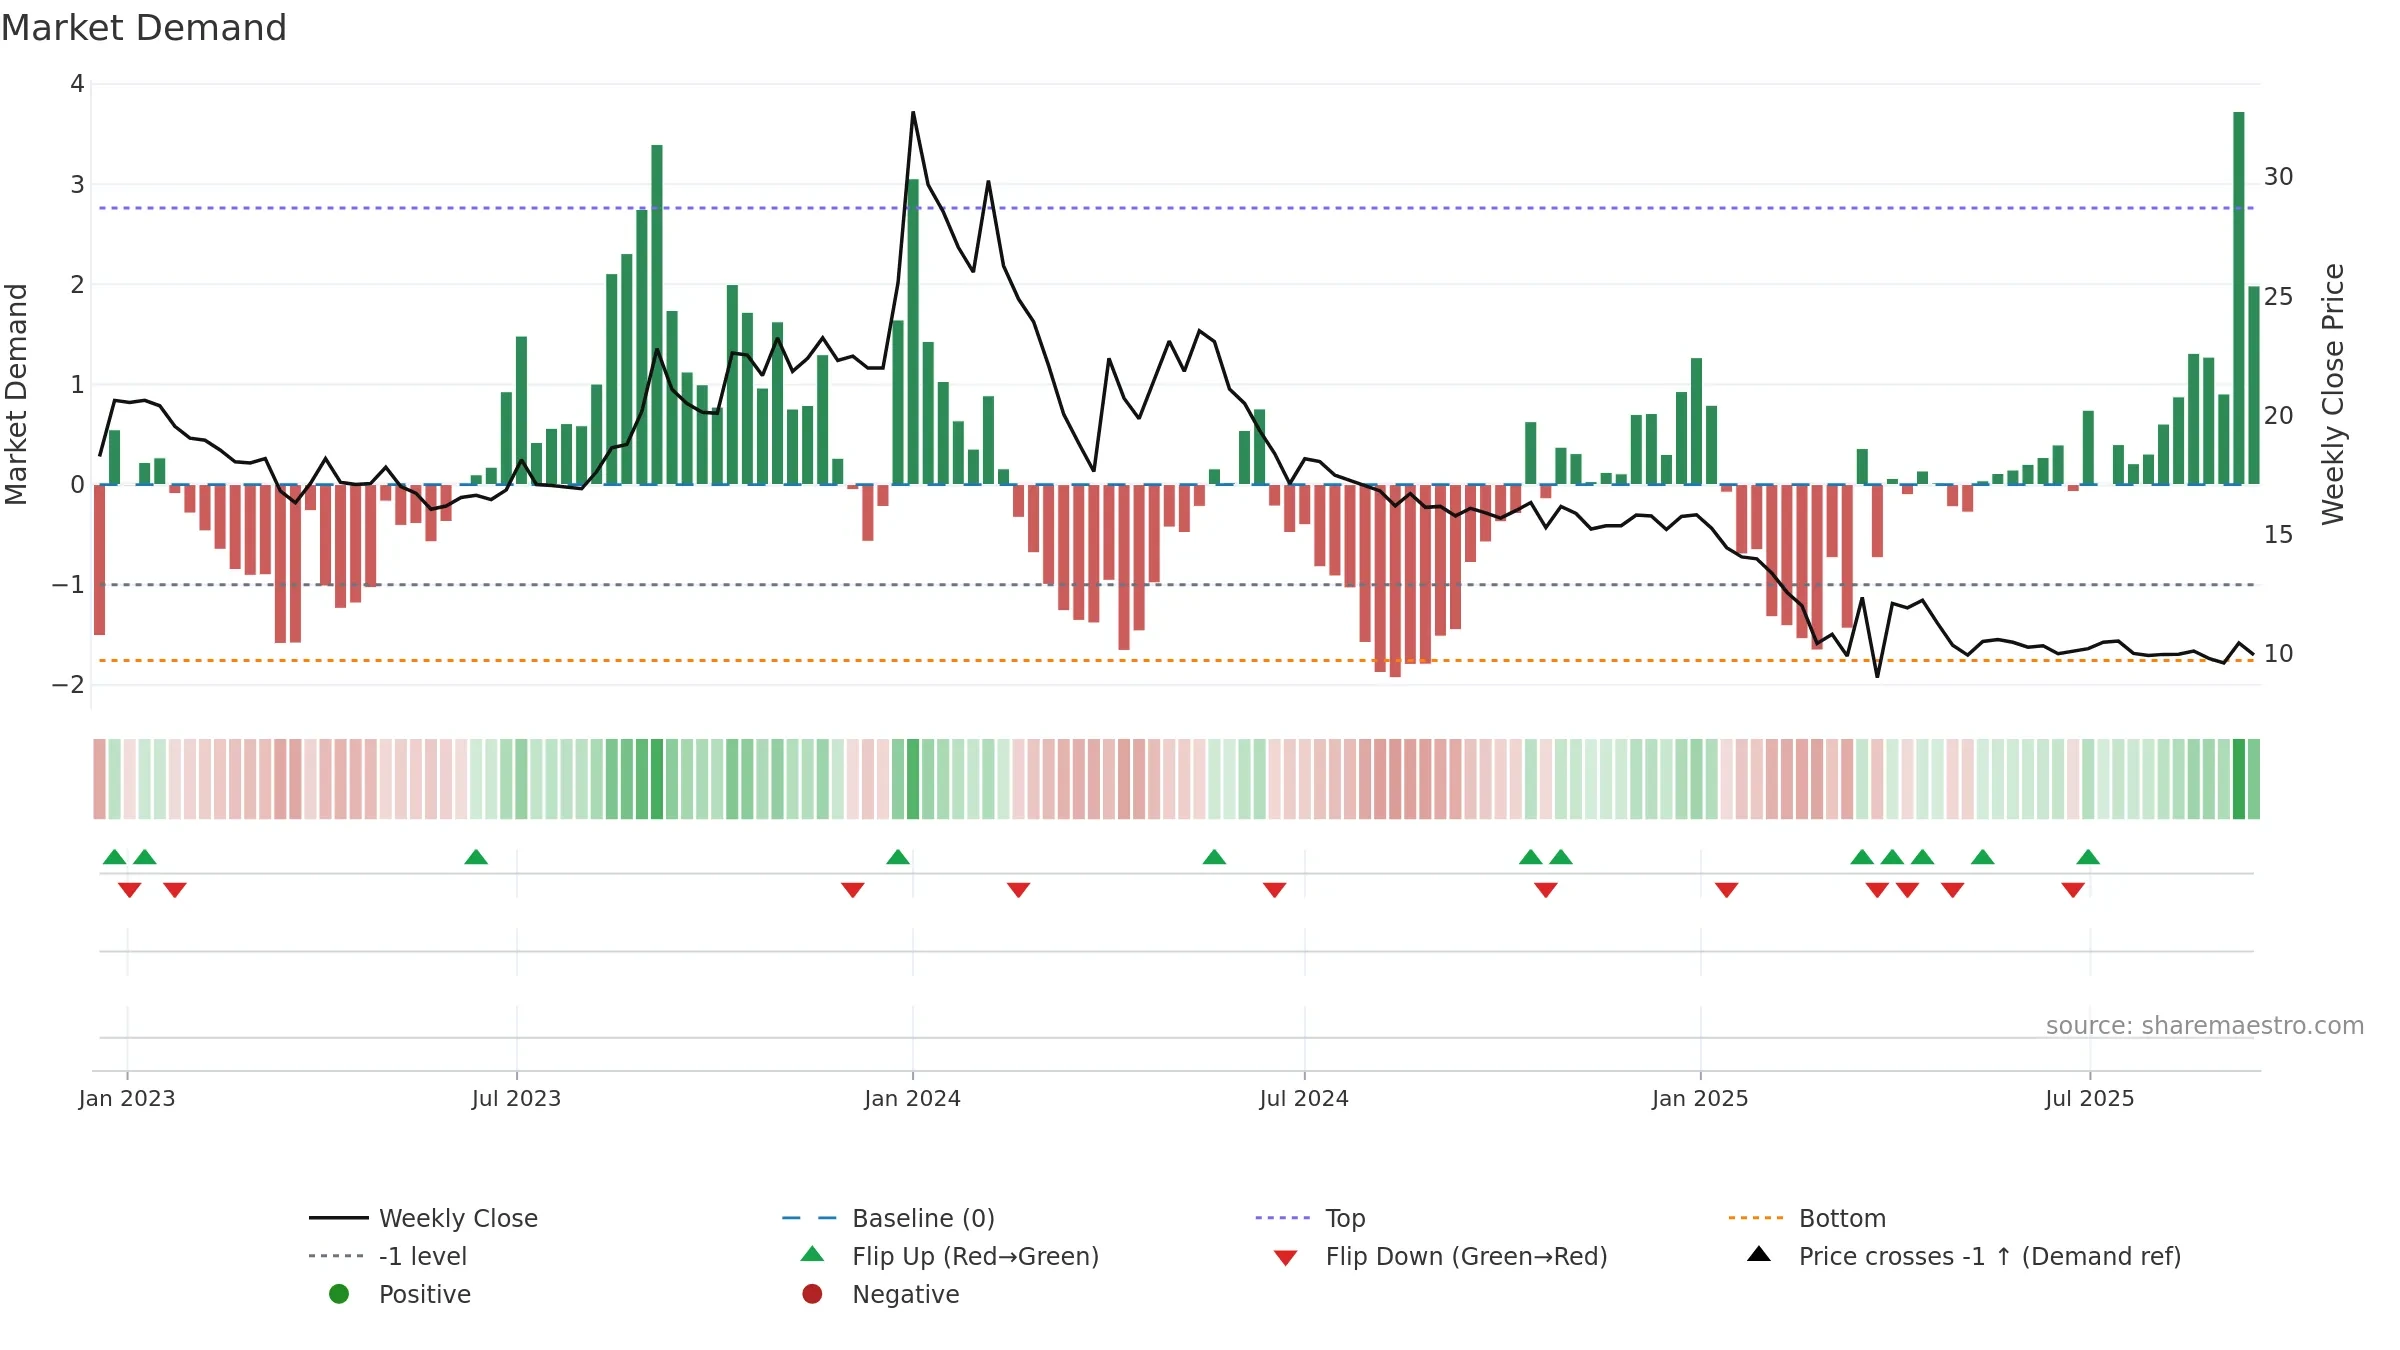
Price is above fair value; upside may be capped without catalysts.
Conclusion
Positive setup. ★★★★☆ confidence. Price window: 0. Trend: Bottoming Attempt; gauge 13. In combination, liquidity confirms the move.
- Early improvement from bearish zone (bottoming attempt)
- Liquidity confirms the price trend
- Buyers step in at depressed levels (accumulation)
- Price is not above key averages
- Weak moving-average stack
Why: Price window 0.30% over 8w. Close is -4.78% below the prior-window high. Volume trend rising. Liquidity convergence with price. Trend state bottoming attempt. Low-regime (≤0.25) upticks 7/7 (100.0%) • Accumulating. MA stack weak. 4–8w crossover bearish. Momentum neutral and rising. Valuation limited upside without catalysts.
Tip: Most metrics include a hover tooltip where they appear in the report.