Thermon Group Holdings, Inc.
THR NYSE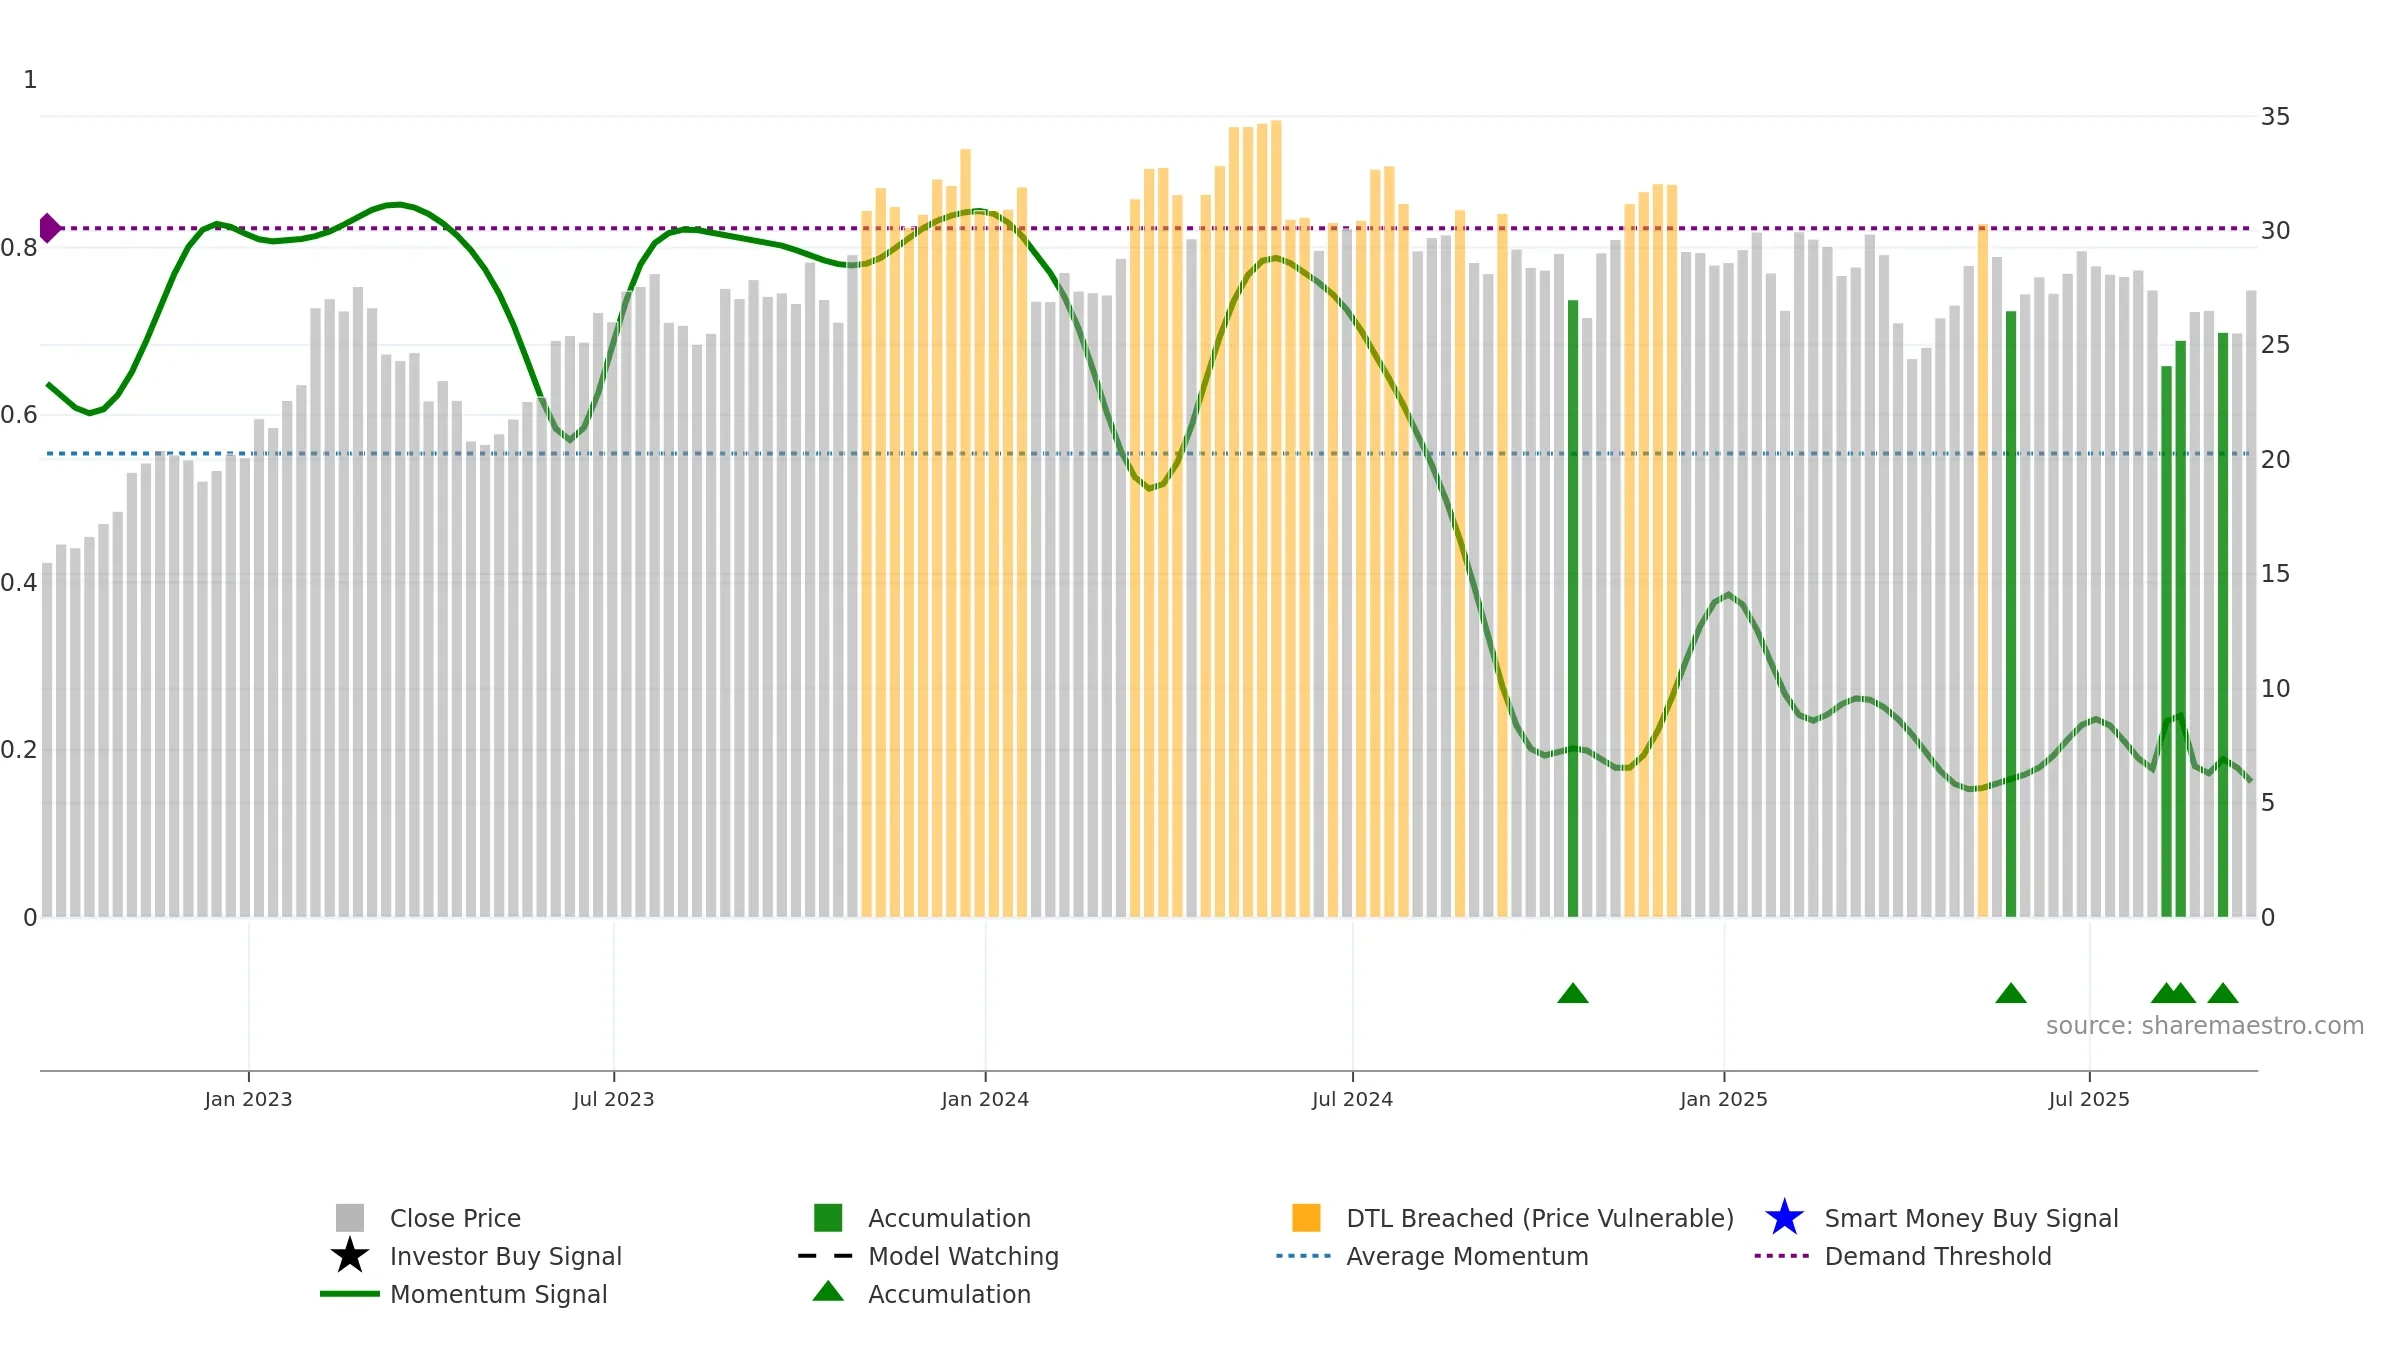
Weekly Report
Thermon Group Holdings, Inc. closed at 27.4100 (1.03% WoW) . Data window ends Fri, 19 Sep 2025.
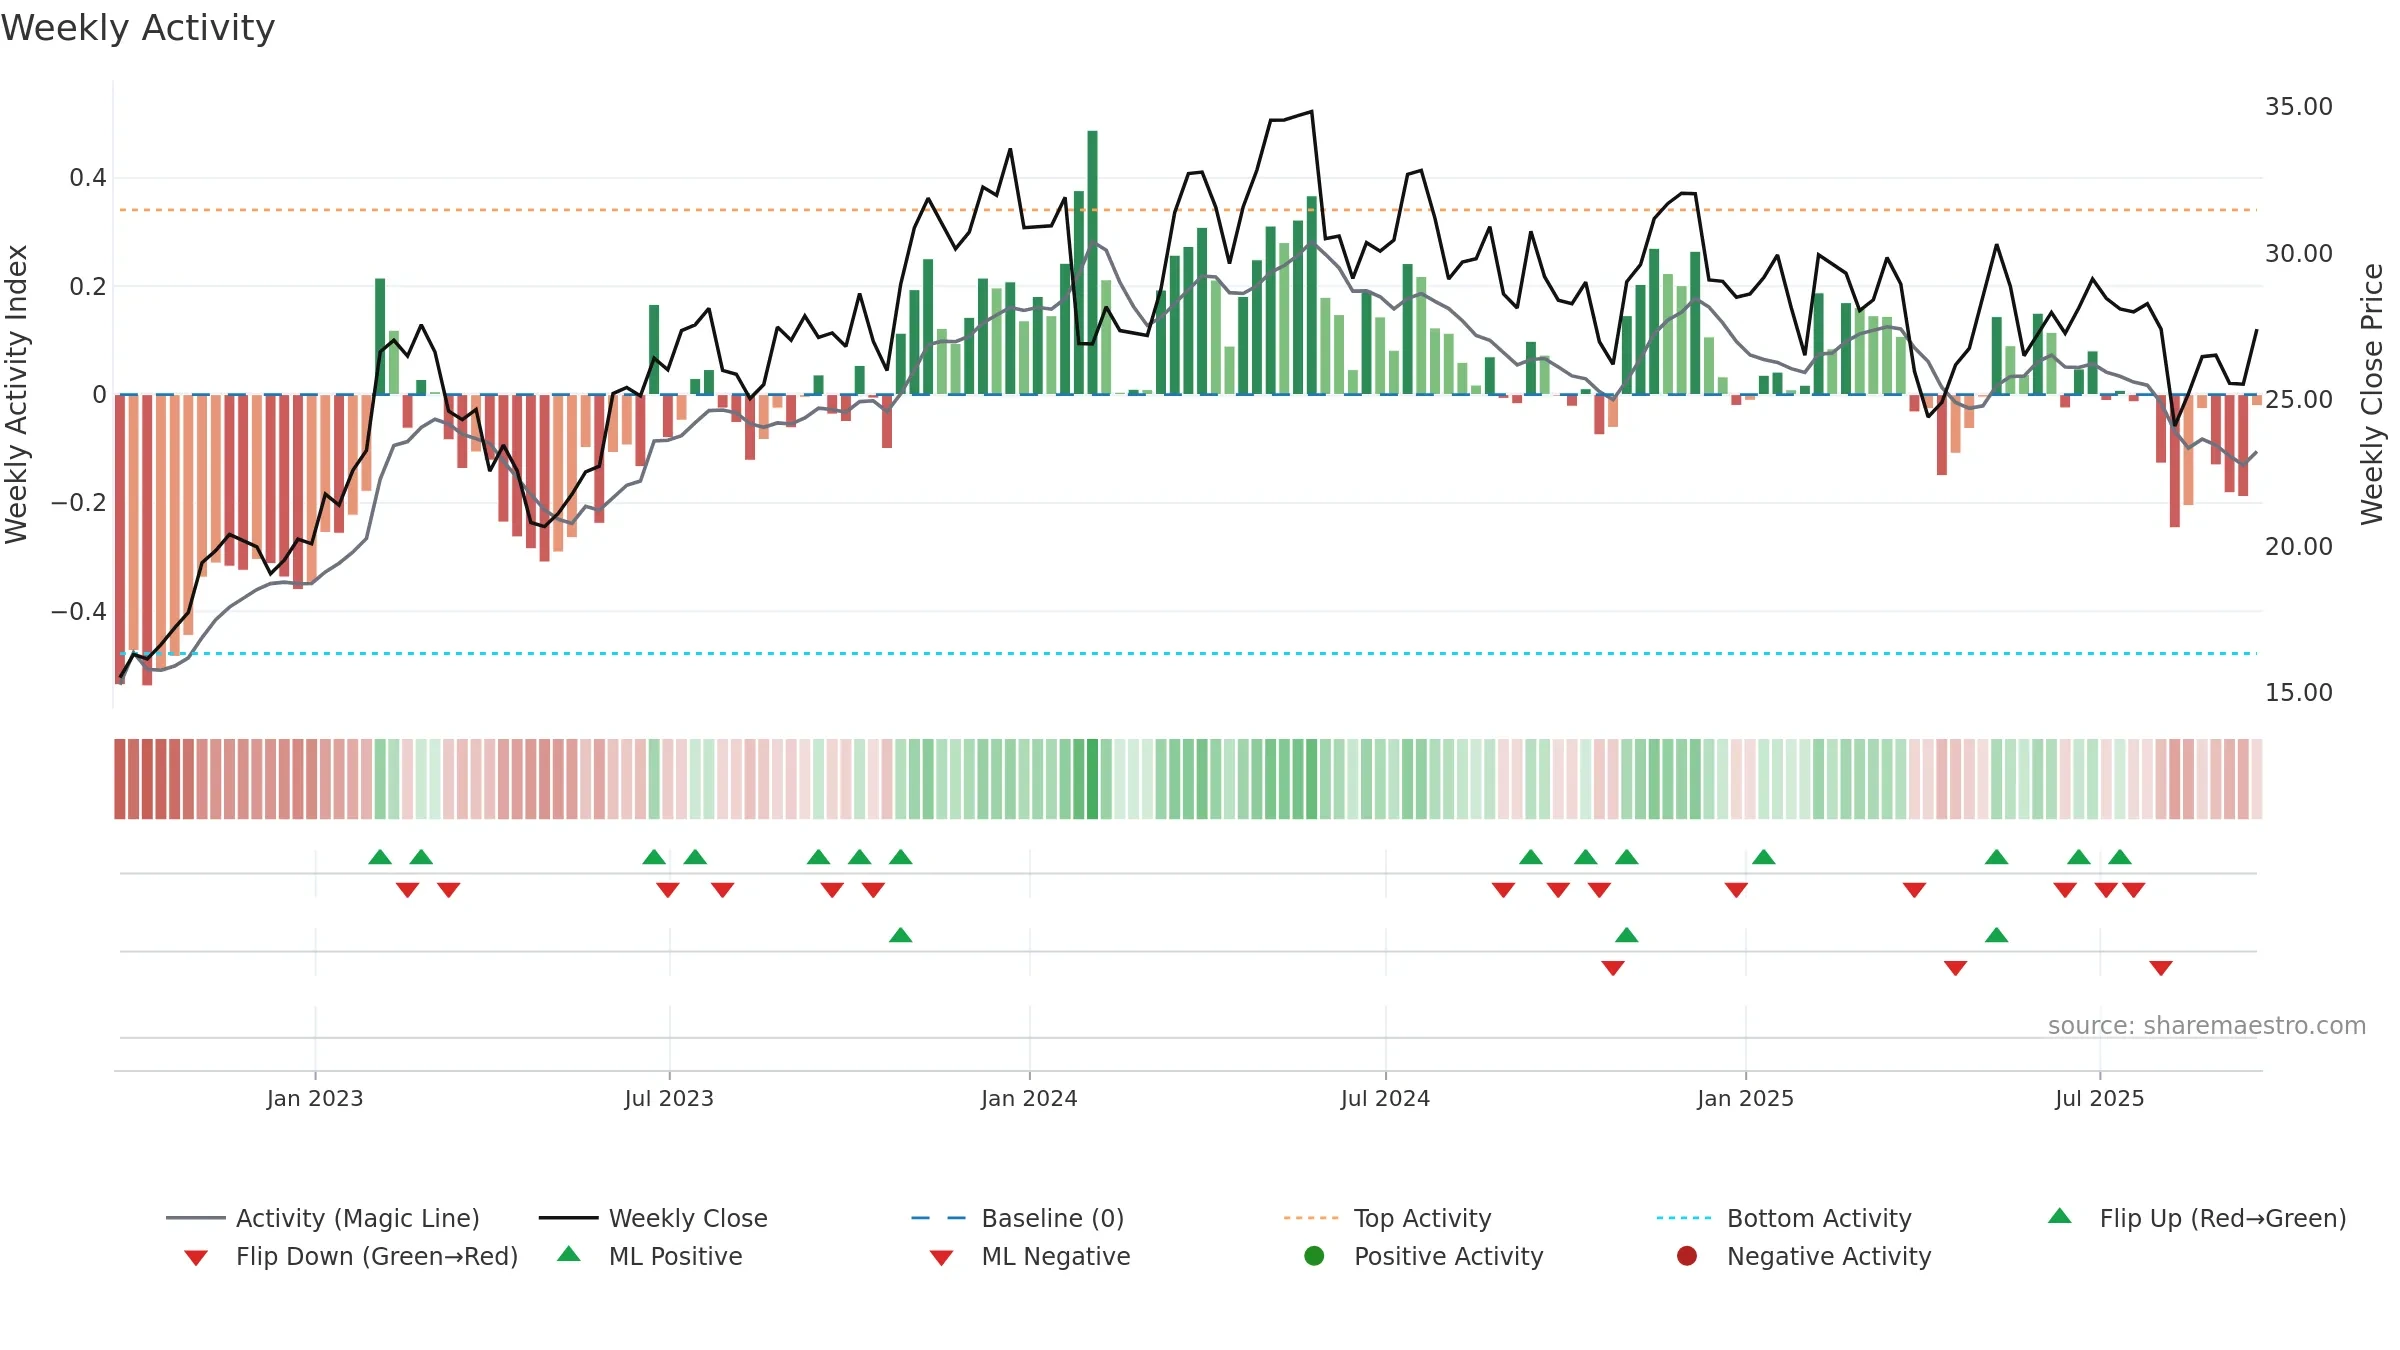
How to read this — Price slope is upward, indicating persistent buying over the window. Volume and price are moving in the same direction — a constructive confirmation. Returns are positively correlated with volume — strength tends to arrive on higher activity. Distance to baseline is narrowing — reverting closer to its fair-value track. Fresh short-term crossover improves near-term tone. Price holds above key averages, indicating constructive participation.
Up-slope supports buying interest; pullbacks may be contained if activity stays firm.
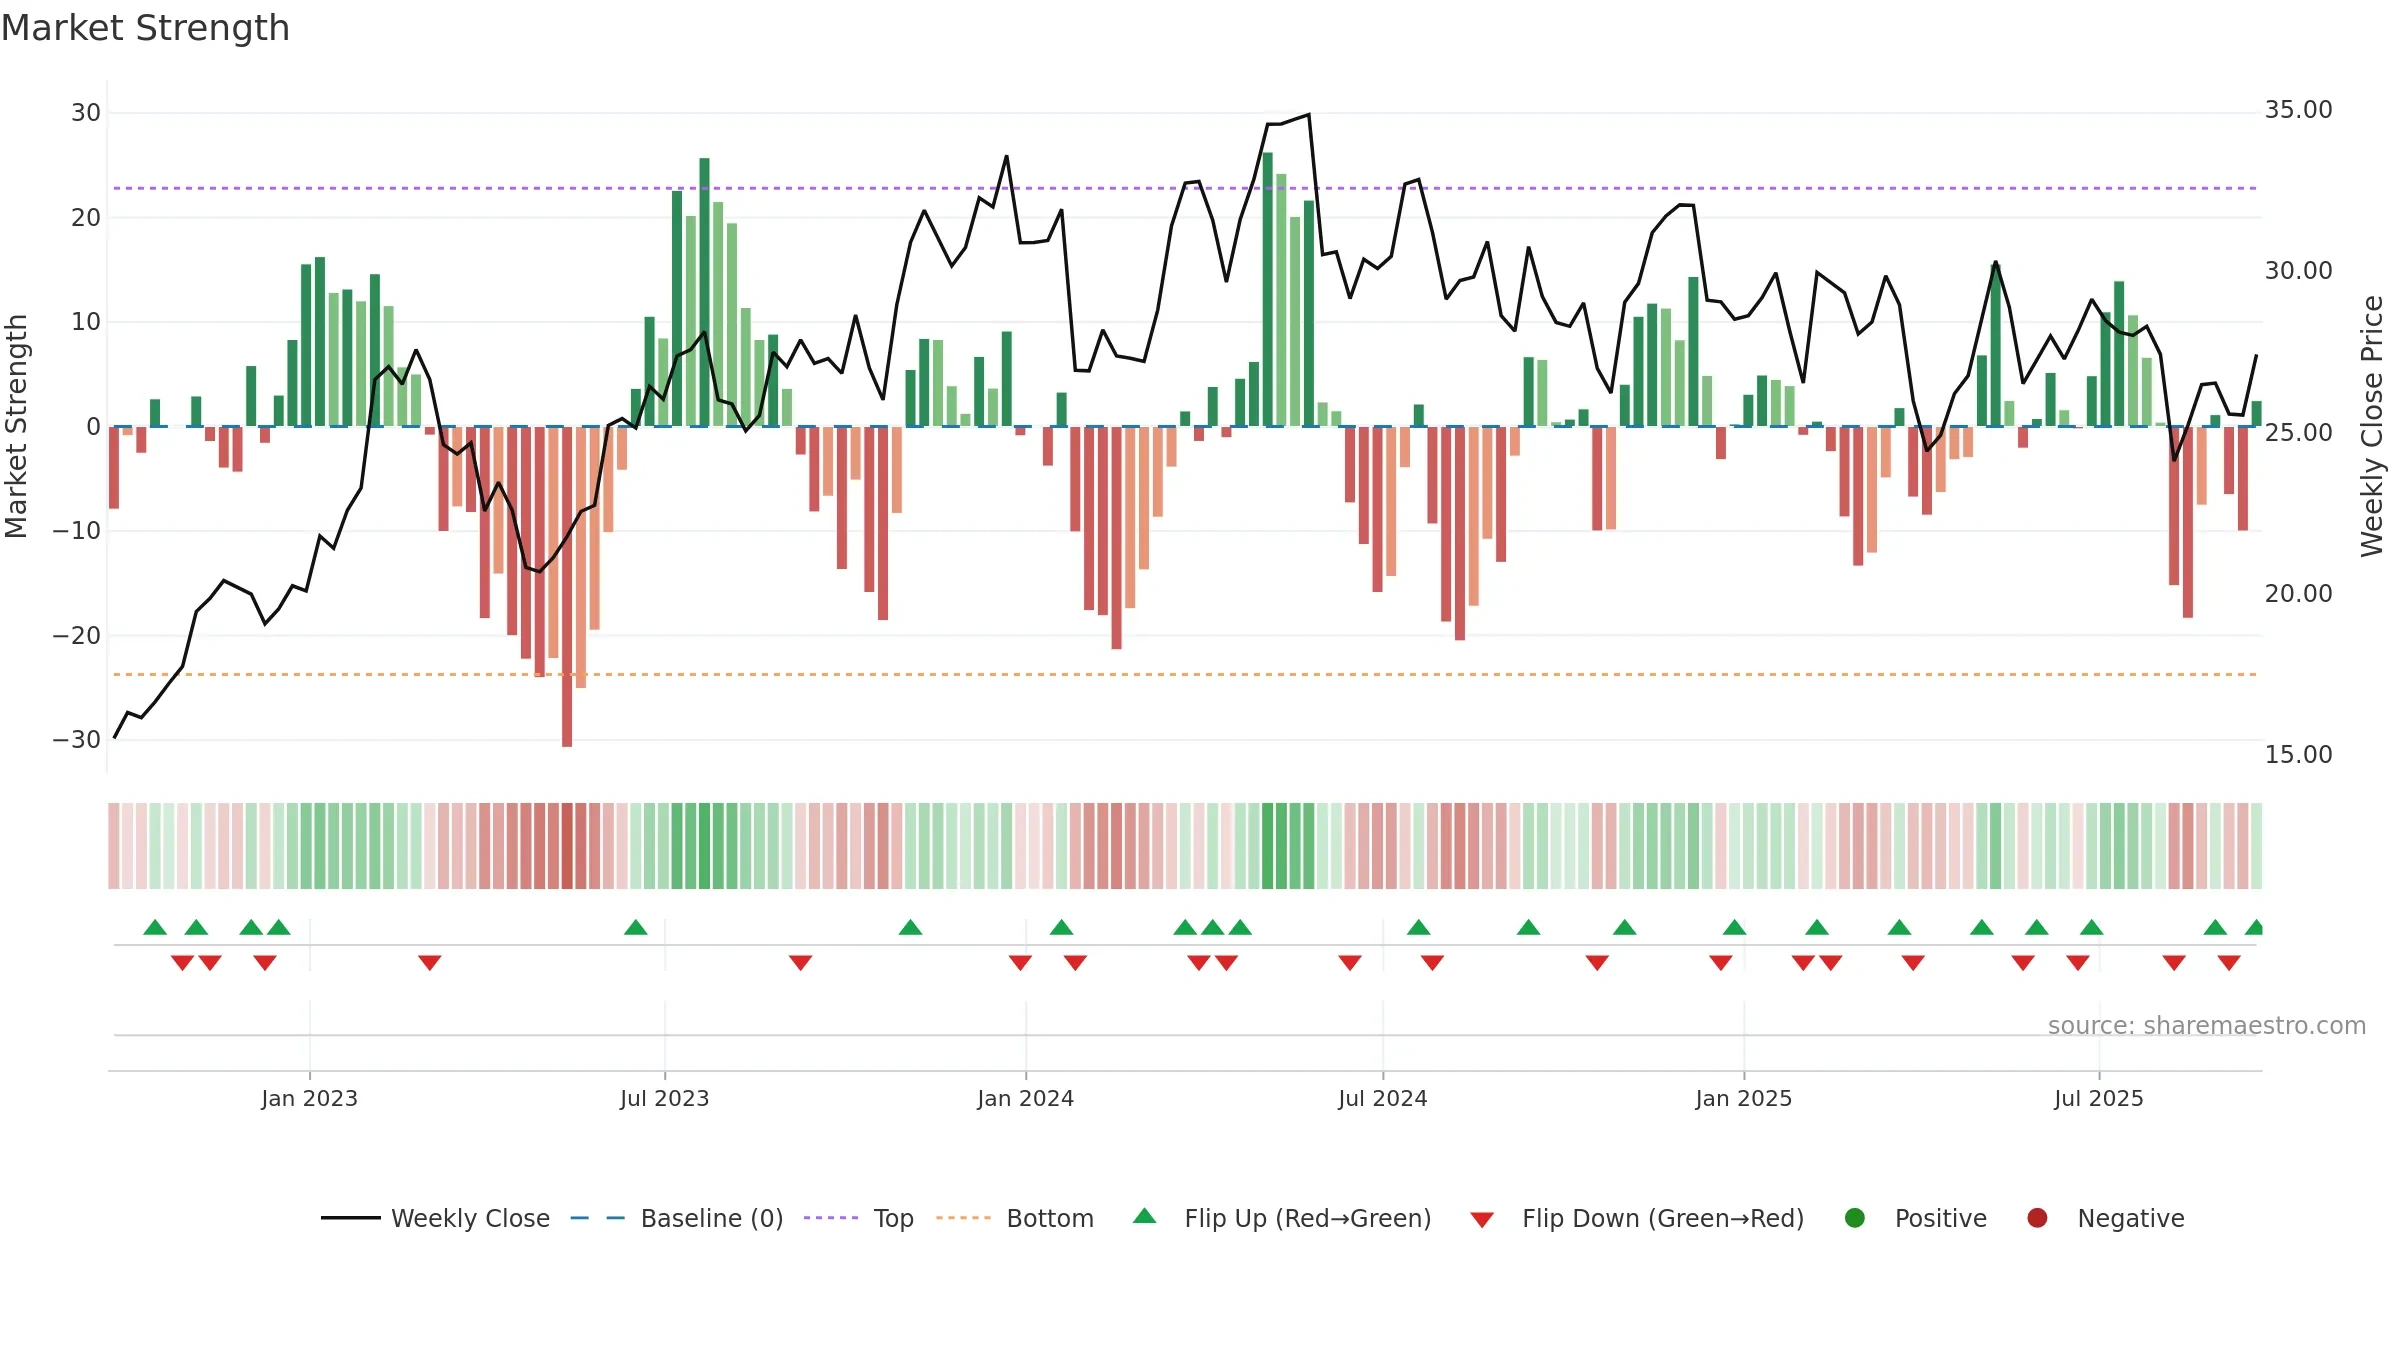
Gauge maps the trend signal to a 0–100 scale.
How to read this — Bearish zone with falling momentum — sellers in control.
Bias remains lower; rallies are suspect unless gauge reclaims 0.50/0.60.
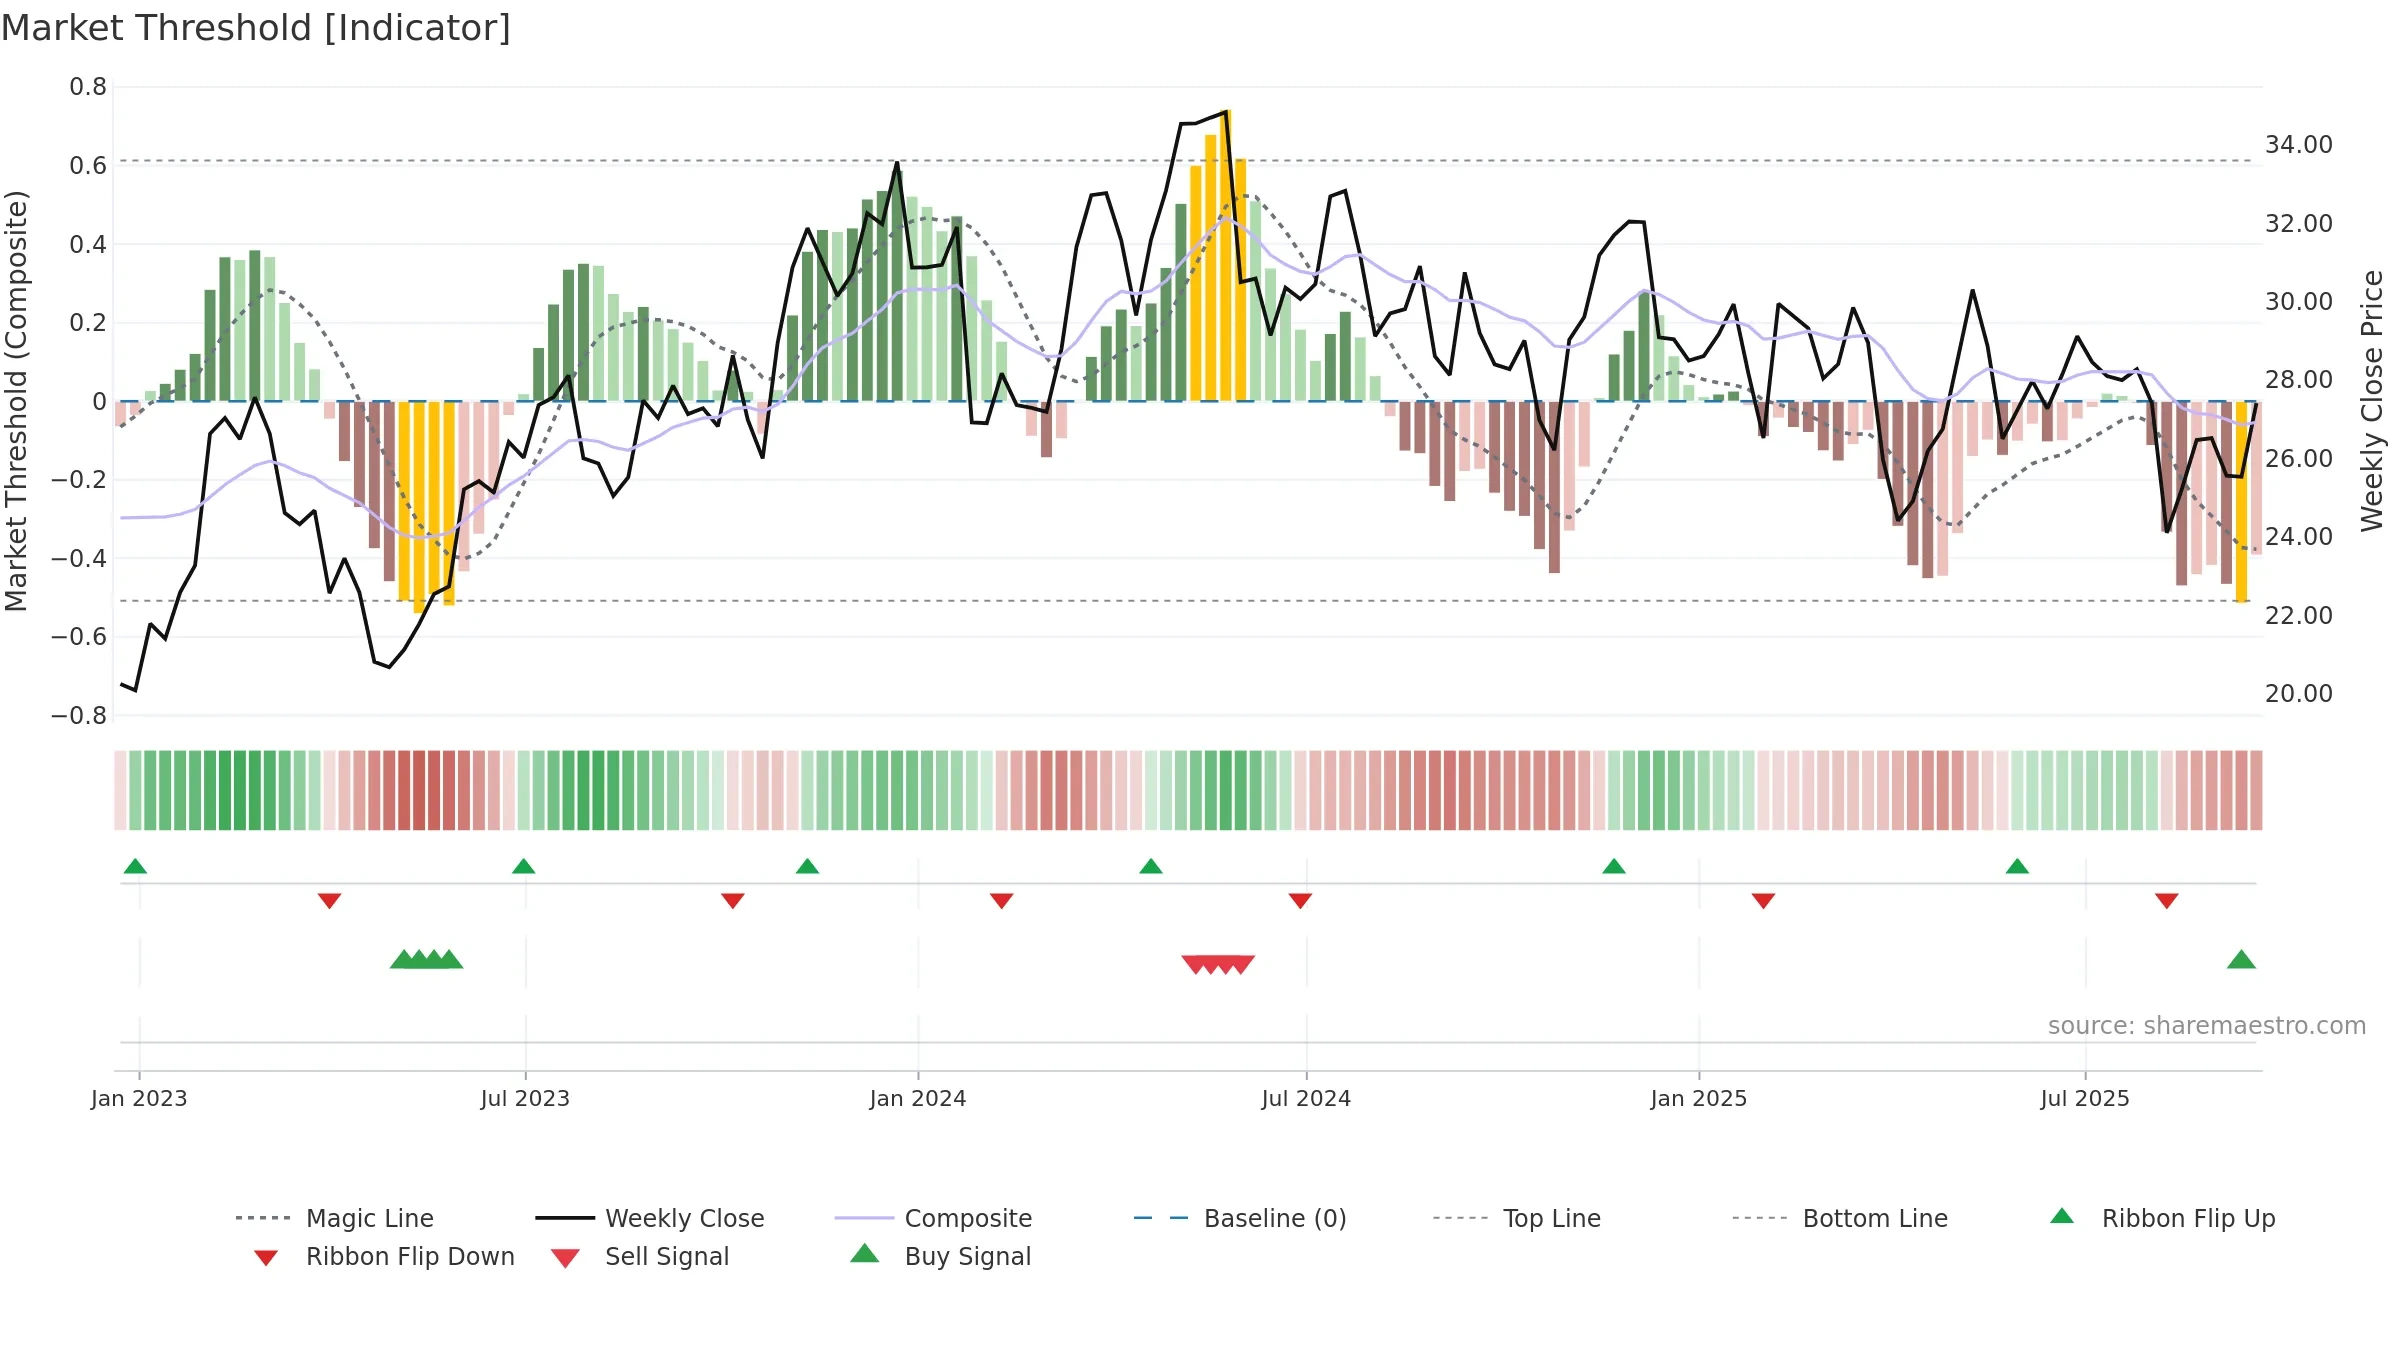
Price is below fair value; potential upside if momentum constructive.
Conclusion
Negative setup. ★★☆☆☆ confidence. Price window: 0. Trend: Downtrend Confirmed; gauge 16. In combination, liquidity confirms the move.
- Price holds above 8w & 26w averages
- Liquidity confirms the price trend
- Bearish control with falling momentum
- Momentum is weak/falling
Why: Return volatility 2.40%. Volume trend rising. Liquidity convergence with price. Trend state downtrend confirmed. Low-regime (≤0.25) upticks 3/7 (43.0%) • Distributing. 4–8w crossover bullish. Momentum bearish and falling. Valuation supportive skew.
Tip: Most metrics include a hover tooltip where they appear in the report.