Daiichi Sankyo Company, Limited
4568 TYO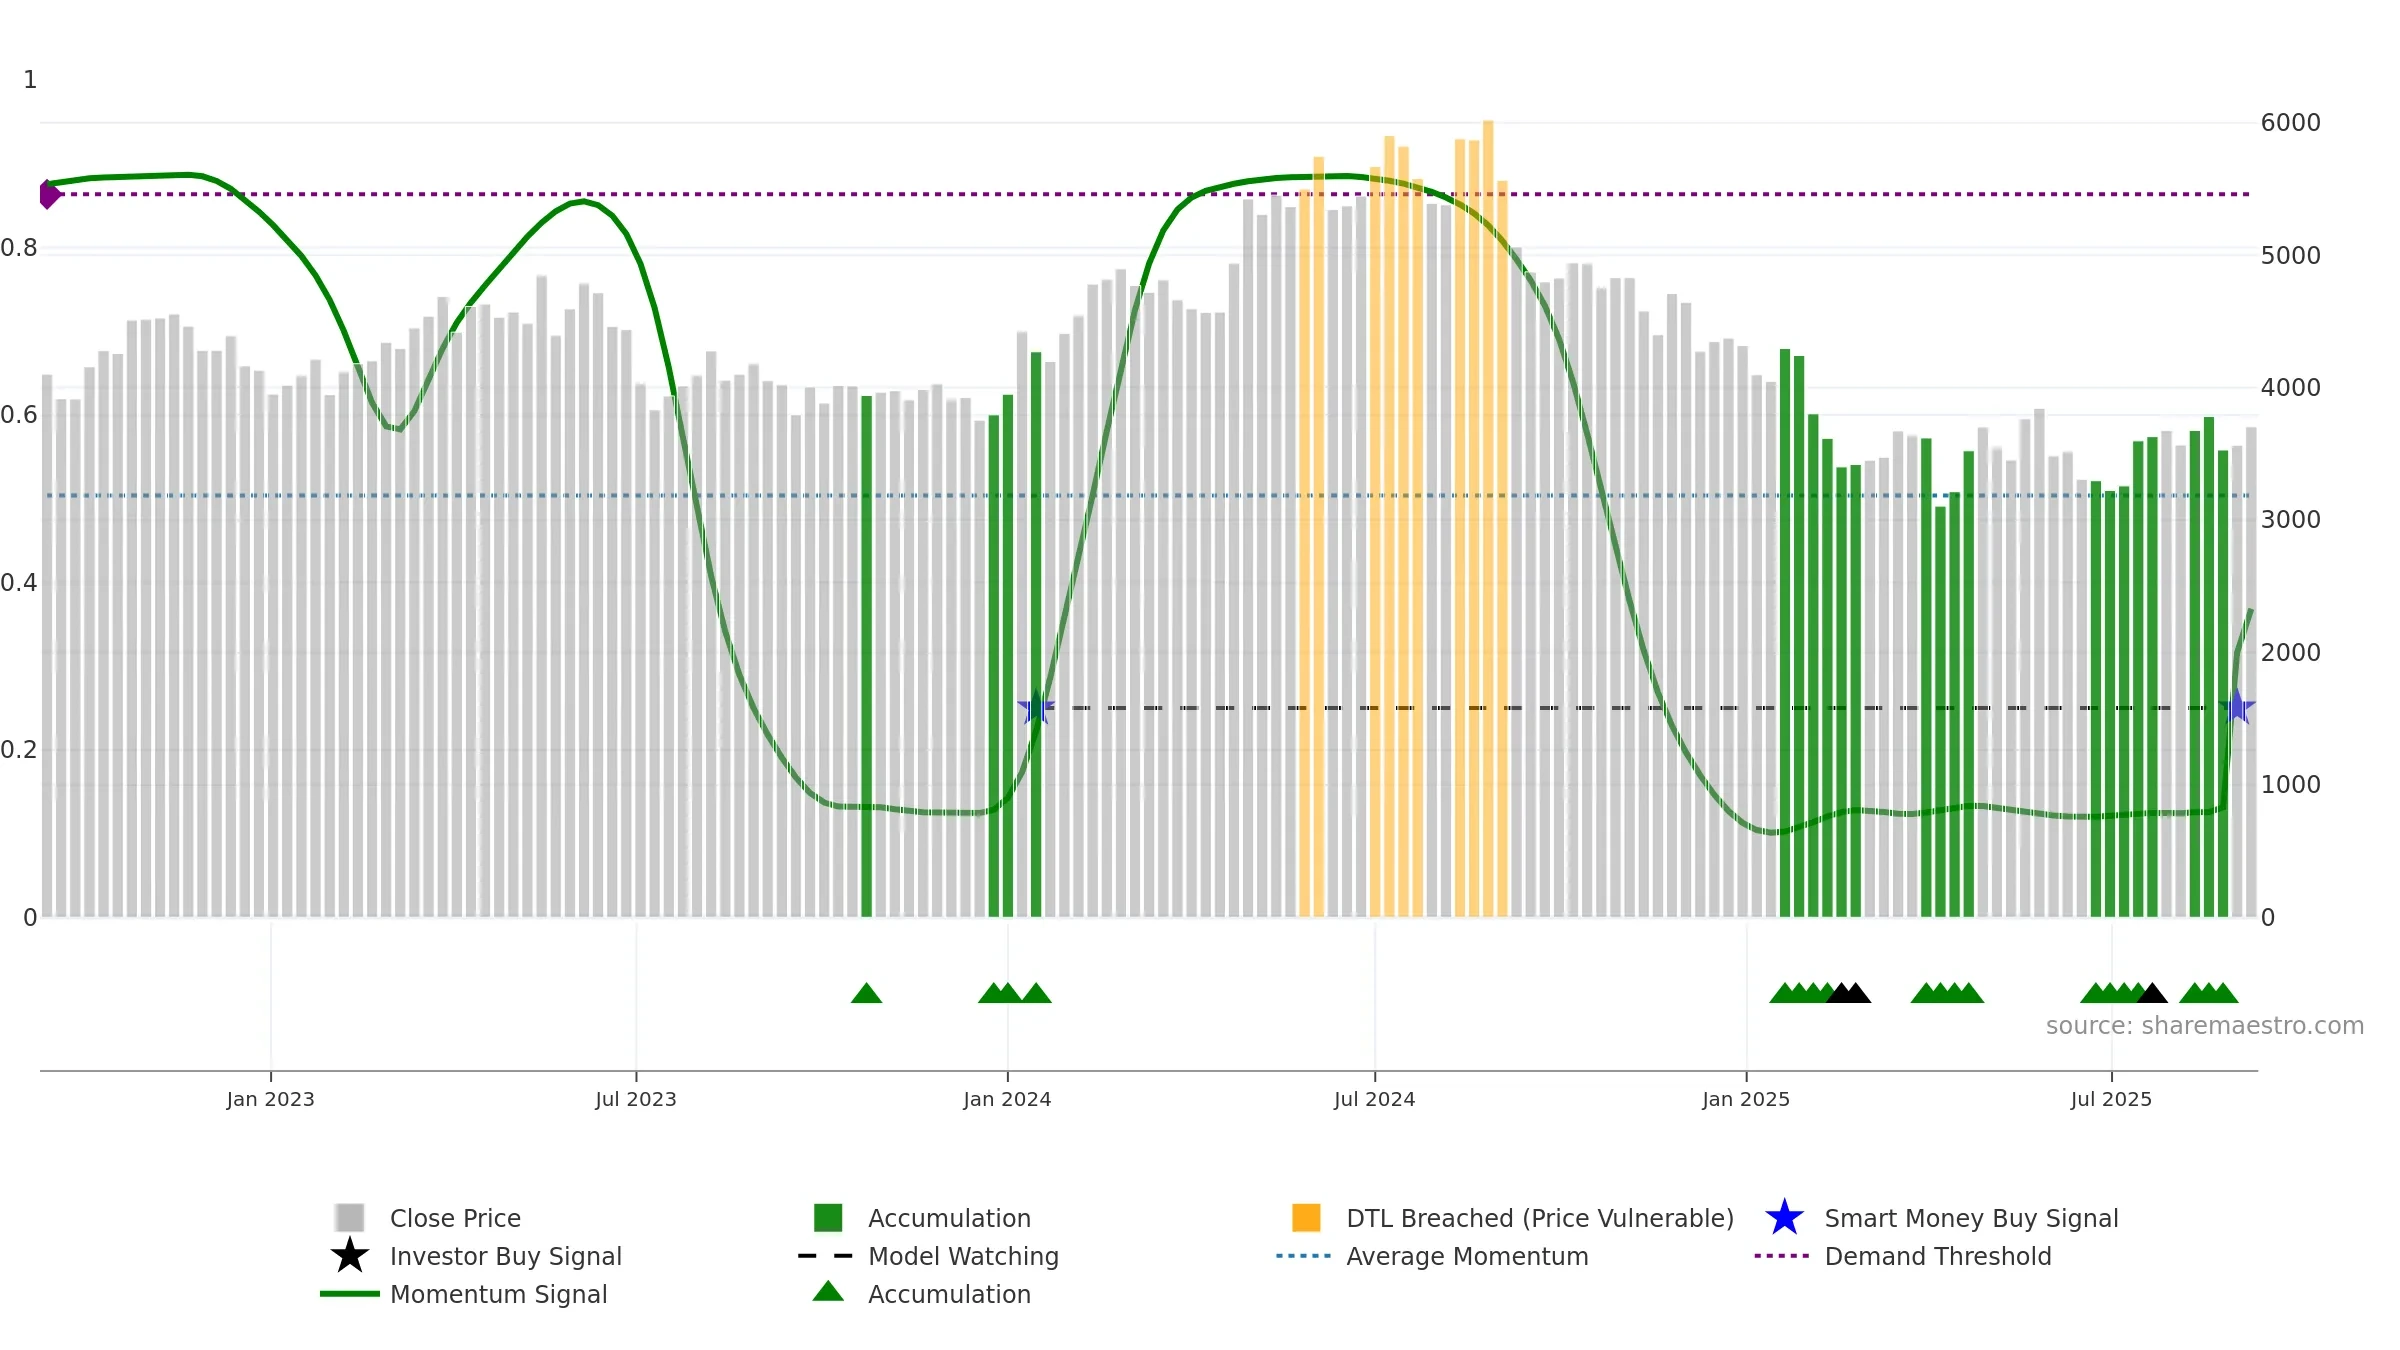
Weekly Report
Daiichi Sankyo Company, Limited closed at 3704.0000 (0.98% WoW) . Data window ends Mon, 08 Sep 2025.
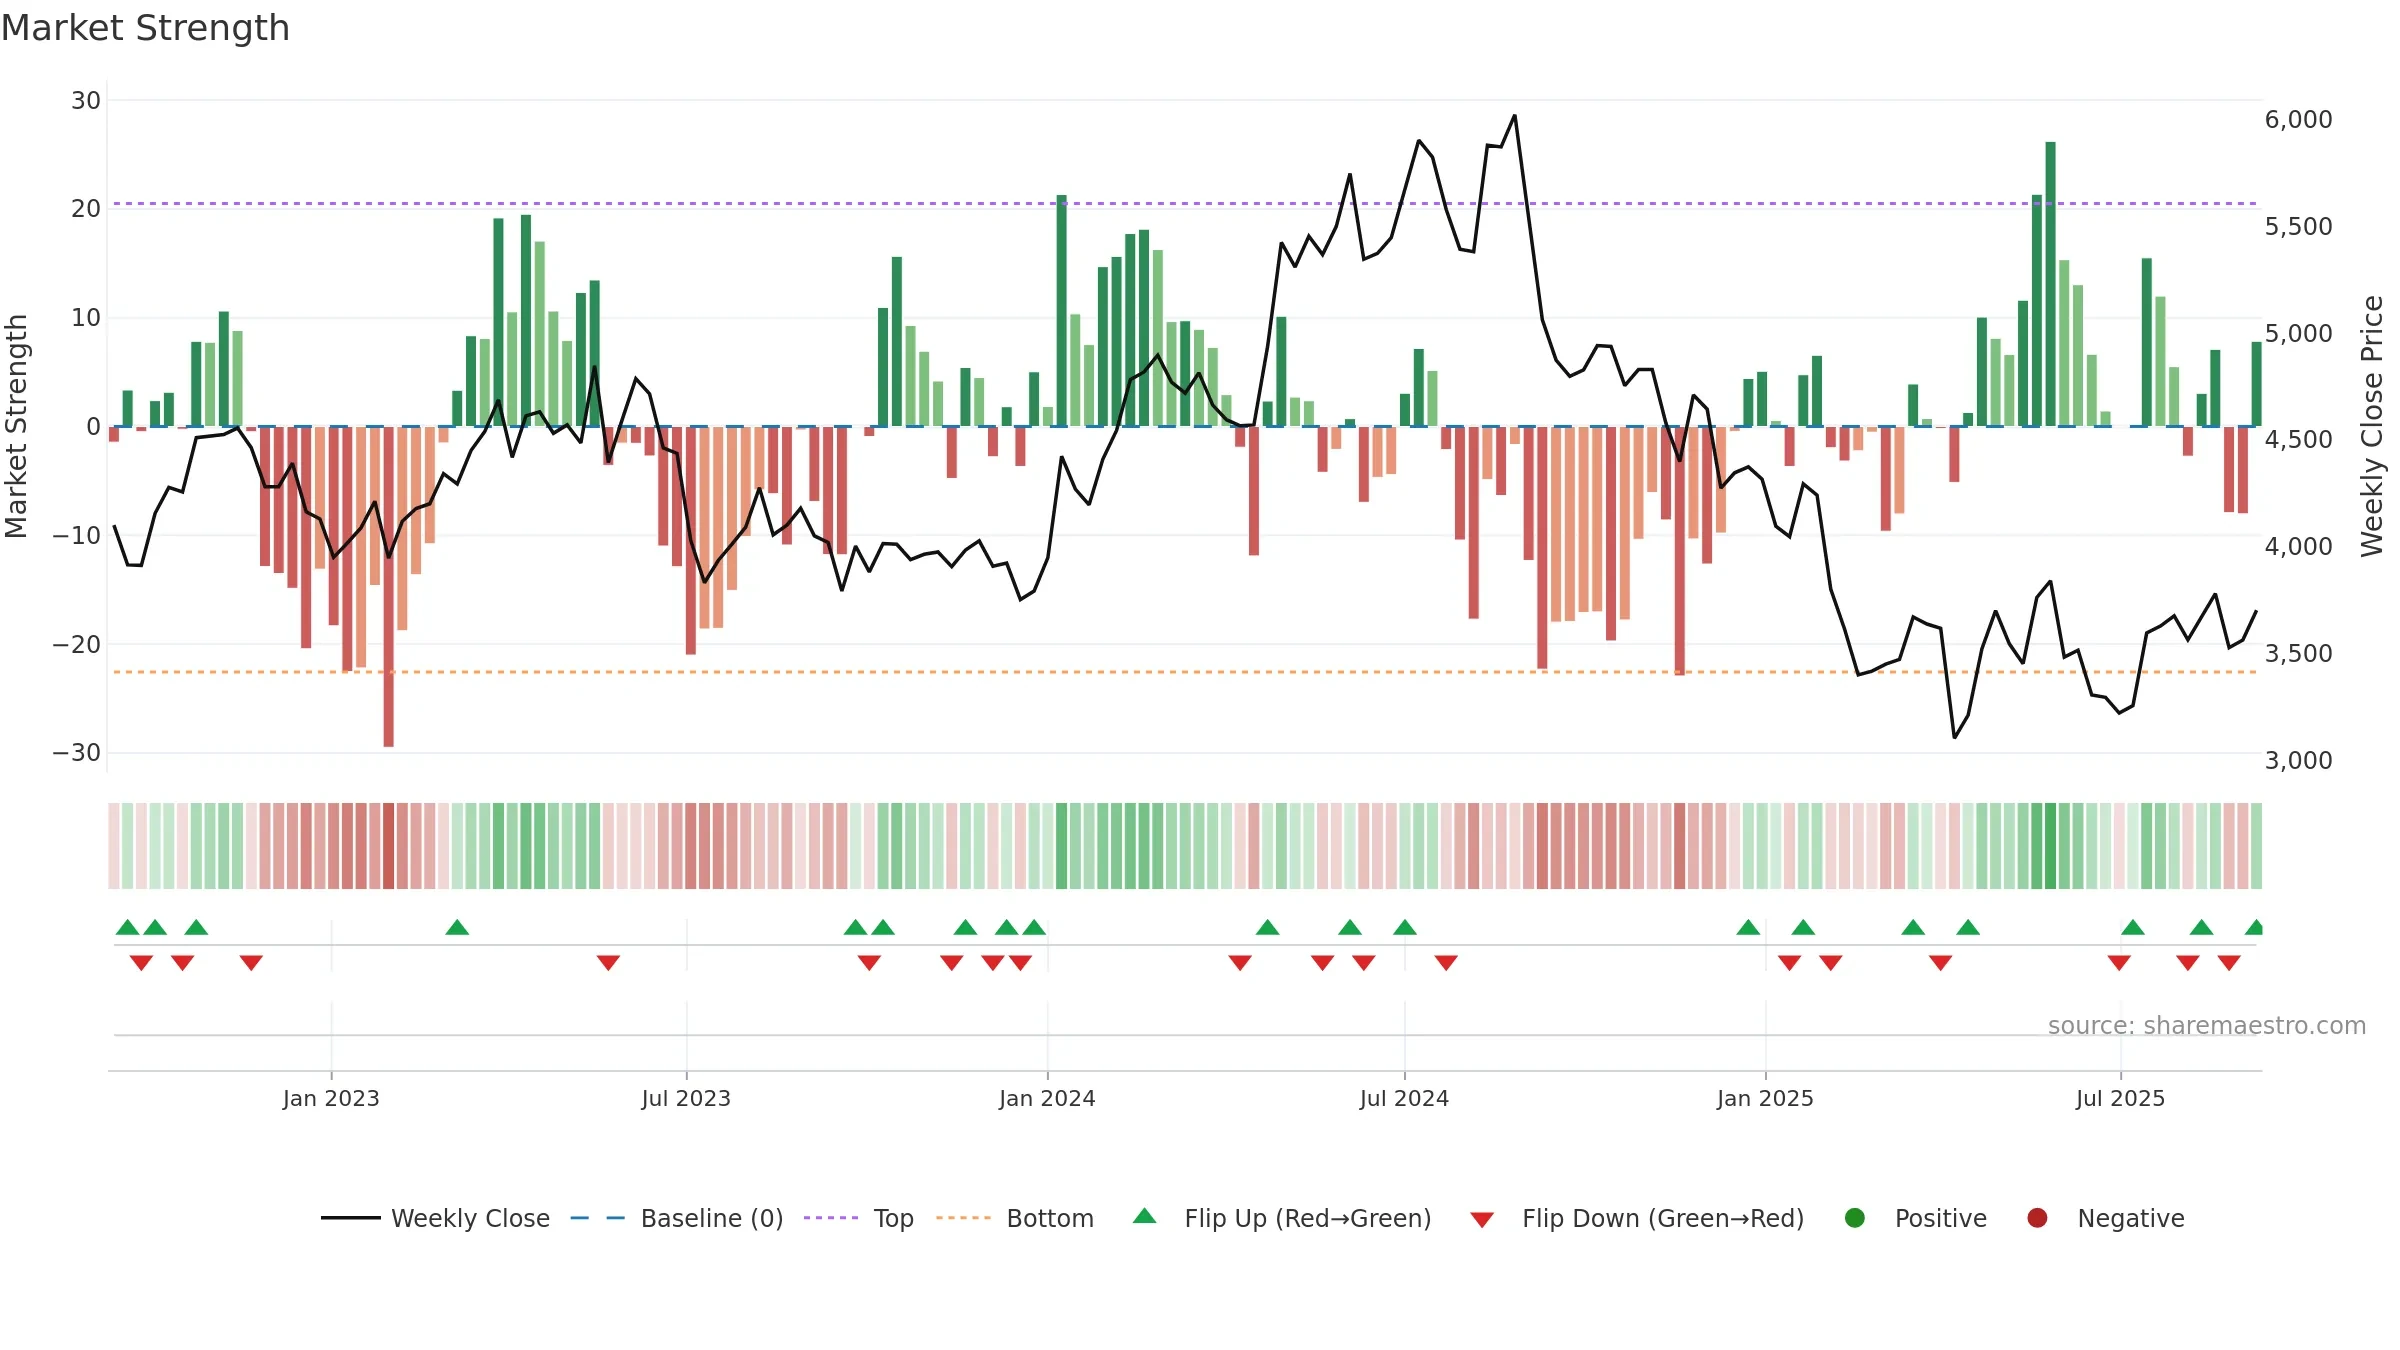
How to read this — Price slope is downward, indicating persistent supply pressure. Volume and price are moving in the same direction — a constructive confirmation. Distance to baseline is narrowing — reverting closer to its fair-value track. Price holds above key averages, indicating constructive participation.
Down-slope argues for patience; rallies can fade sooner unless participation improves.
Gauge maps the trend signal to a 0–100 scale.
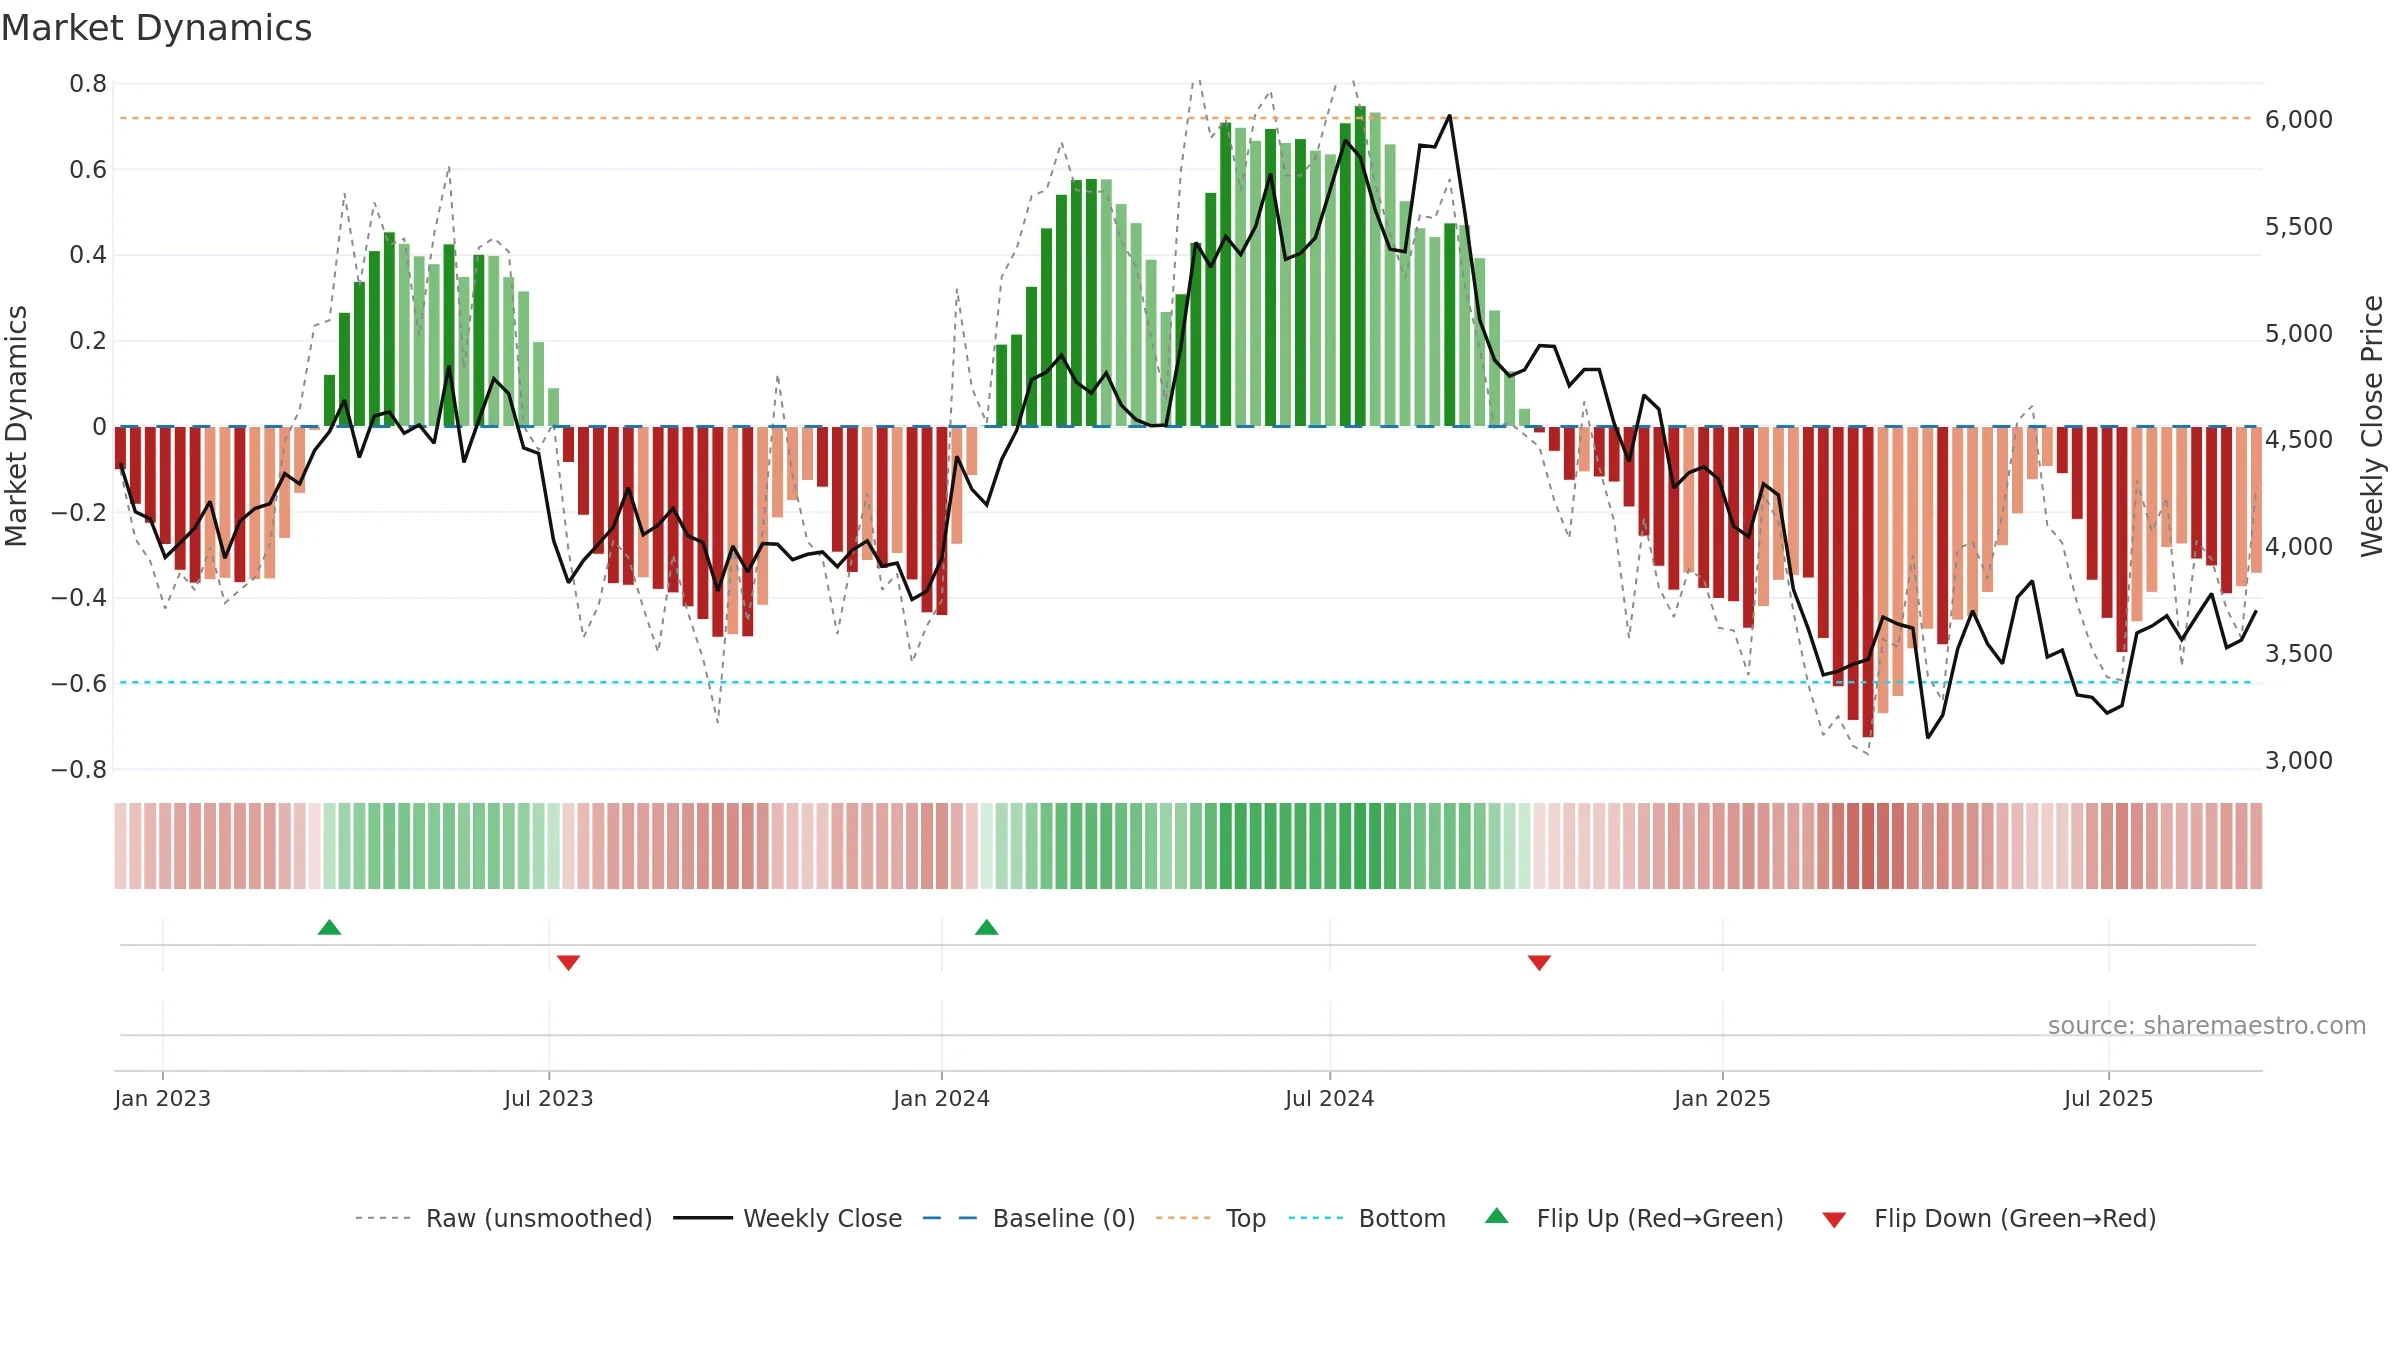
How to read this — Bearish backdrop but short-term momentum is improving; confirmation still needed.
Early improvement — look for a reclaim of 0.50→0.60 to validate.
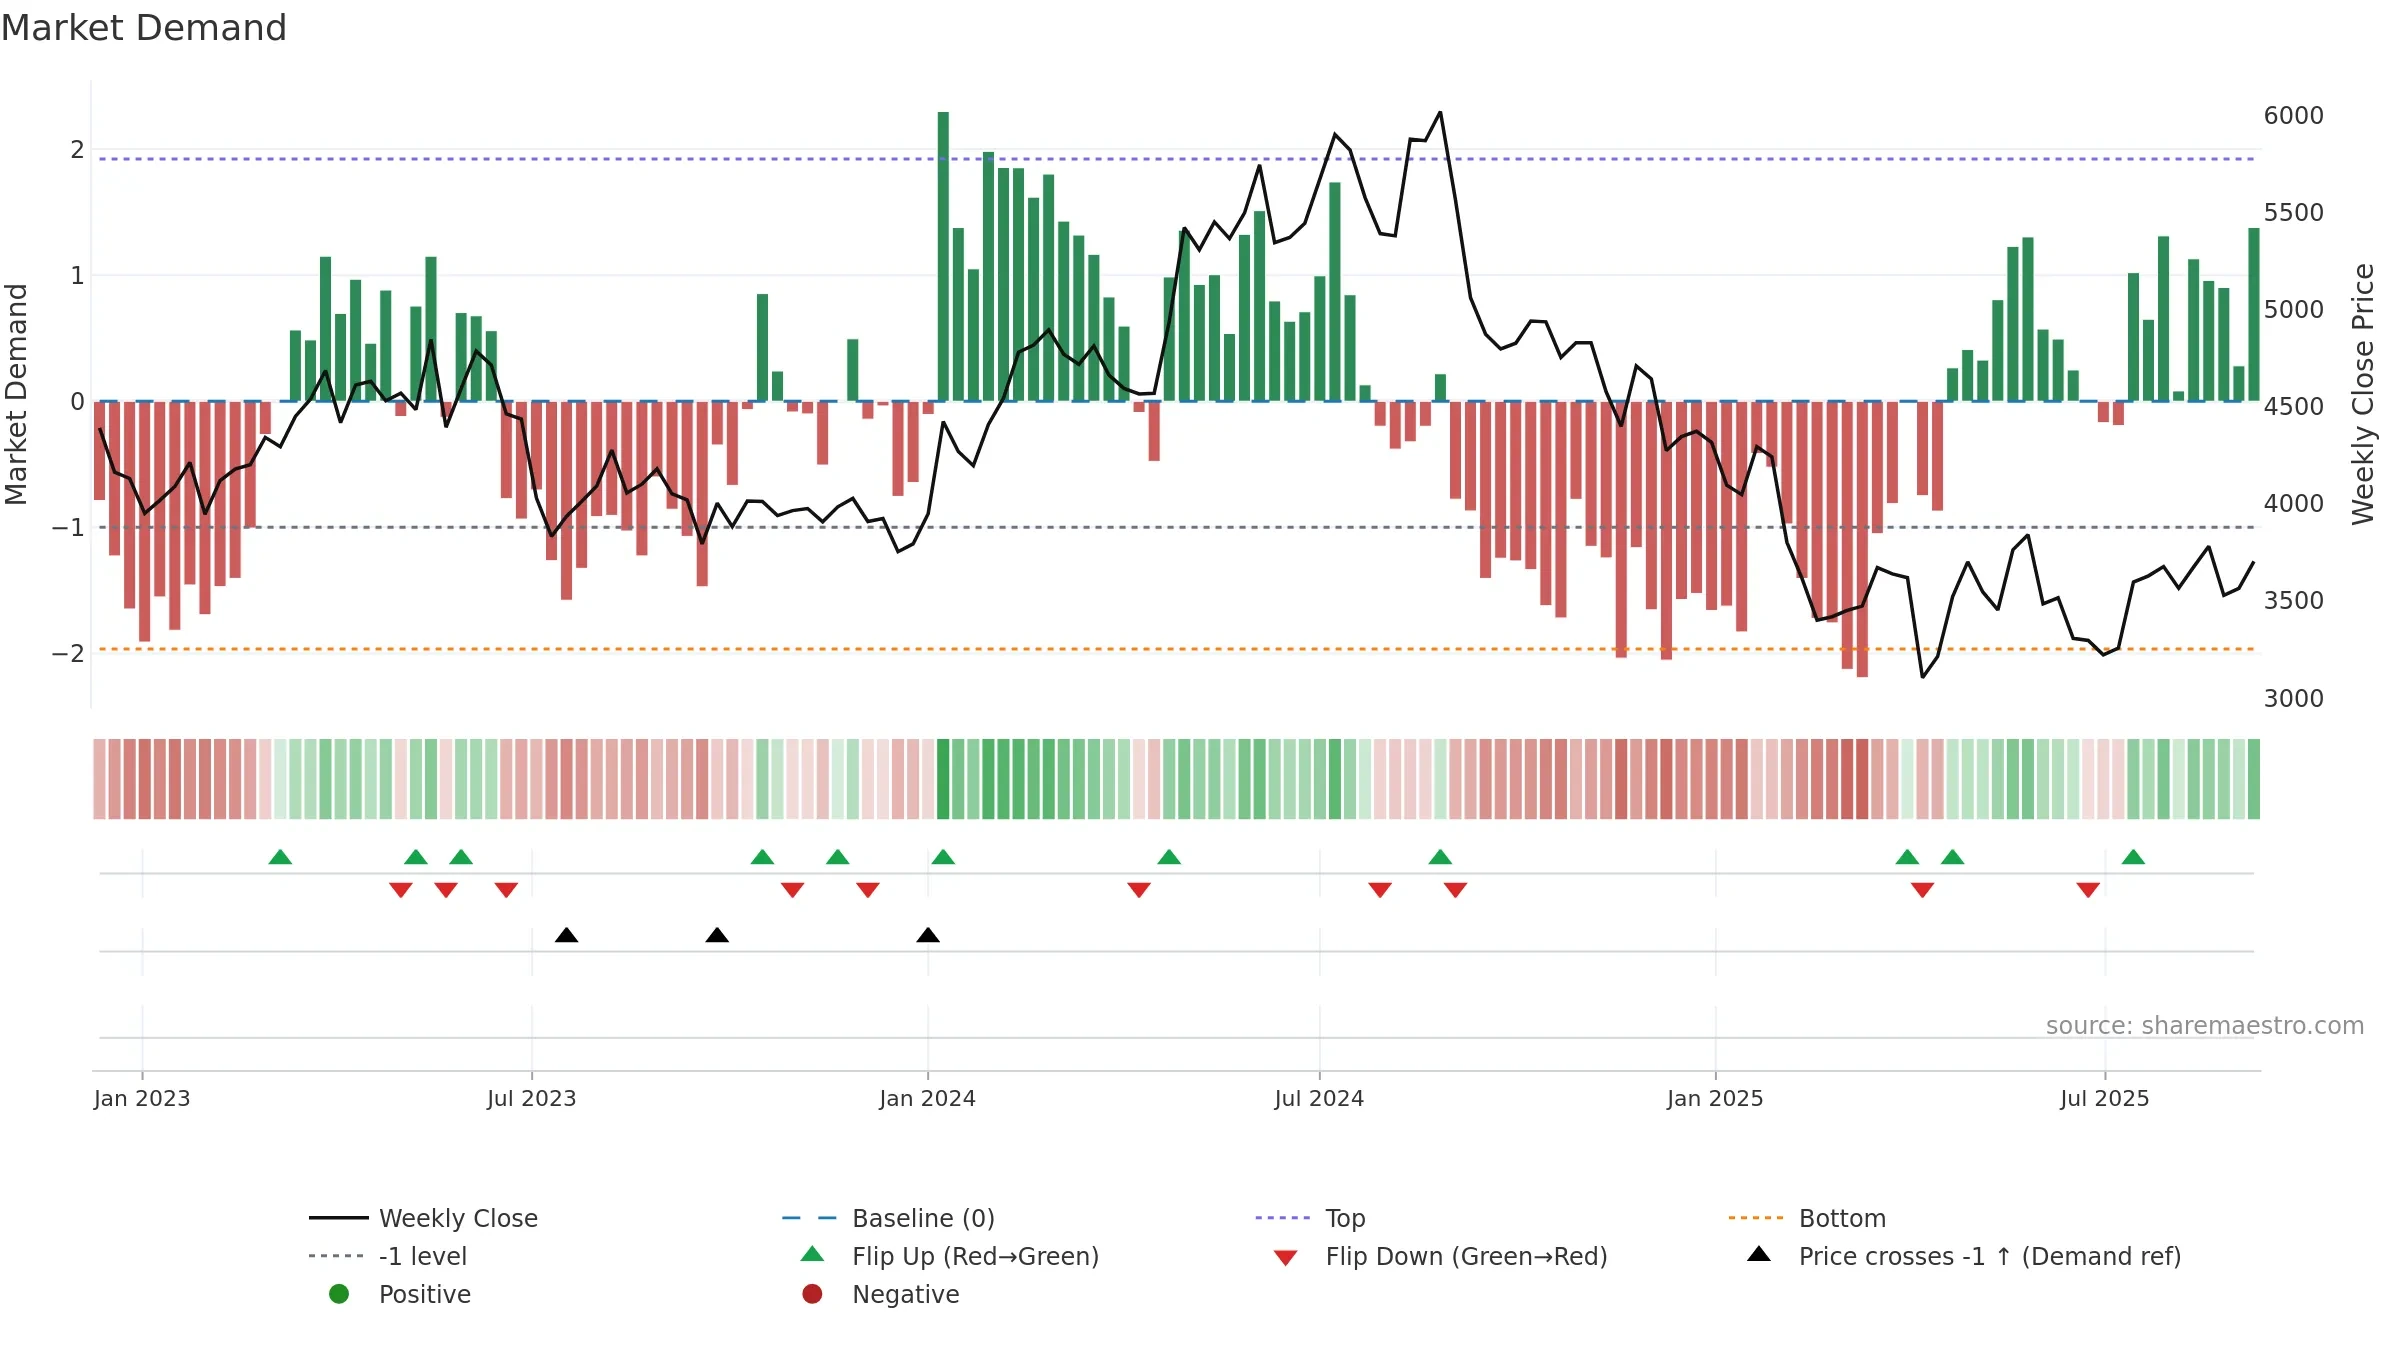
The flag is positive: favourable upside skew with supportive conditions.
Conclusion
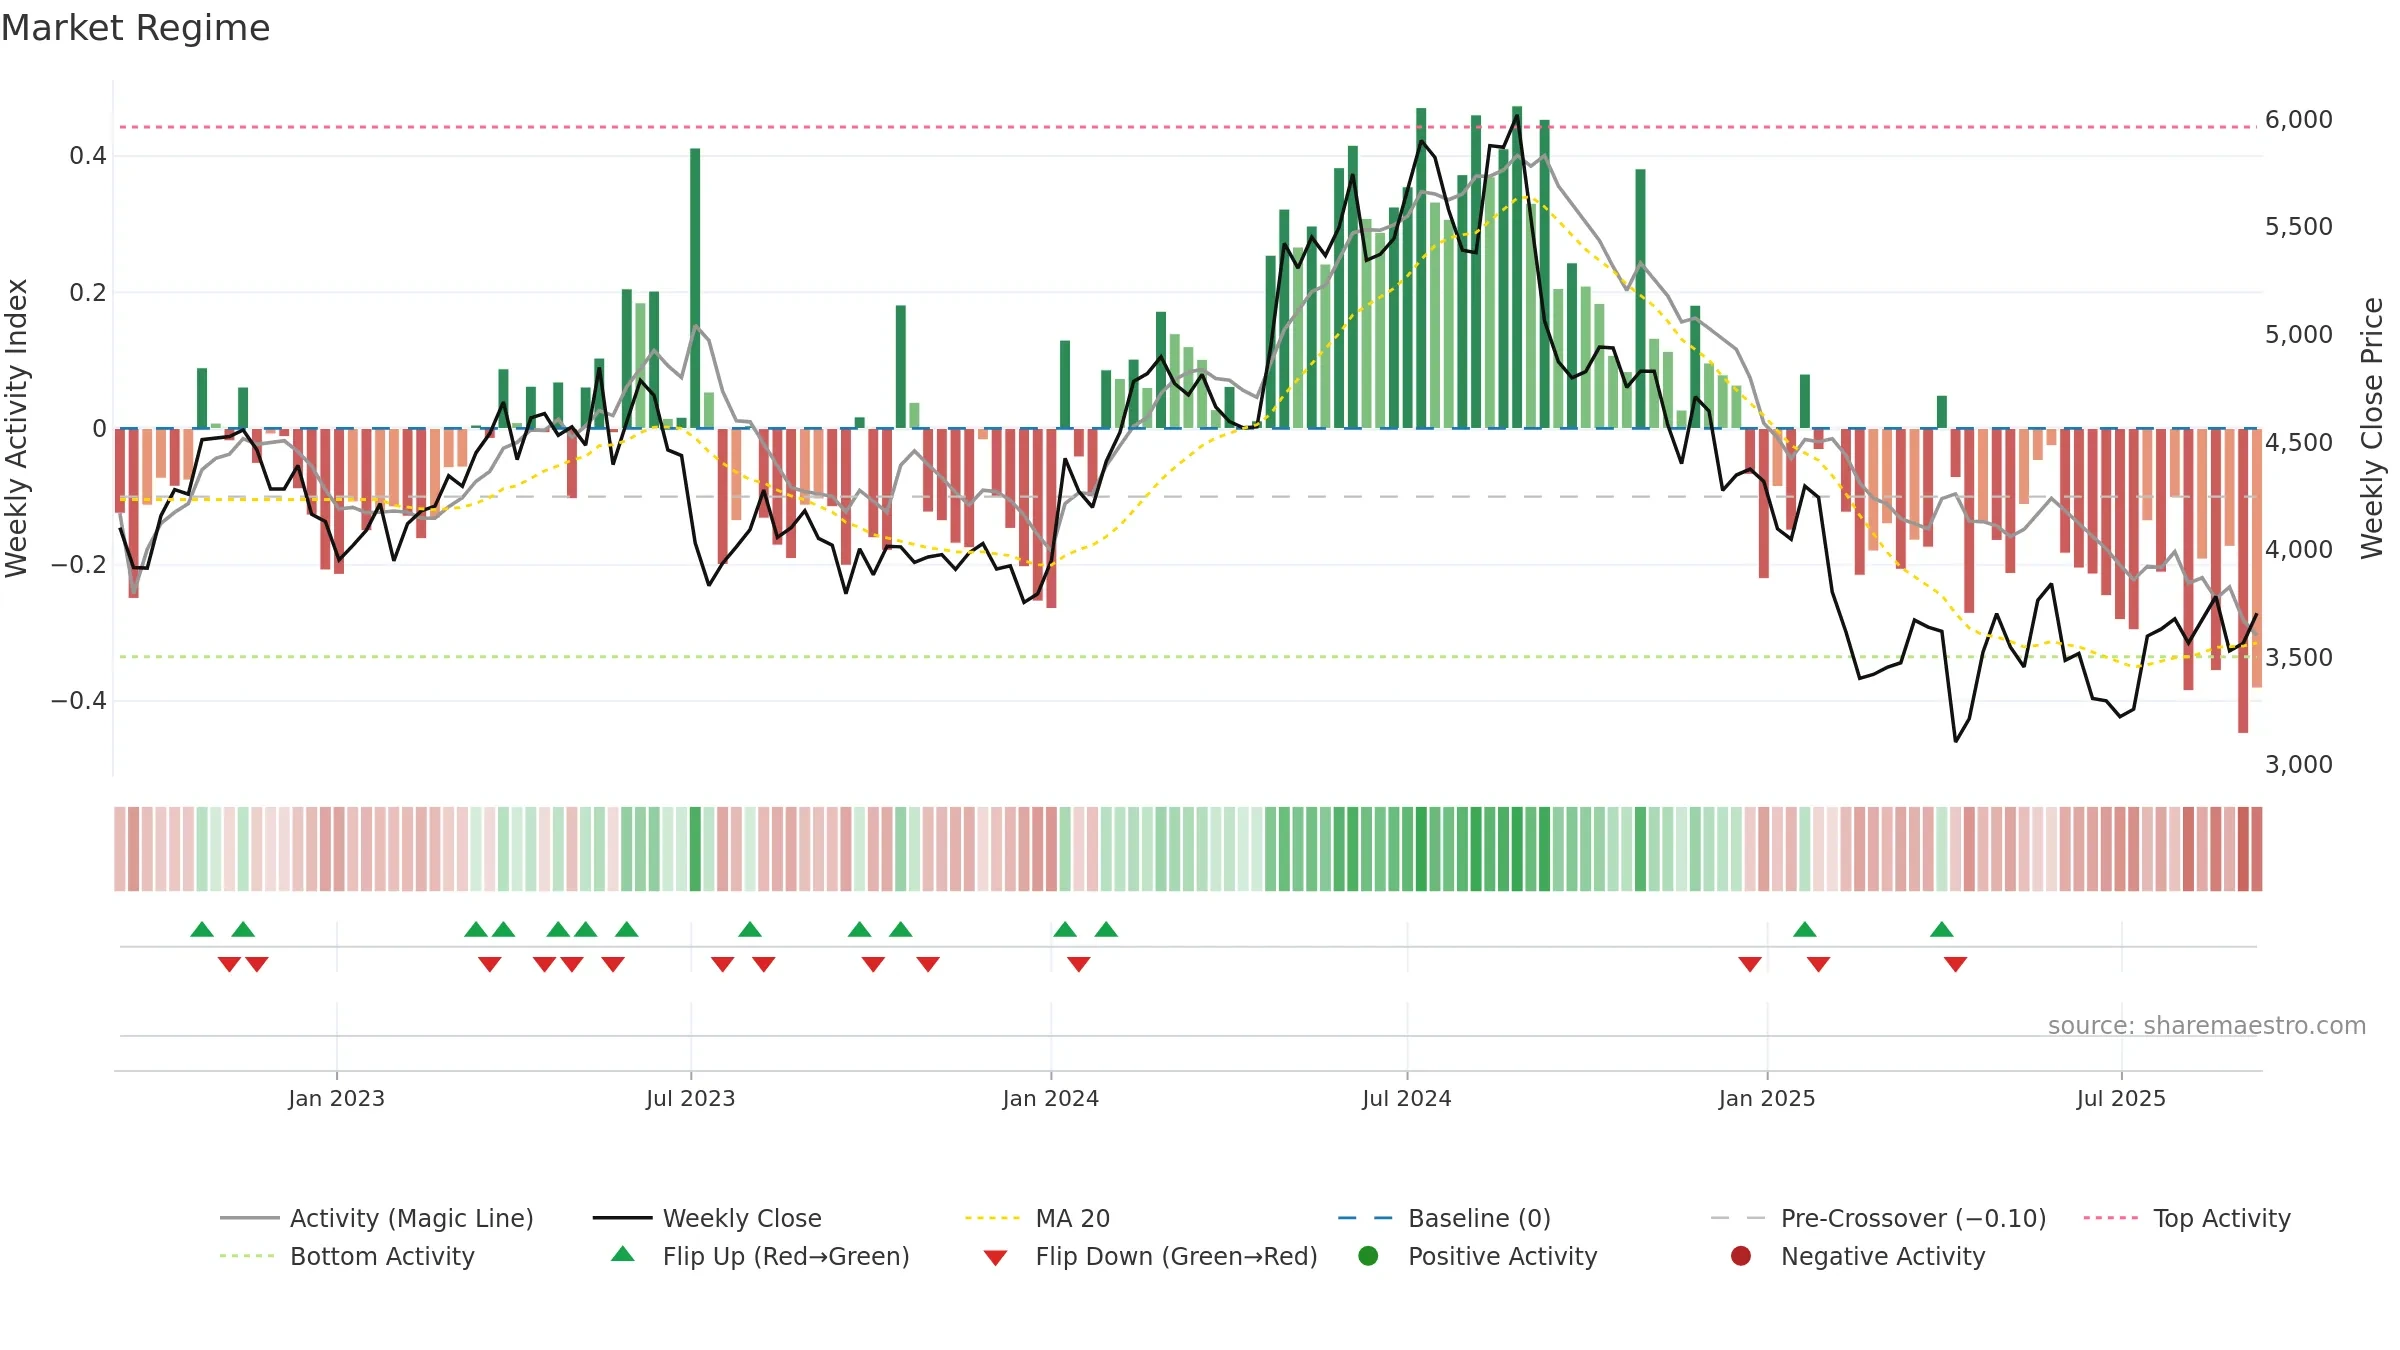
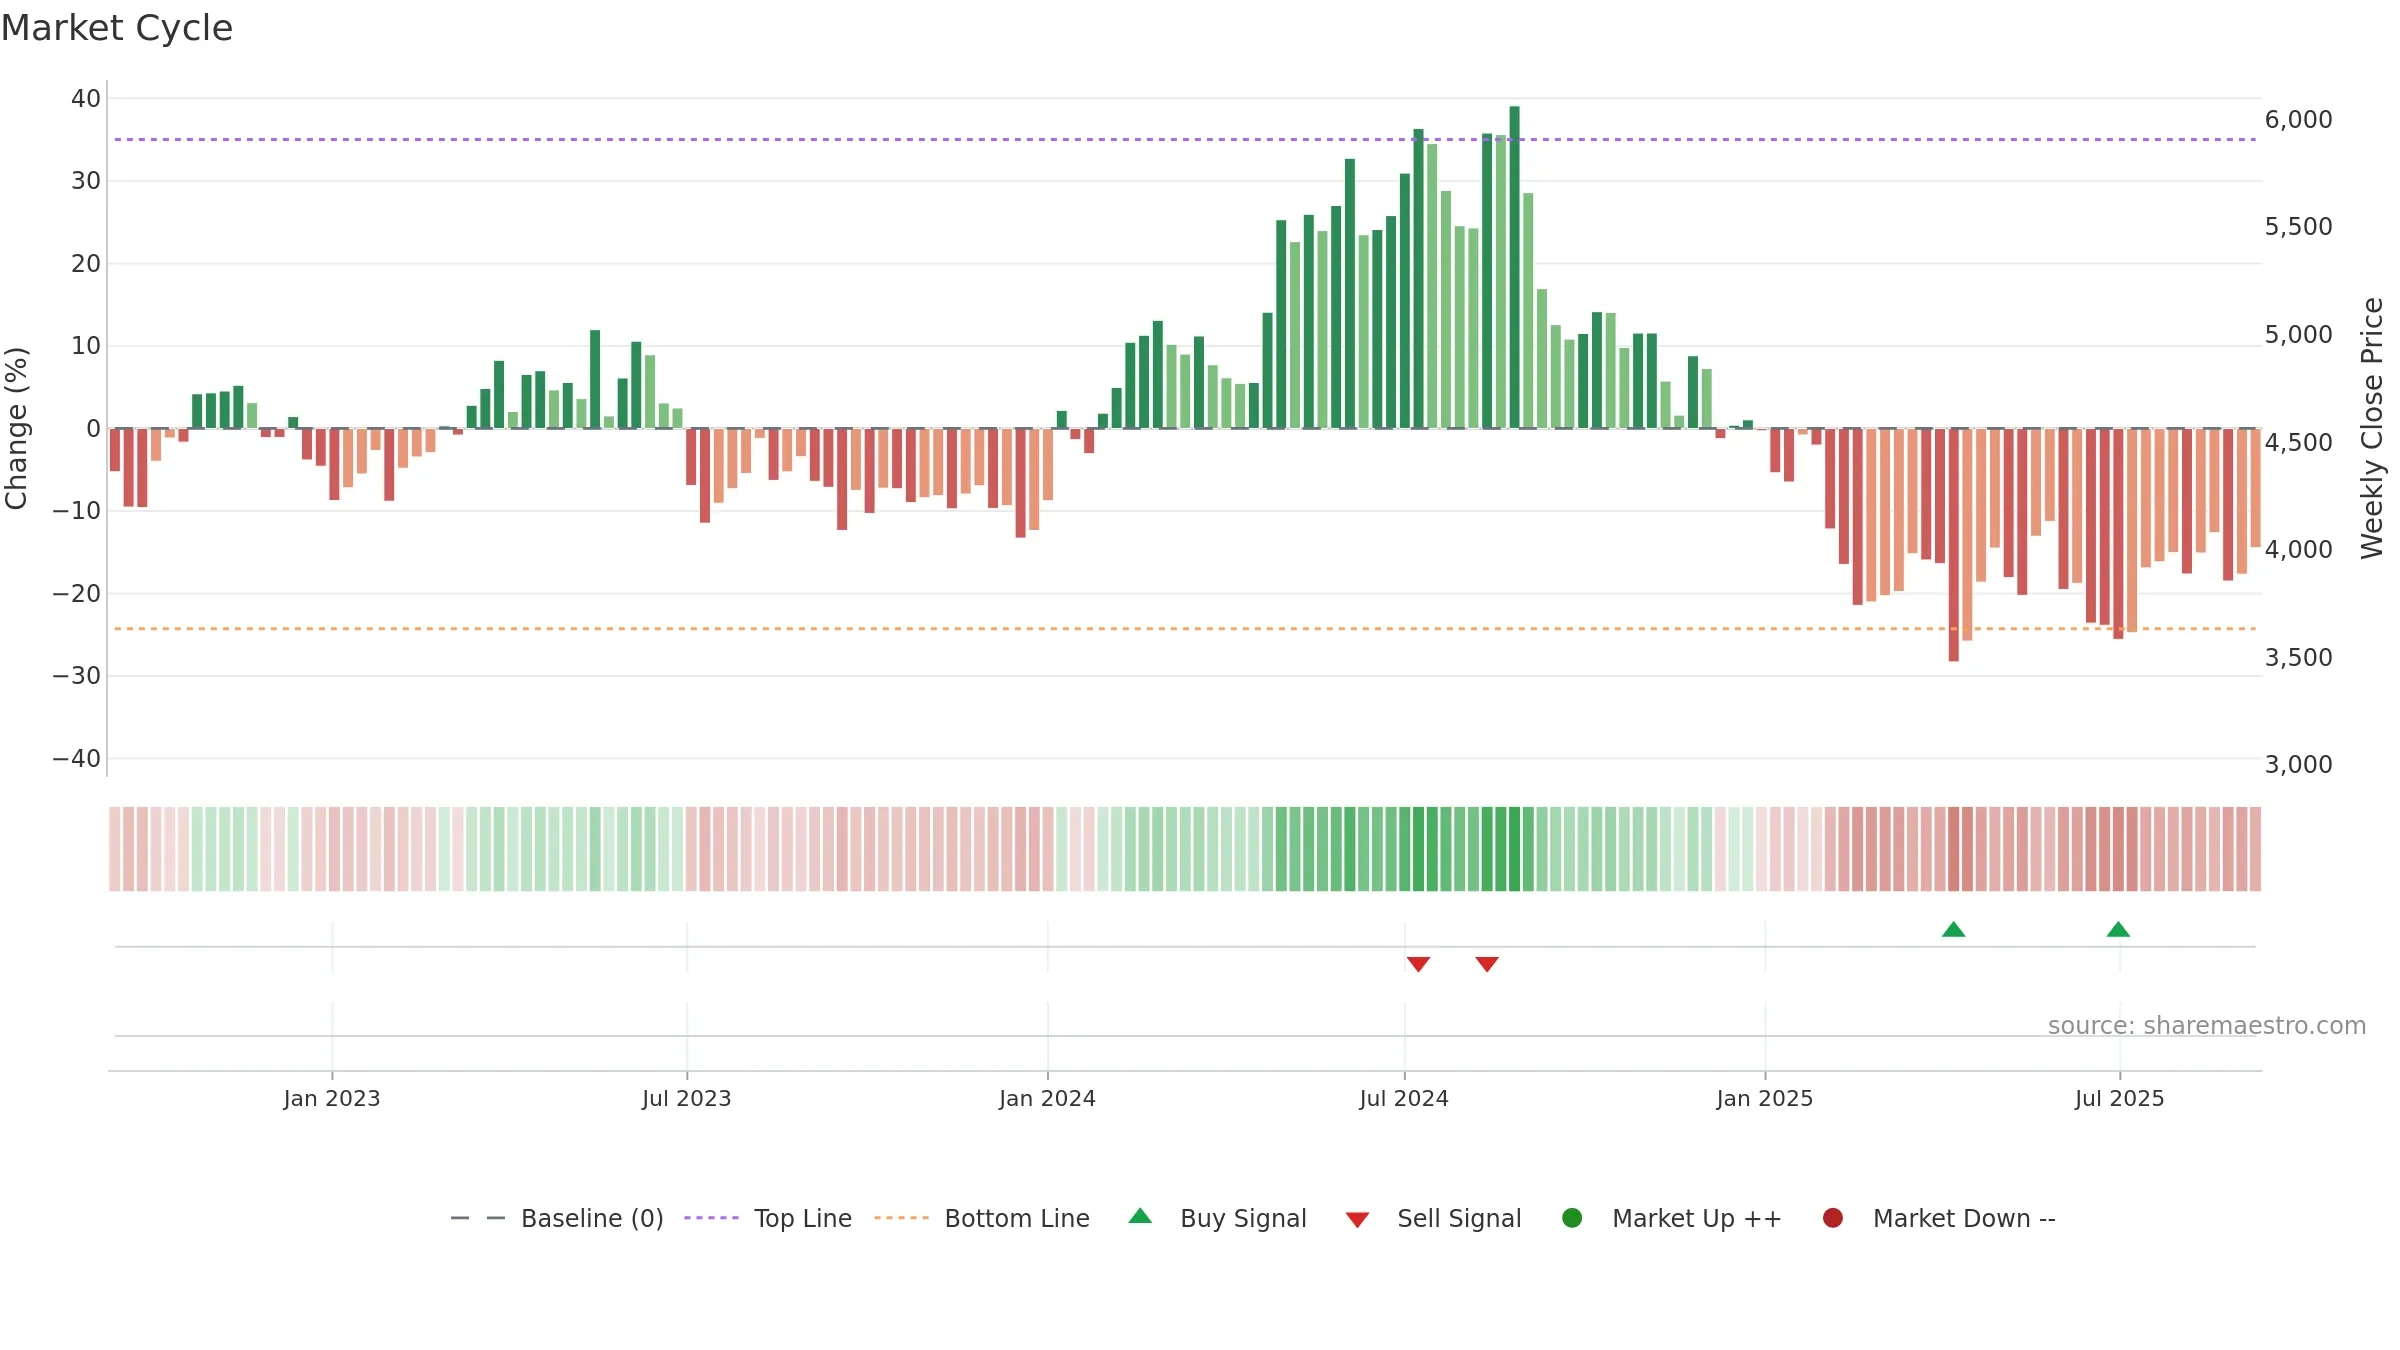
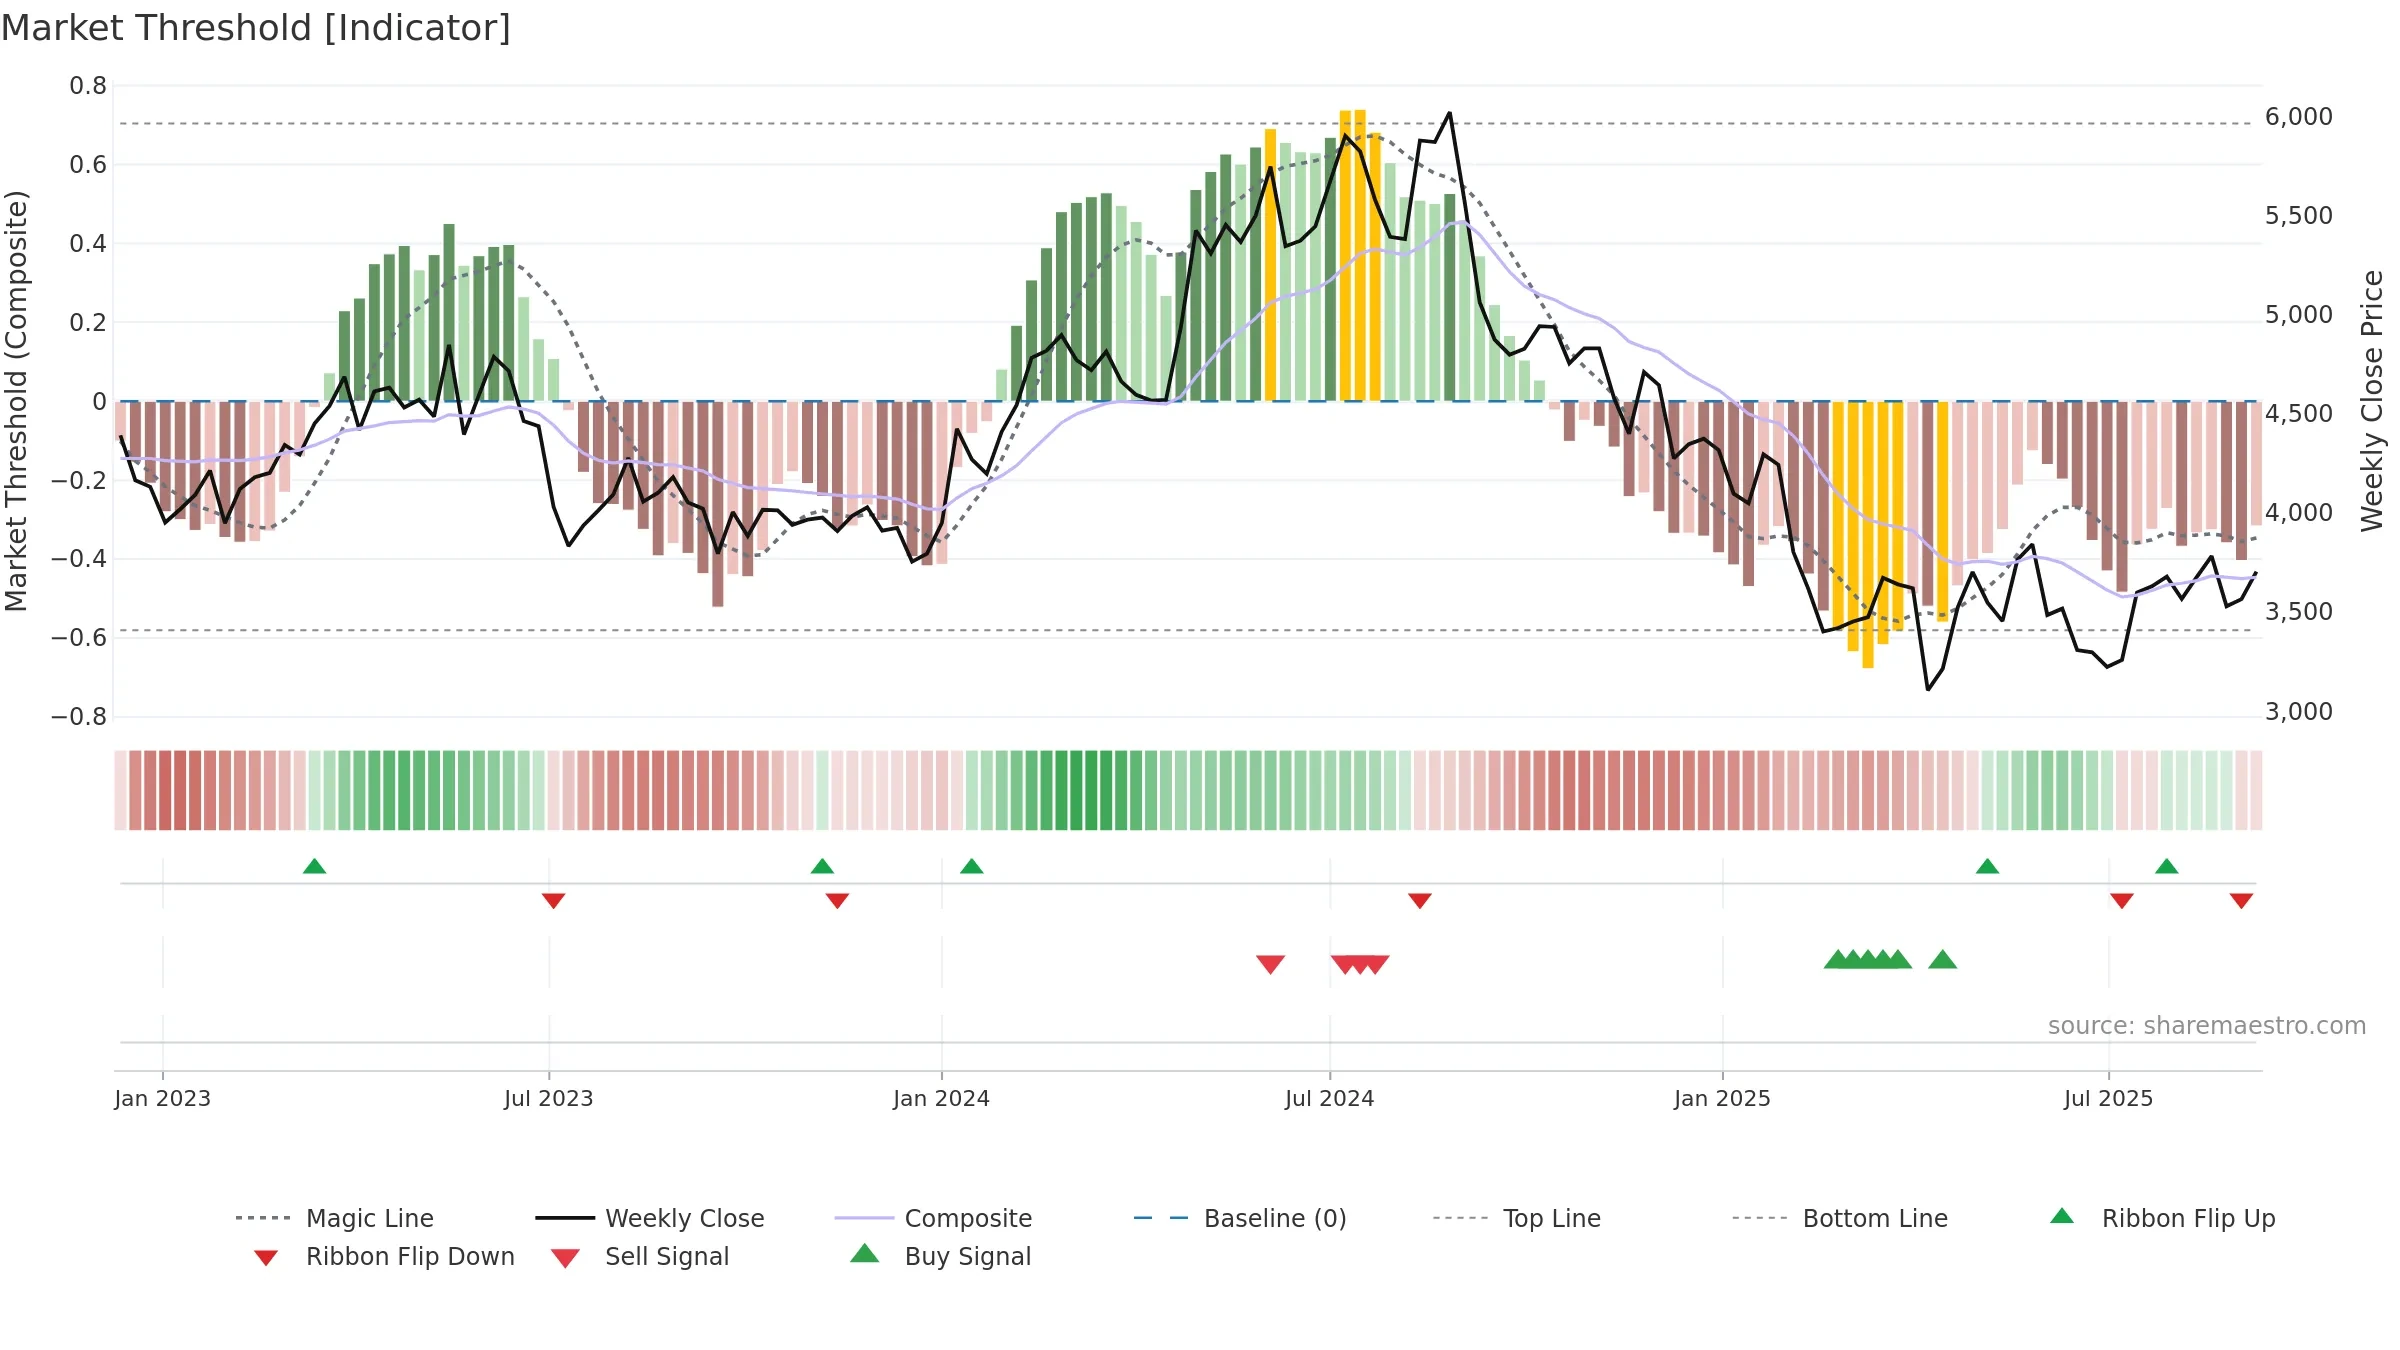
Positive setup. ★★★★☆ confidence. Price window: 2. Trend: Bottoming Attempt; gauge 36. In combination, liquidity confirms the move.
- Early improvement from bearish zone (bottoming attempt)
- Price holds above 8w & 26w averages
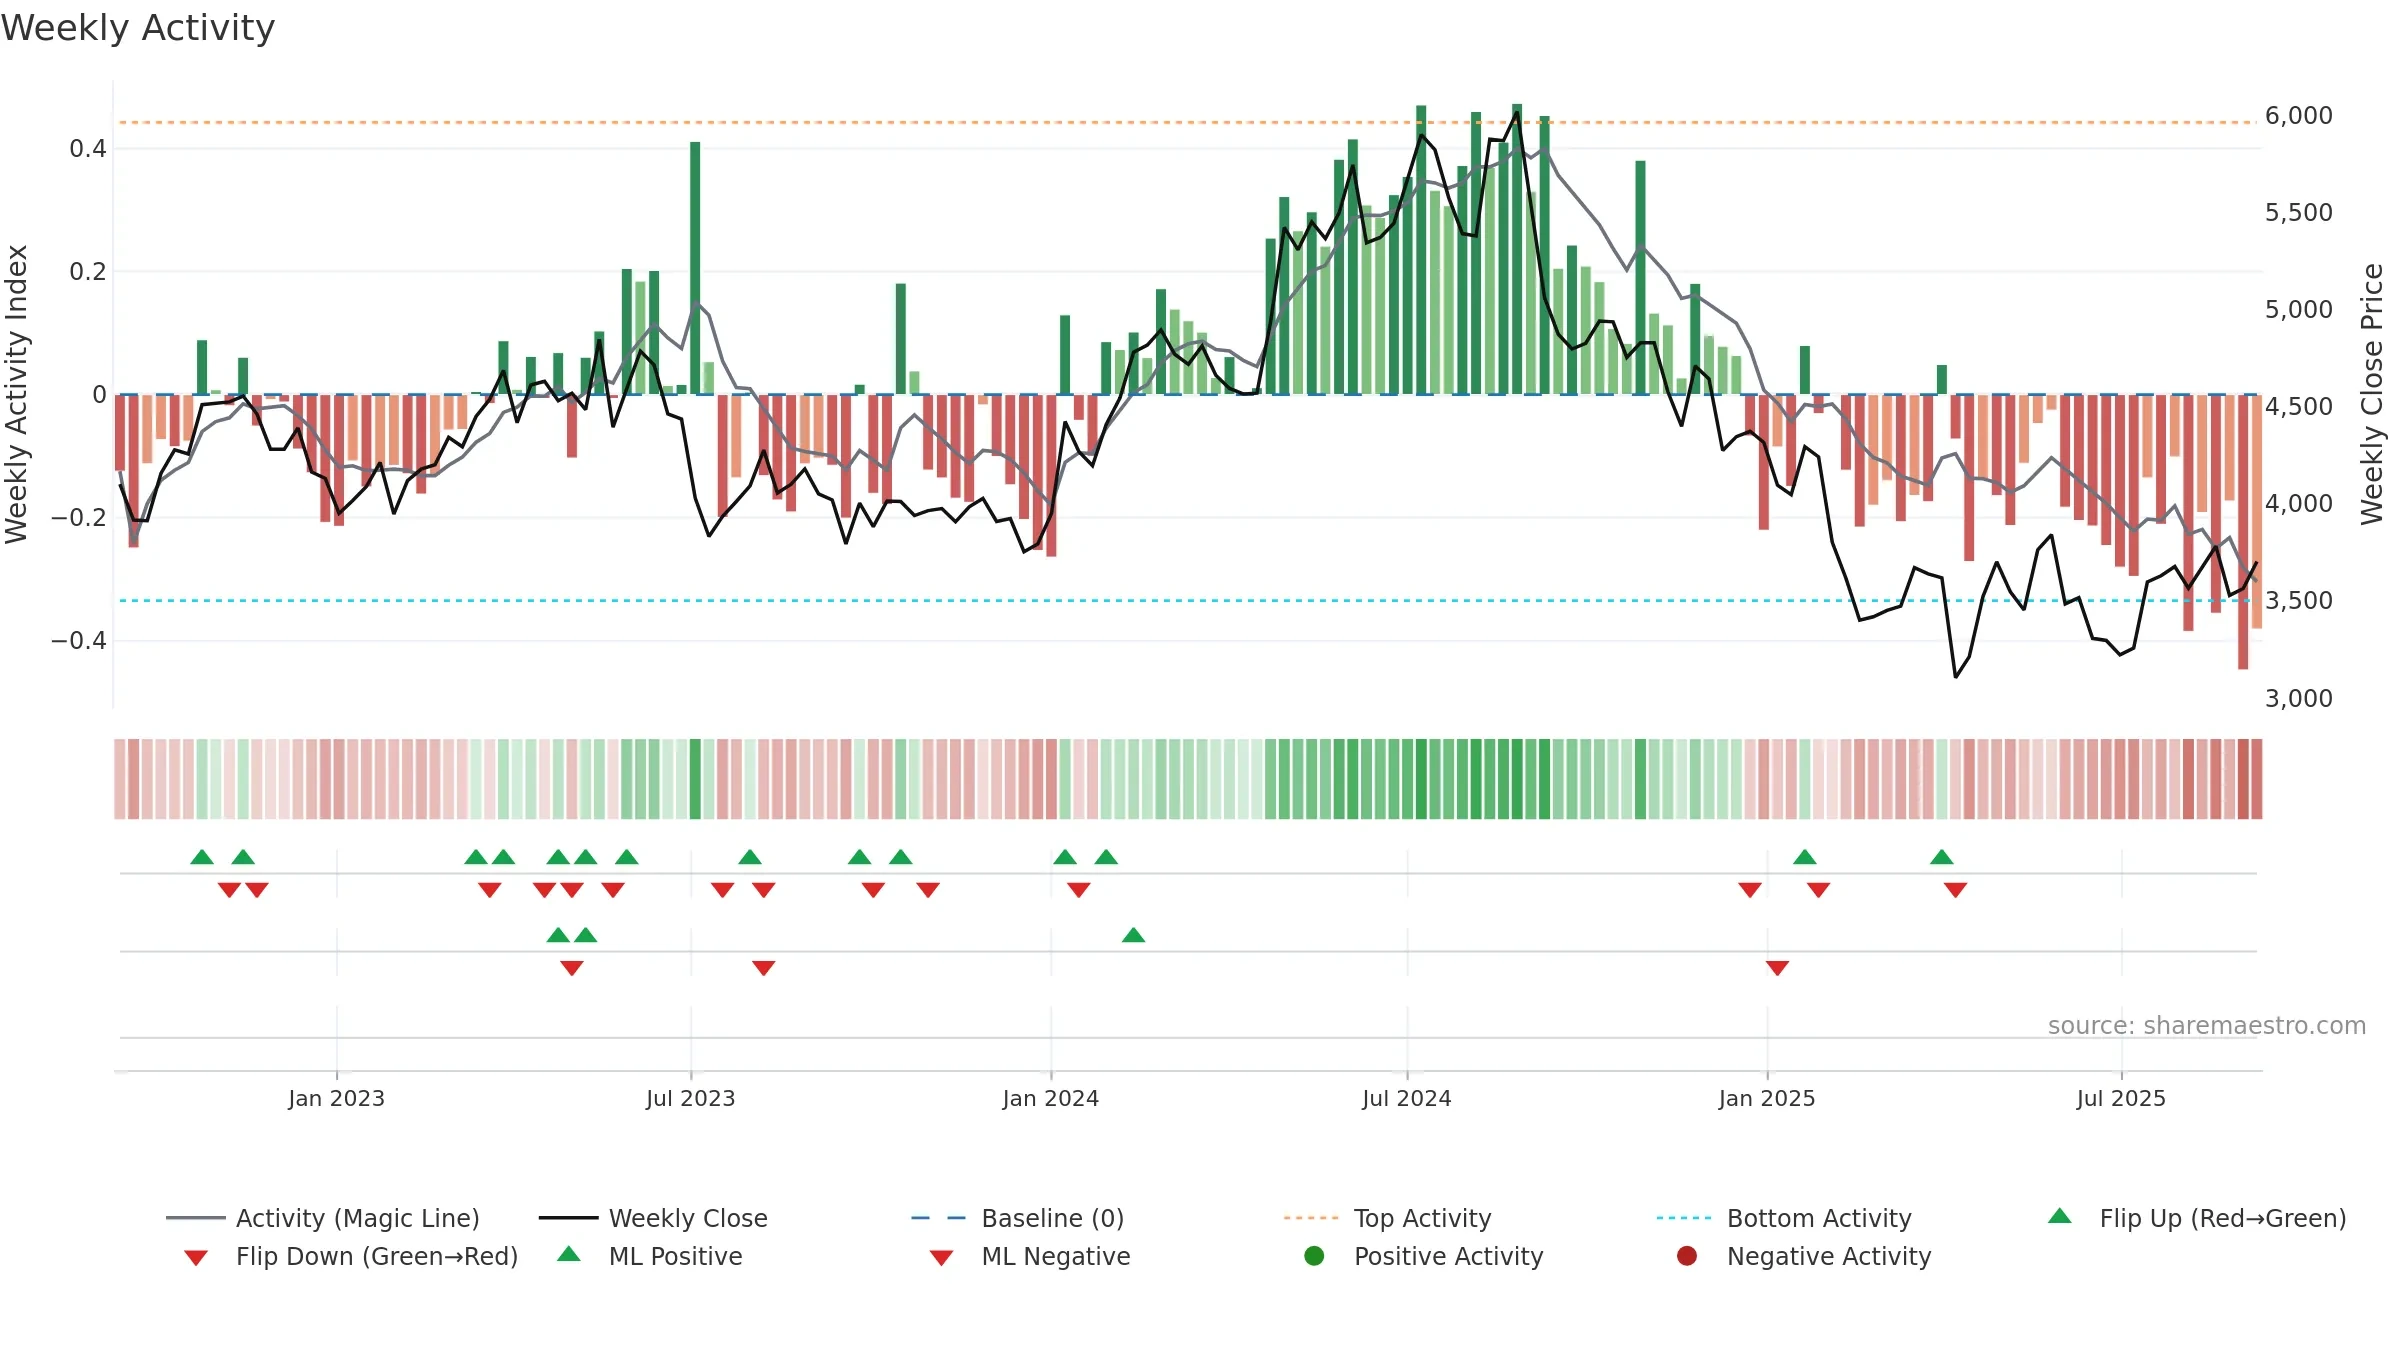
- Liquidity confirms the price trend
- Buyers step in at depressed levels (accumulation)
Why: Price window 2.04% over 8w. Close is -2.06% below the prior-window high. Volume trend falling. Liquidity convergence with price. Trend state bottoming attempt. Low-regime (≤0.25) upticks 4/6 (67.0%) • Accumulating. Momentum neutral and rising. Valuation stance positive.
Tip: Most metrics include a hover tooltip where they appear in the report.