Gansu Golden Solar Co., Ltd
300093 SHE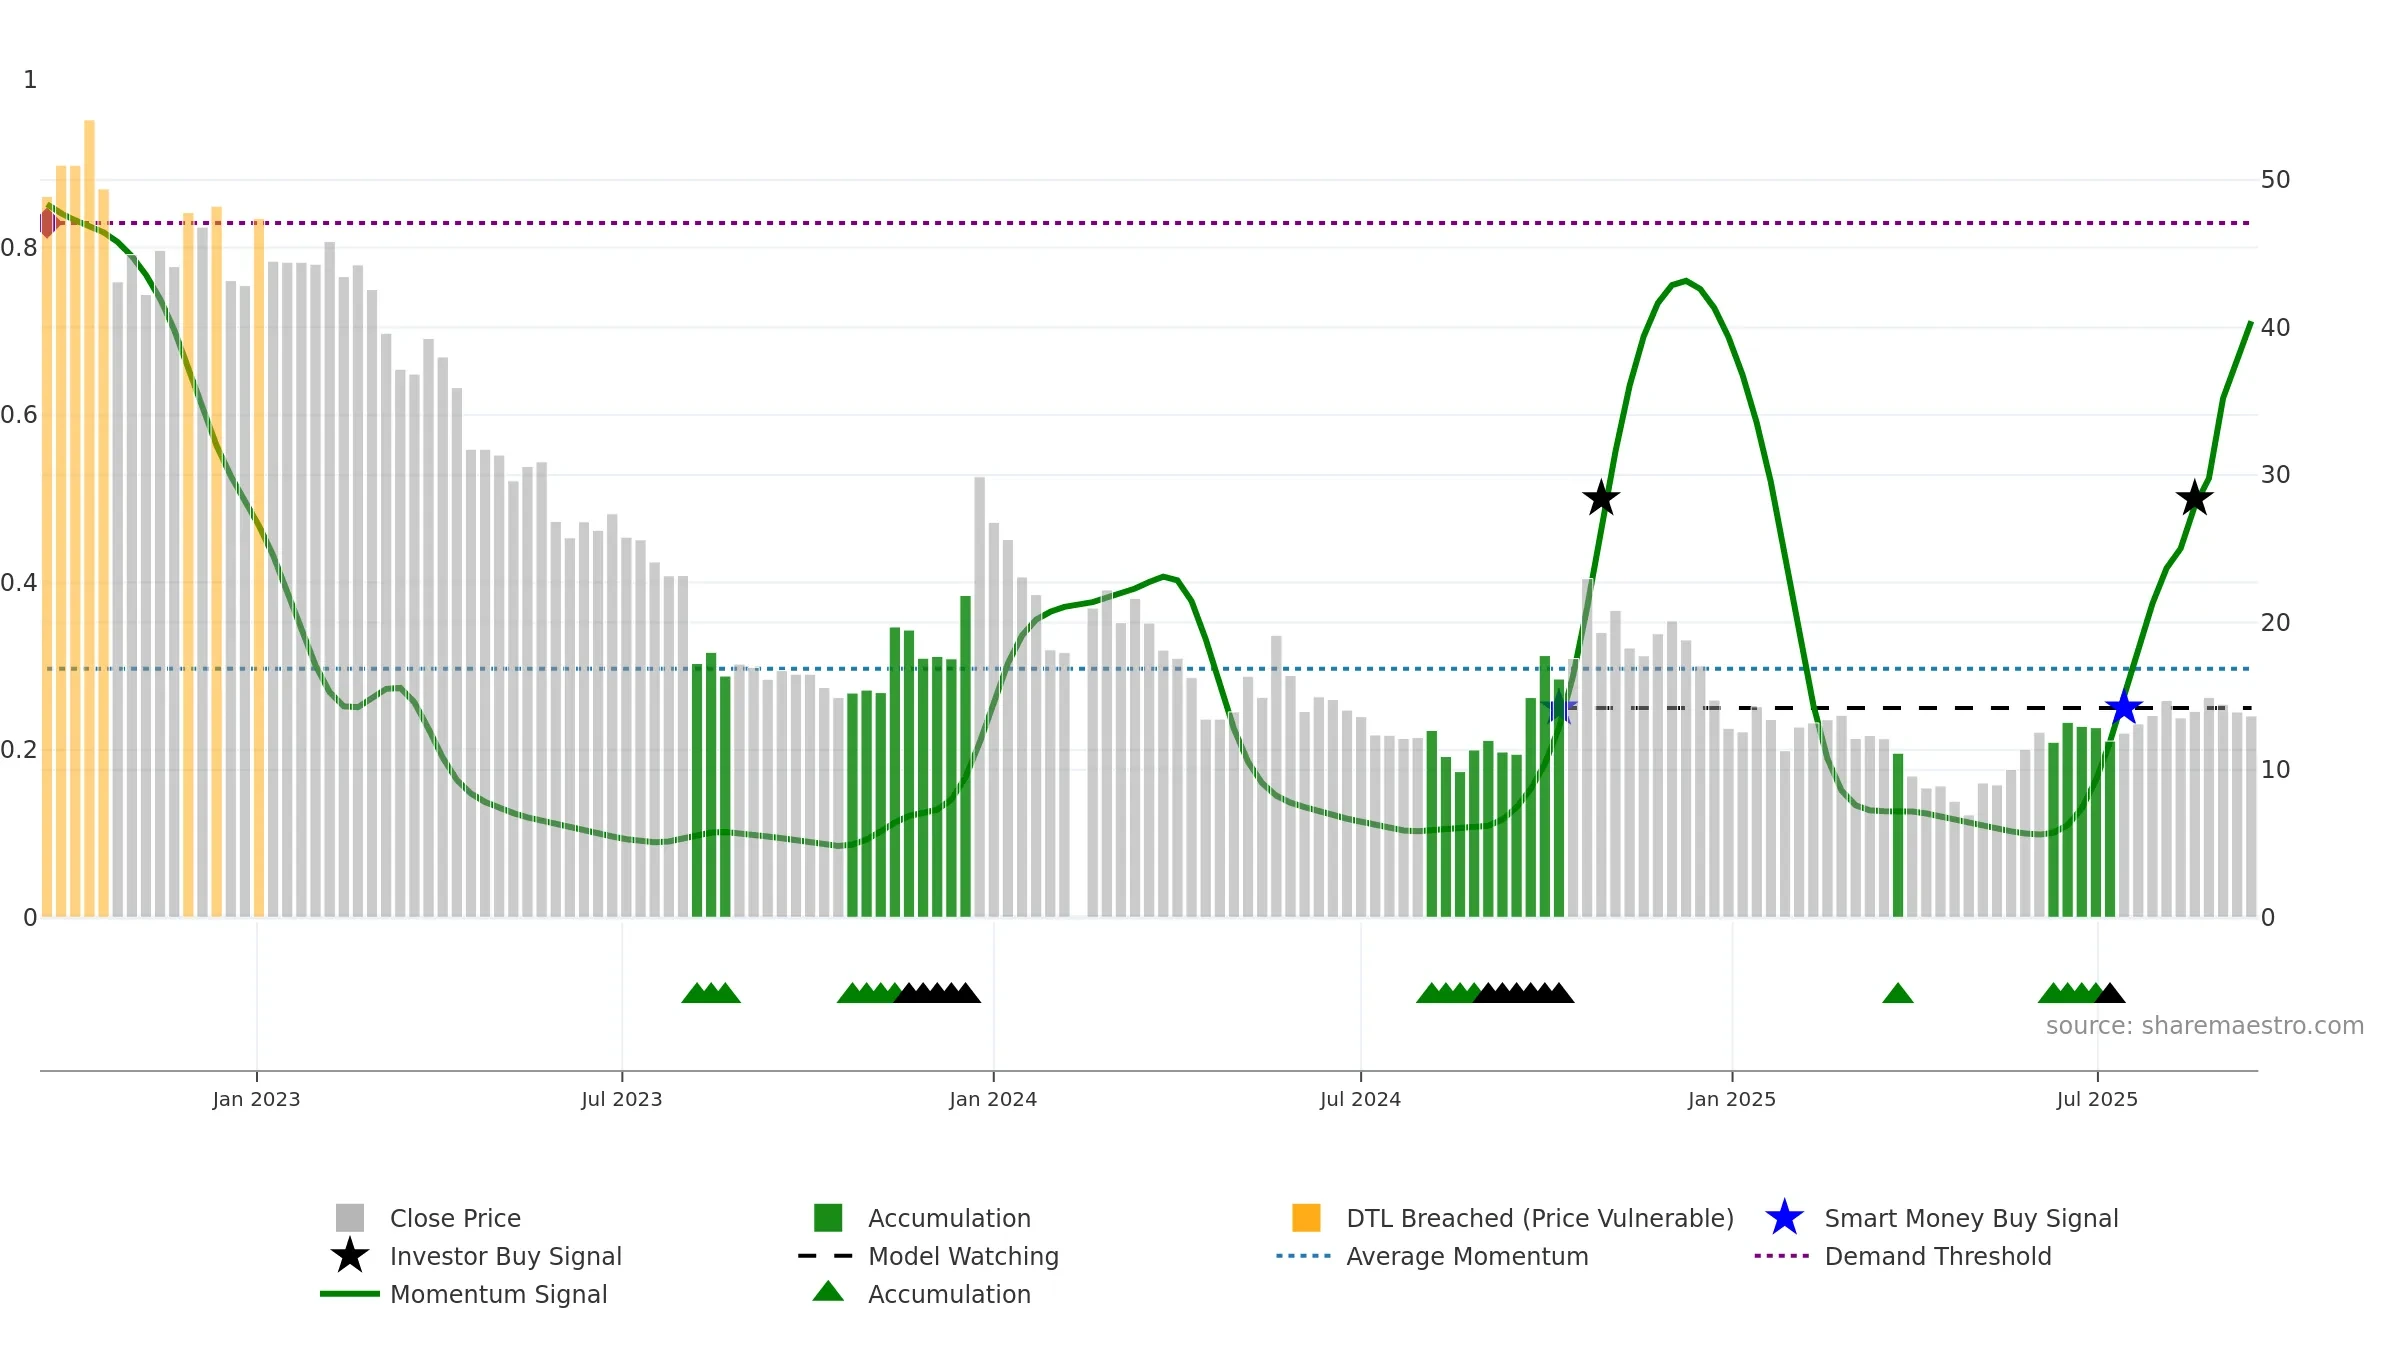
Weekly Report
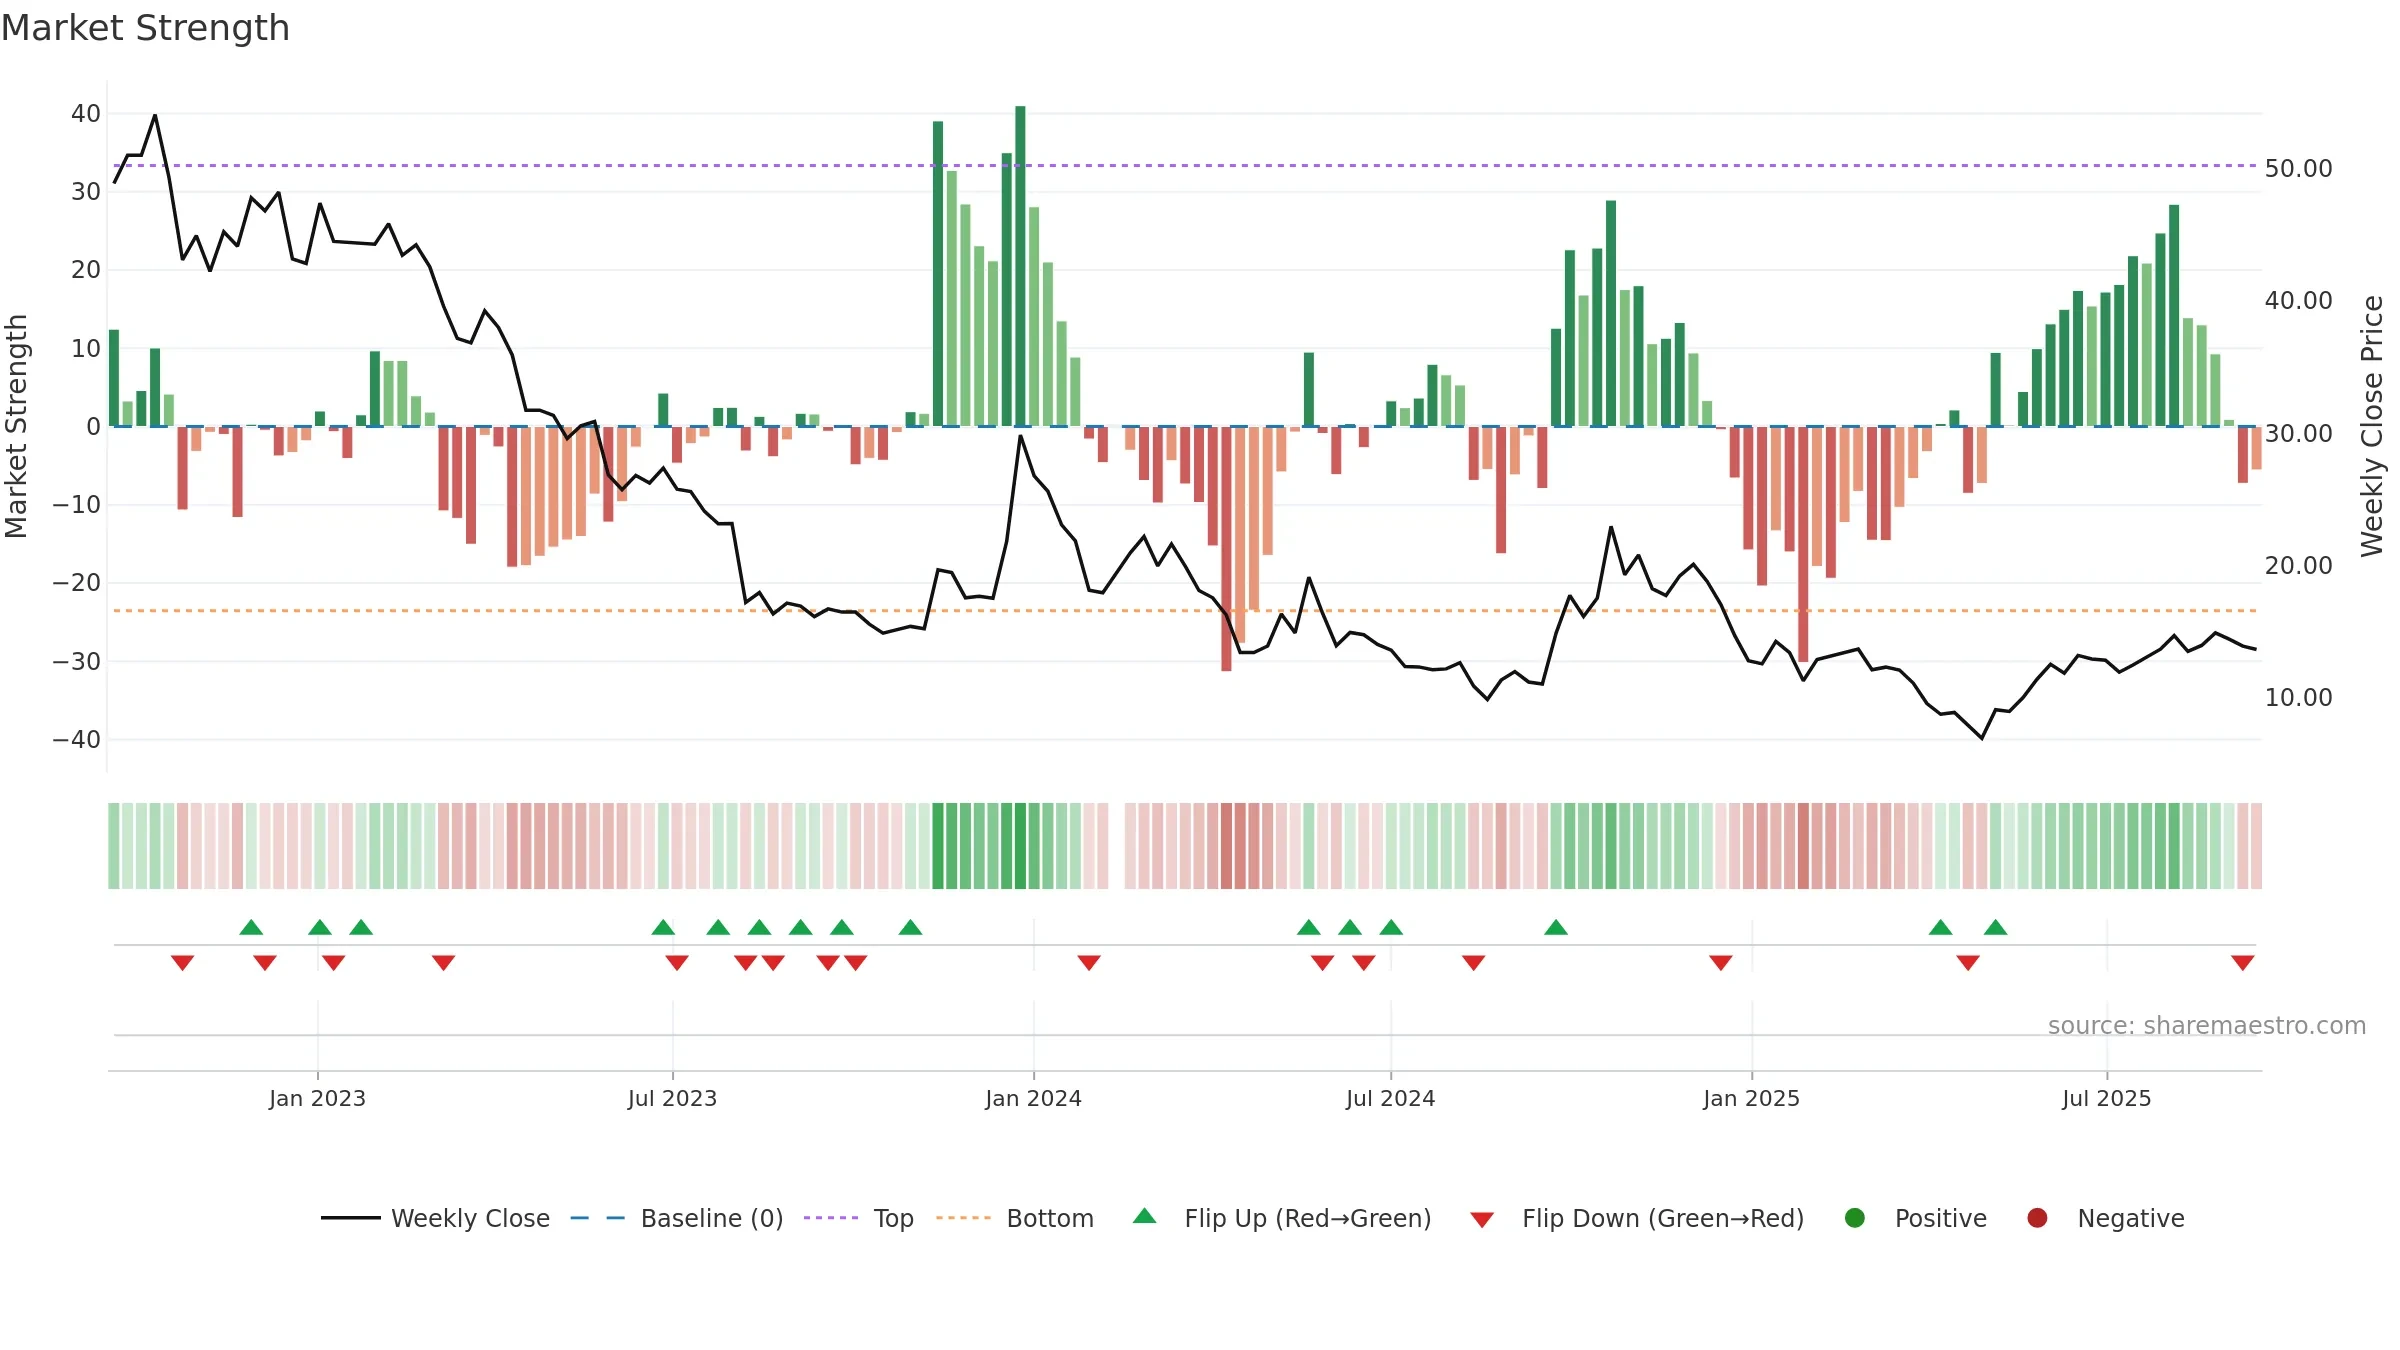
Gansu Golden Solar Co., Ltd closed at 13.6600 (-2.01% WoW) . Data window ends Mon, 15 Sep 2025.
How to read this — Price slope is downward, indicating persistent supply pressure. Elevated weekly volatility increases whipsaw risk. Volume and price are moving in the same direction — a constructive confirmation. Returns are positively correlated with volume — strength tends to arrive on higher activity. Constructive MA stack supports the up-drift; pullbacks may find support at the 8–13 week region.
Down-slope argues for patience; rallies can fade sooner unless participation improves.
Gauge maps the trend signal to a 0–100 scale.
How to read this — High gauge and rising momentum — buyers in control.
Bias remains higher; pullbacks could be buyable if participation holds.
Price is above fair value; upside may be capped without catalysts.
Conclusion
Neutral setup. ★★★☆☆ confidence. Price window: -0. Trend: Strong Uptrend; gauge 71. In combination, liquidity confirms the move.
- High gauge with rising momentum (strong uptrend)
- Momentum is bullish and rising
- Constructive moving-average stack
- Liquidity confirms the price trend
- Price is not above key averages
- High return volatility raises whipsaw risk
- Negative multi-week performance
Why: Price window -0.22% over 8w. Close is -8.45% below the prior-window high. Return volatility 6.28%. Volume trend falling. Liquidity convergence with price. Trend state strong uptrend. MA stack constructive. Momentum bullish and rising. Valuation limited upside without catalysts.
Tip: Most metrics include a hover tooltip where they appear in the report.