Prime Oil Chemical Service Corporation
2904 TPE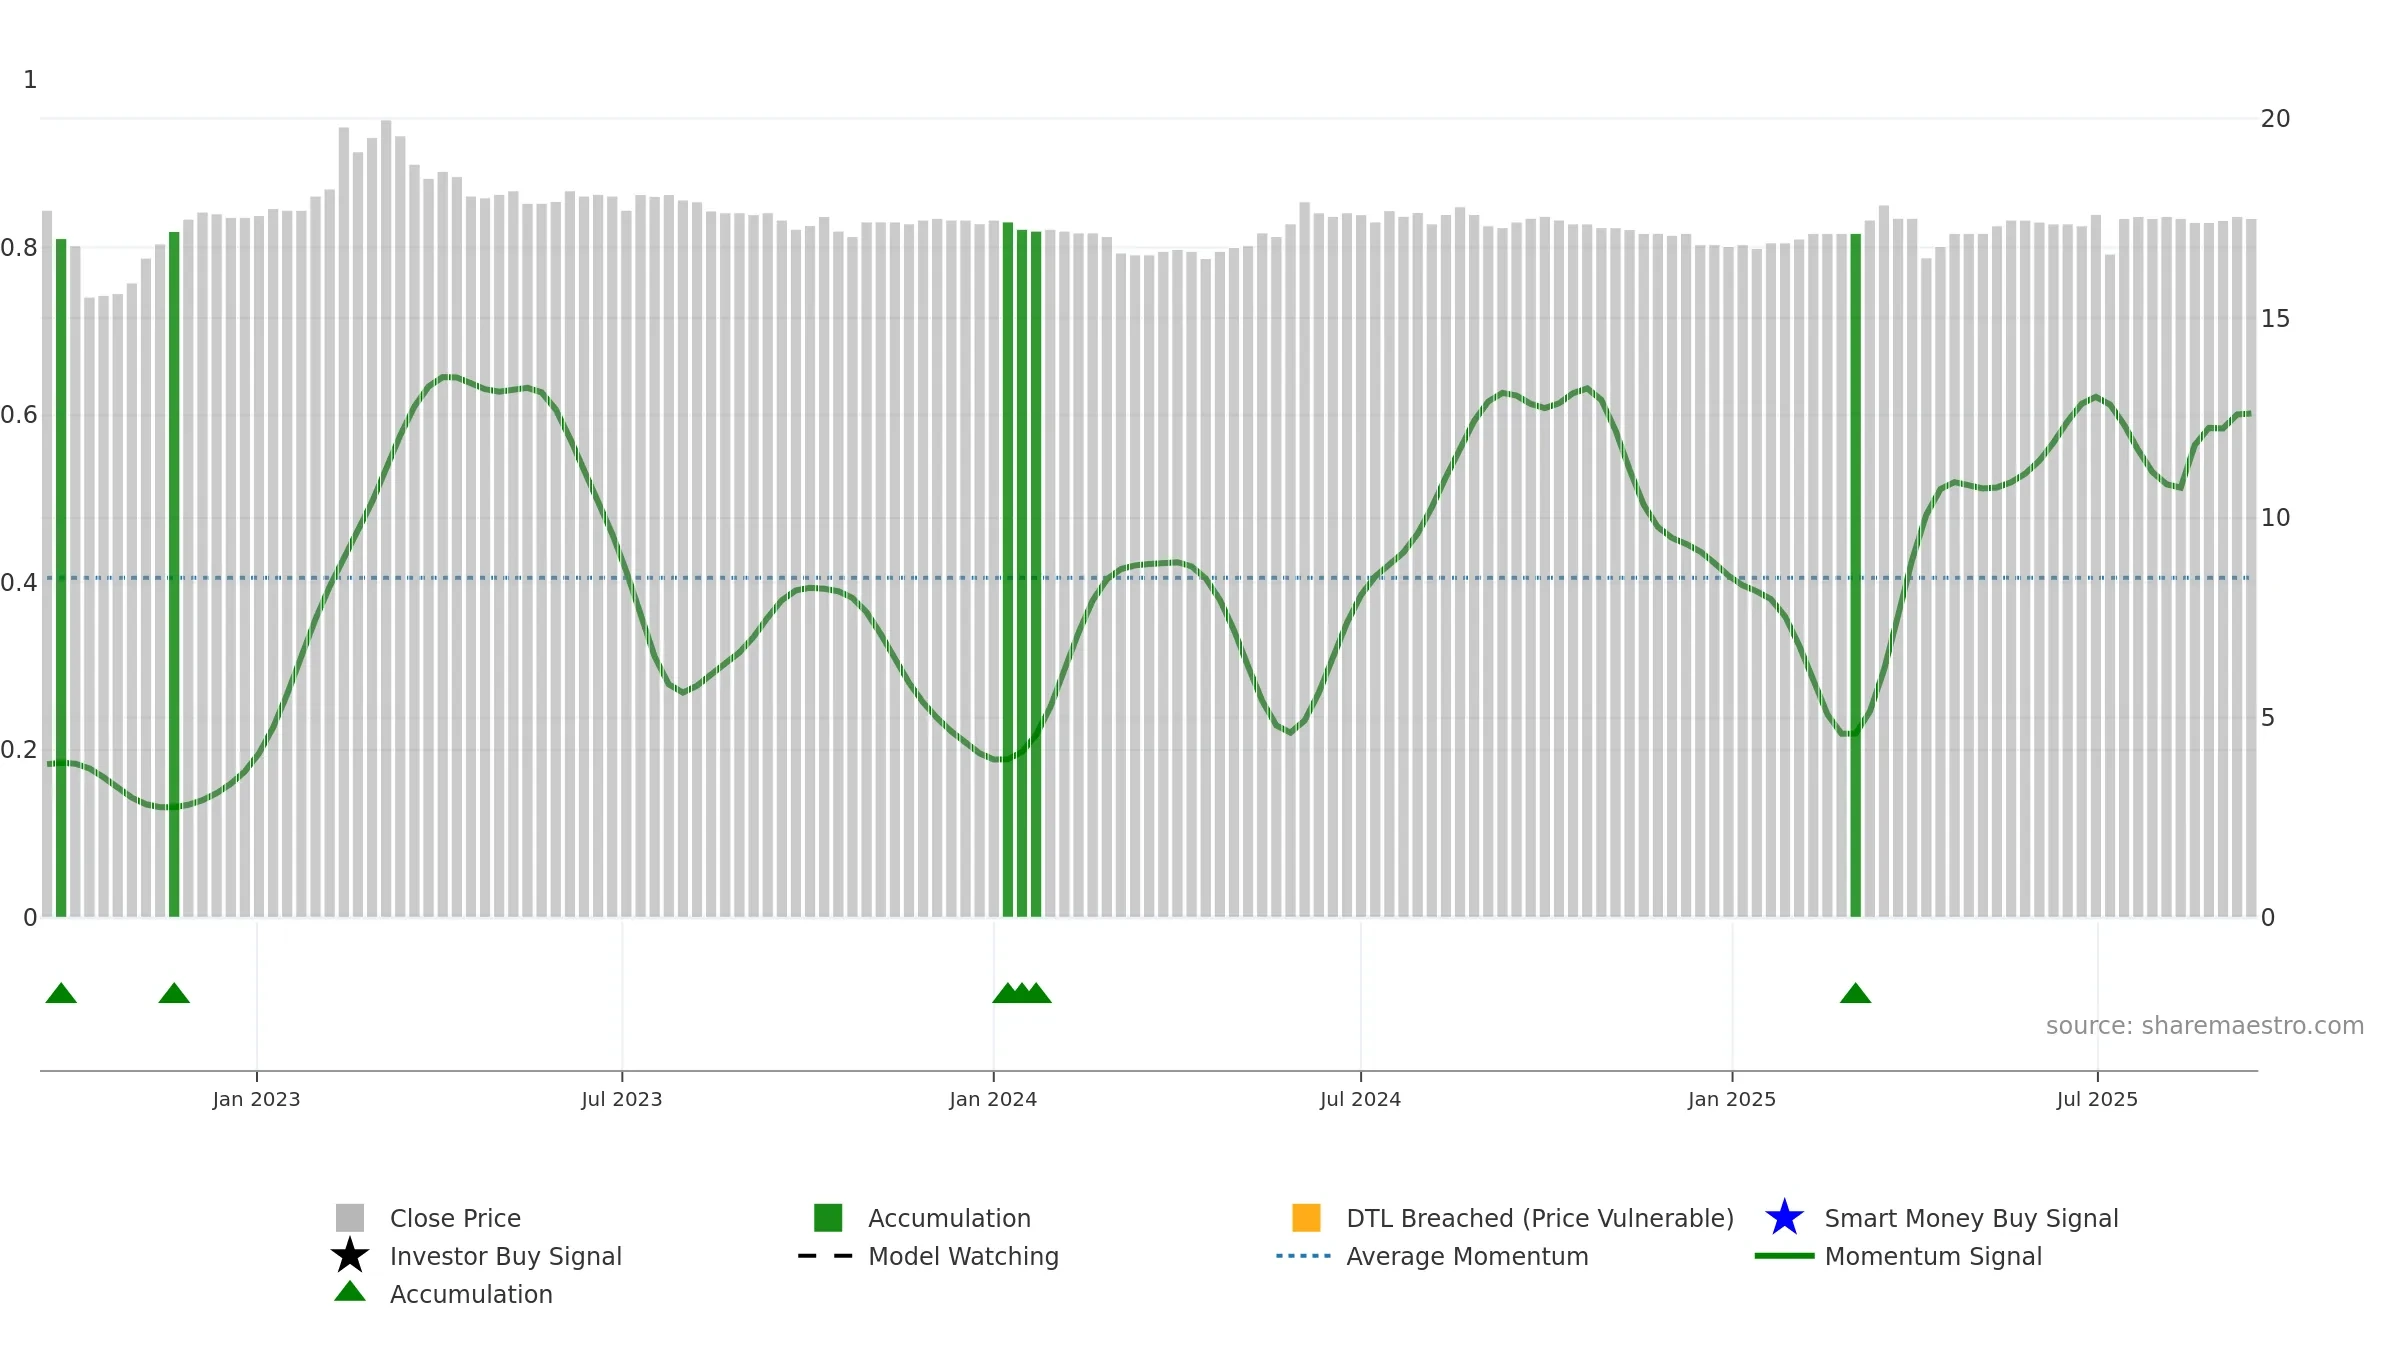
Weekly Report
Prime Oil Chemical Service Corporation closed at 17.5000 (-0.28% WoW) . Data window ends Mon, 15 Sep 2025.
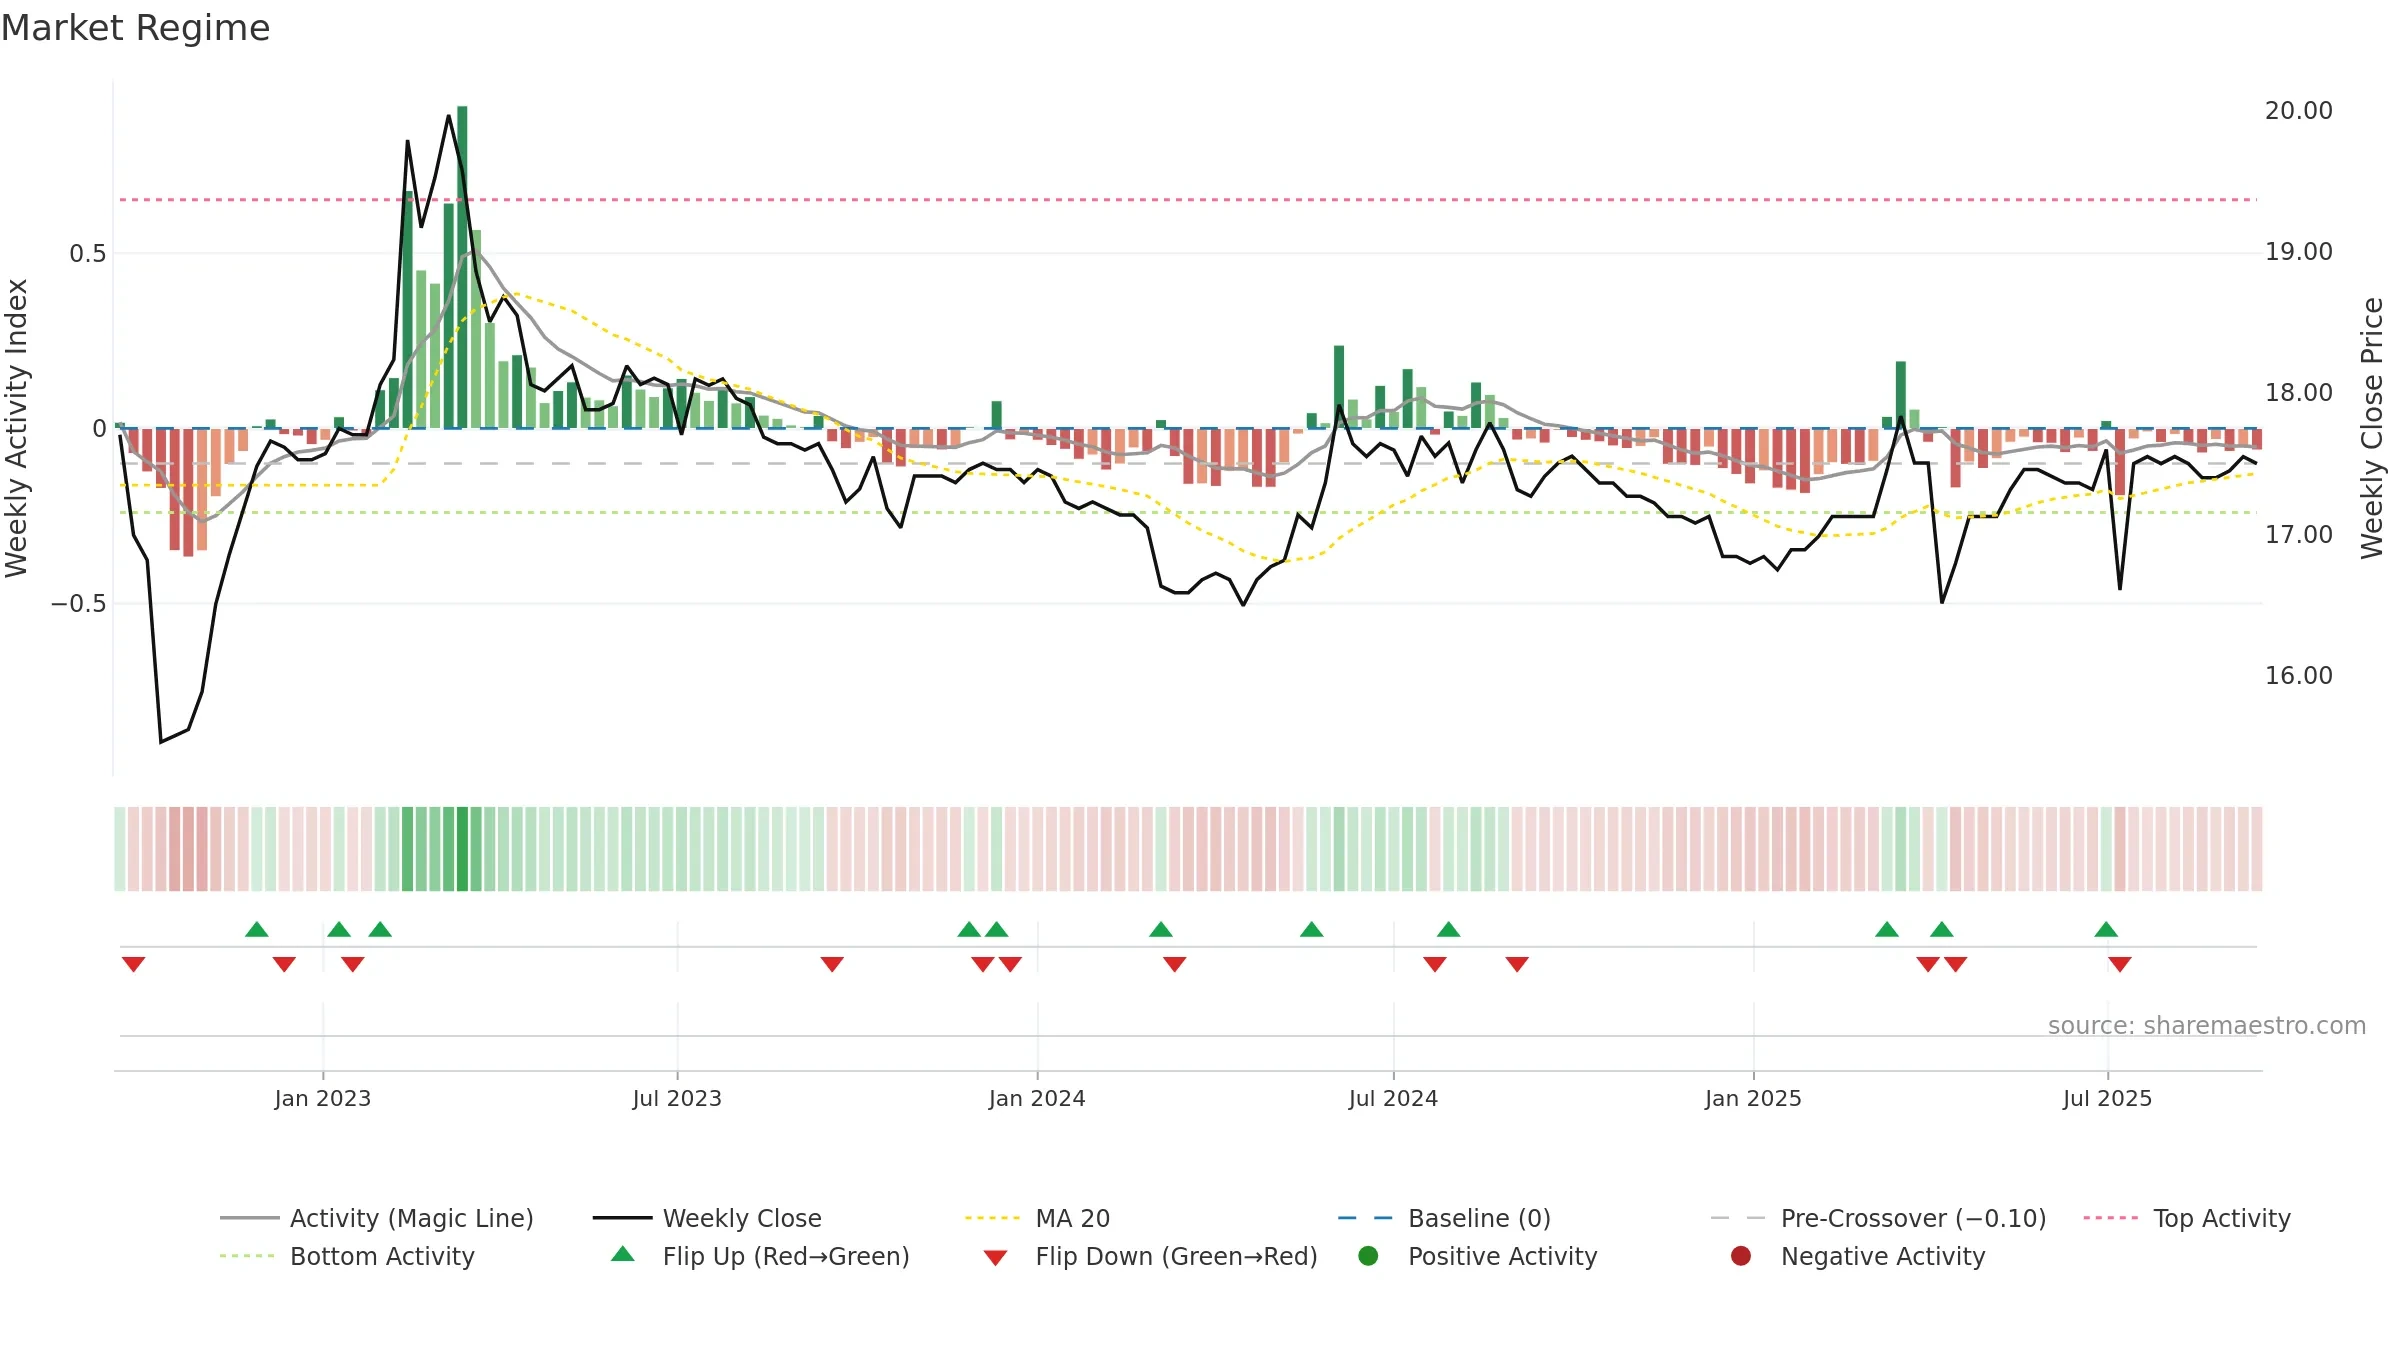
How to read this — Price slope is downward, indicating persistent supply pressure. Low weekly volatility favours steadier follow-through. Volume and price are moving in the same direction — a constructive confirmation. Price holds above key averages, indicating constructive participation.
Down-slope argues for patience; rallies can fade sooner unless participation improves.
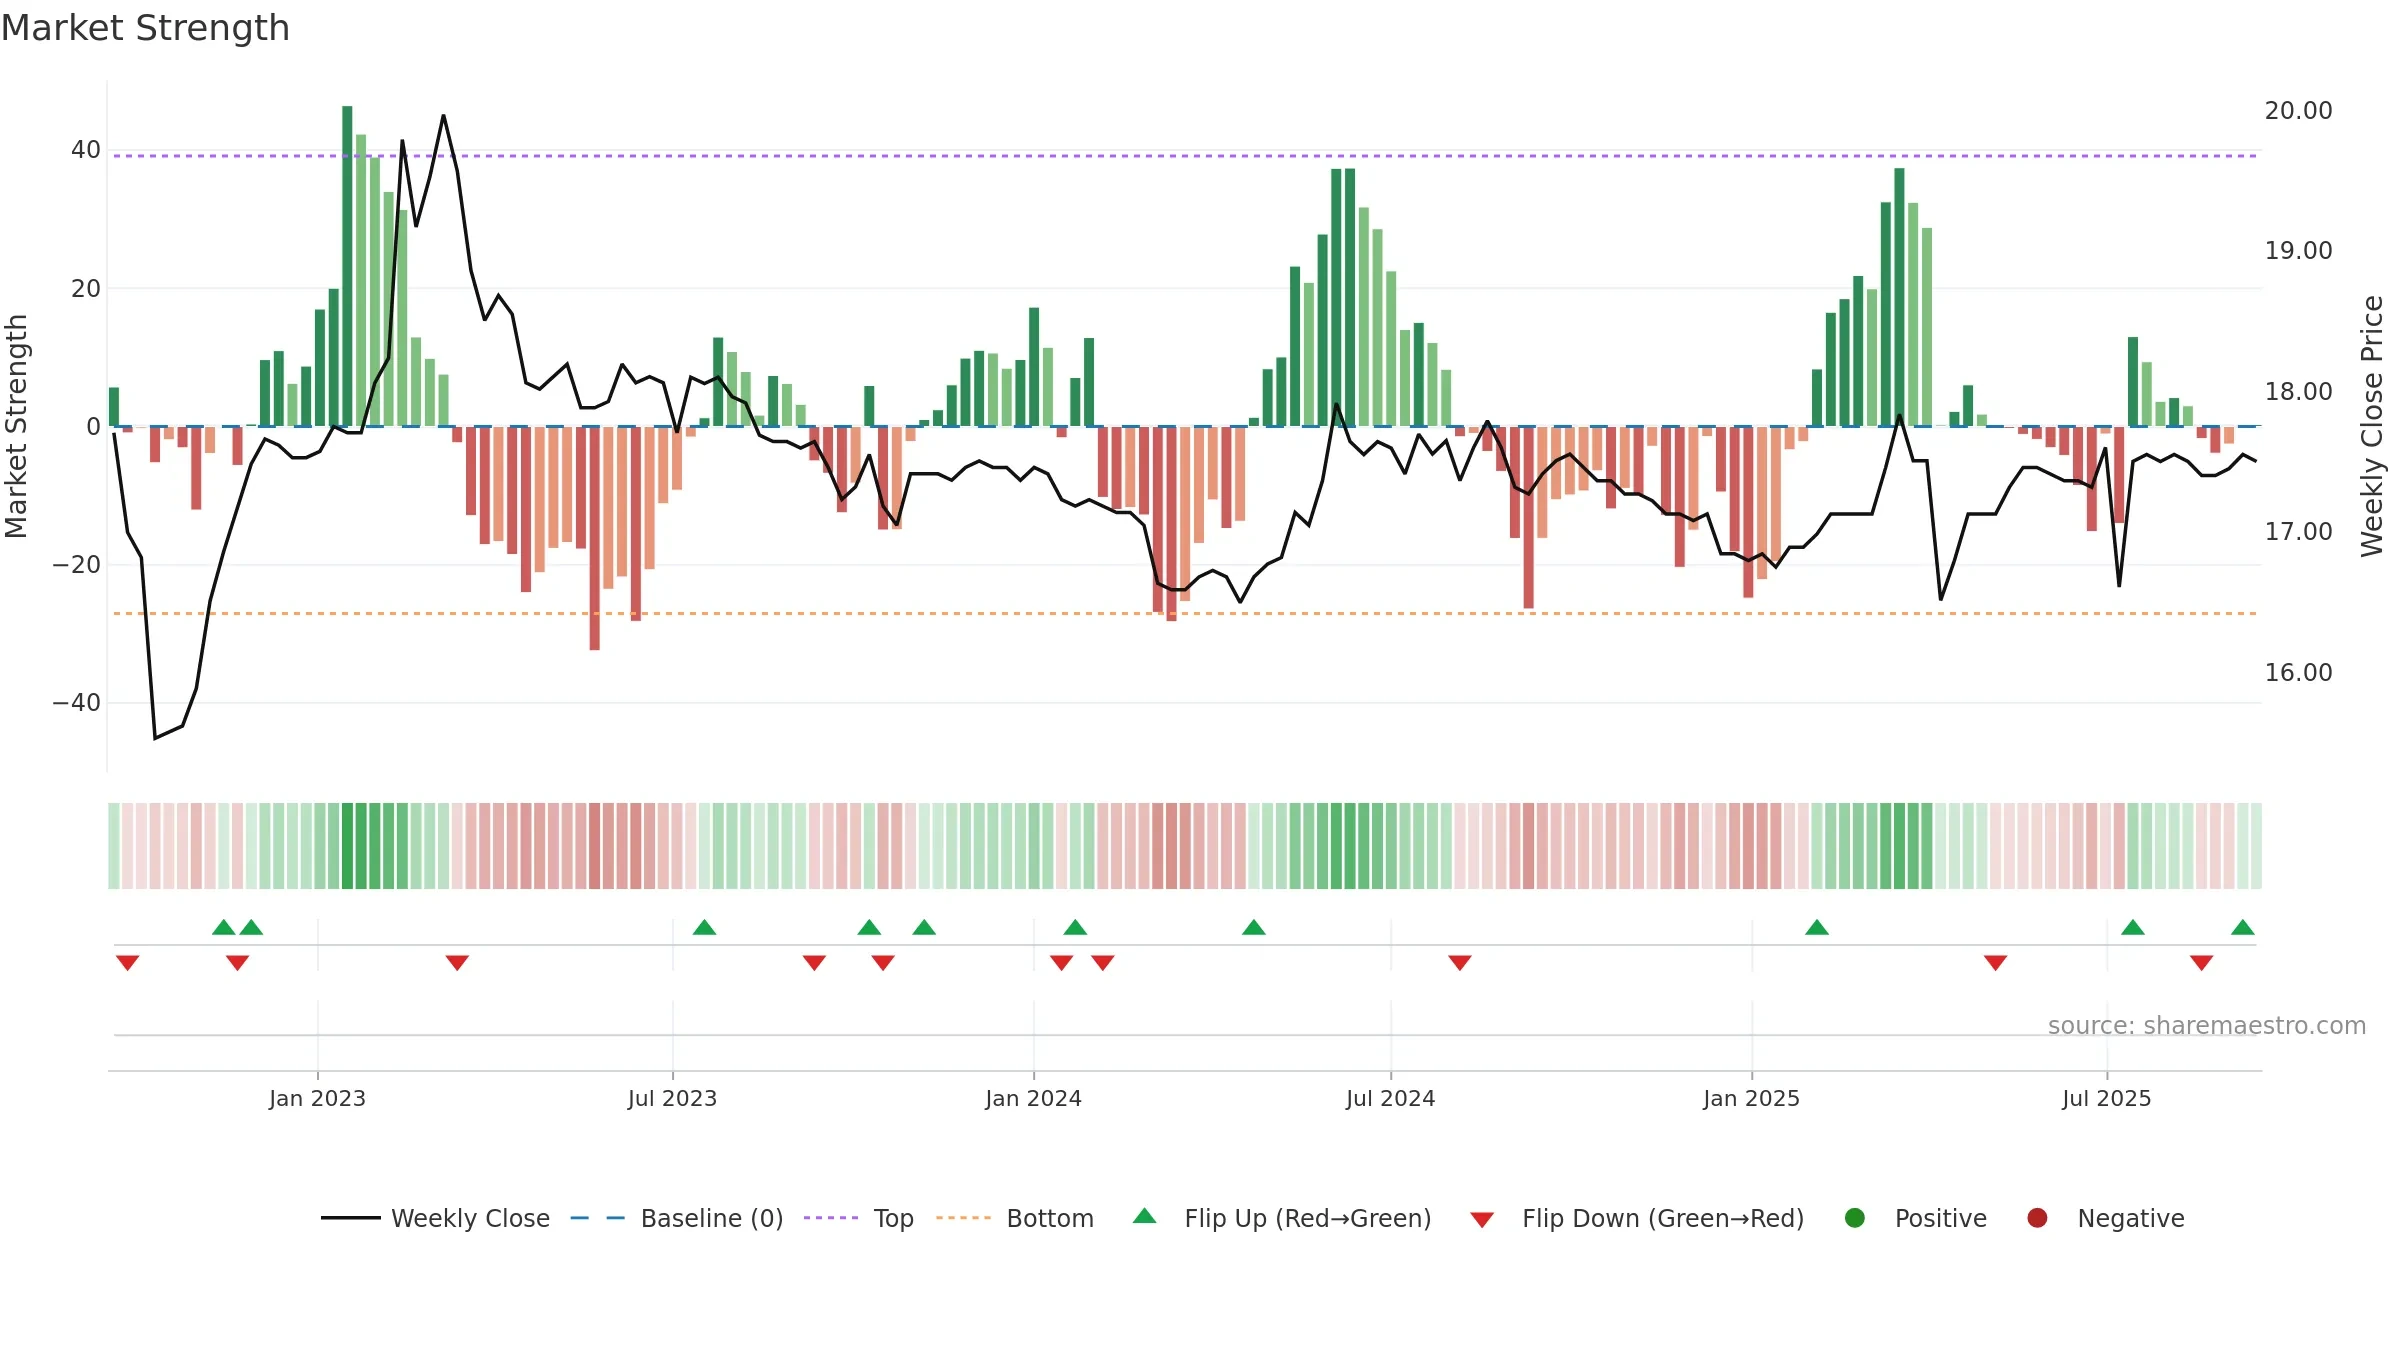
Gauge maps the trend signal to a 0–100 scale.
How to read this — High gauge and rising momentum — buyers in control.
Bias remains higher; pullbacks could be buyable if participation holds.
The flag is positive: favourable upside skew with supportive conditions.
Conclusion
Positive setup. ★★★★☆ confidence. Price window: 0. Trend: Strong Uptrend; gauge 60. In combination, liquidity confirms the move.
- High gauge with rising momentum (strong uptrend)
- Momentum is bullish and rising
- Price holds above 8w & 26w averages
- Liquidity confirms the price trend
Why: Return volatility 0.55%. Volume trend falling. Liquidity convergence with price. Trend state strong uptrend. Momentum bullish and rising. Valuation stance positive.
Tip: Most metrics include a hover tooltip where they appear in the report.