Hangzhou Greenda Electronic Materials Co., Ltd.
603931 SHA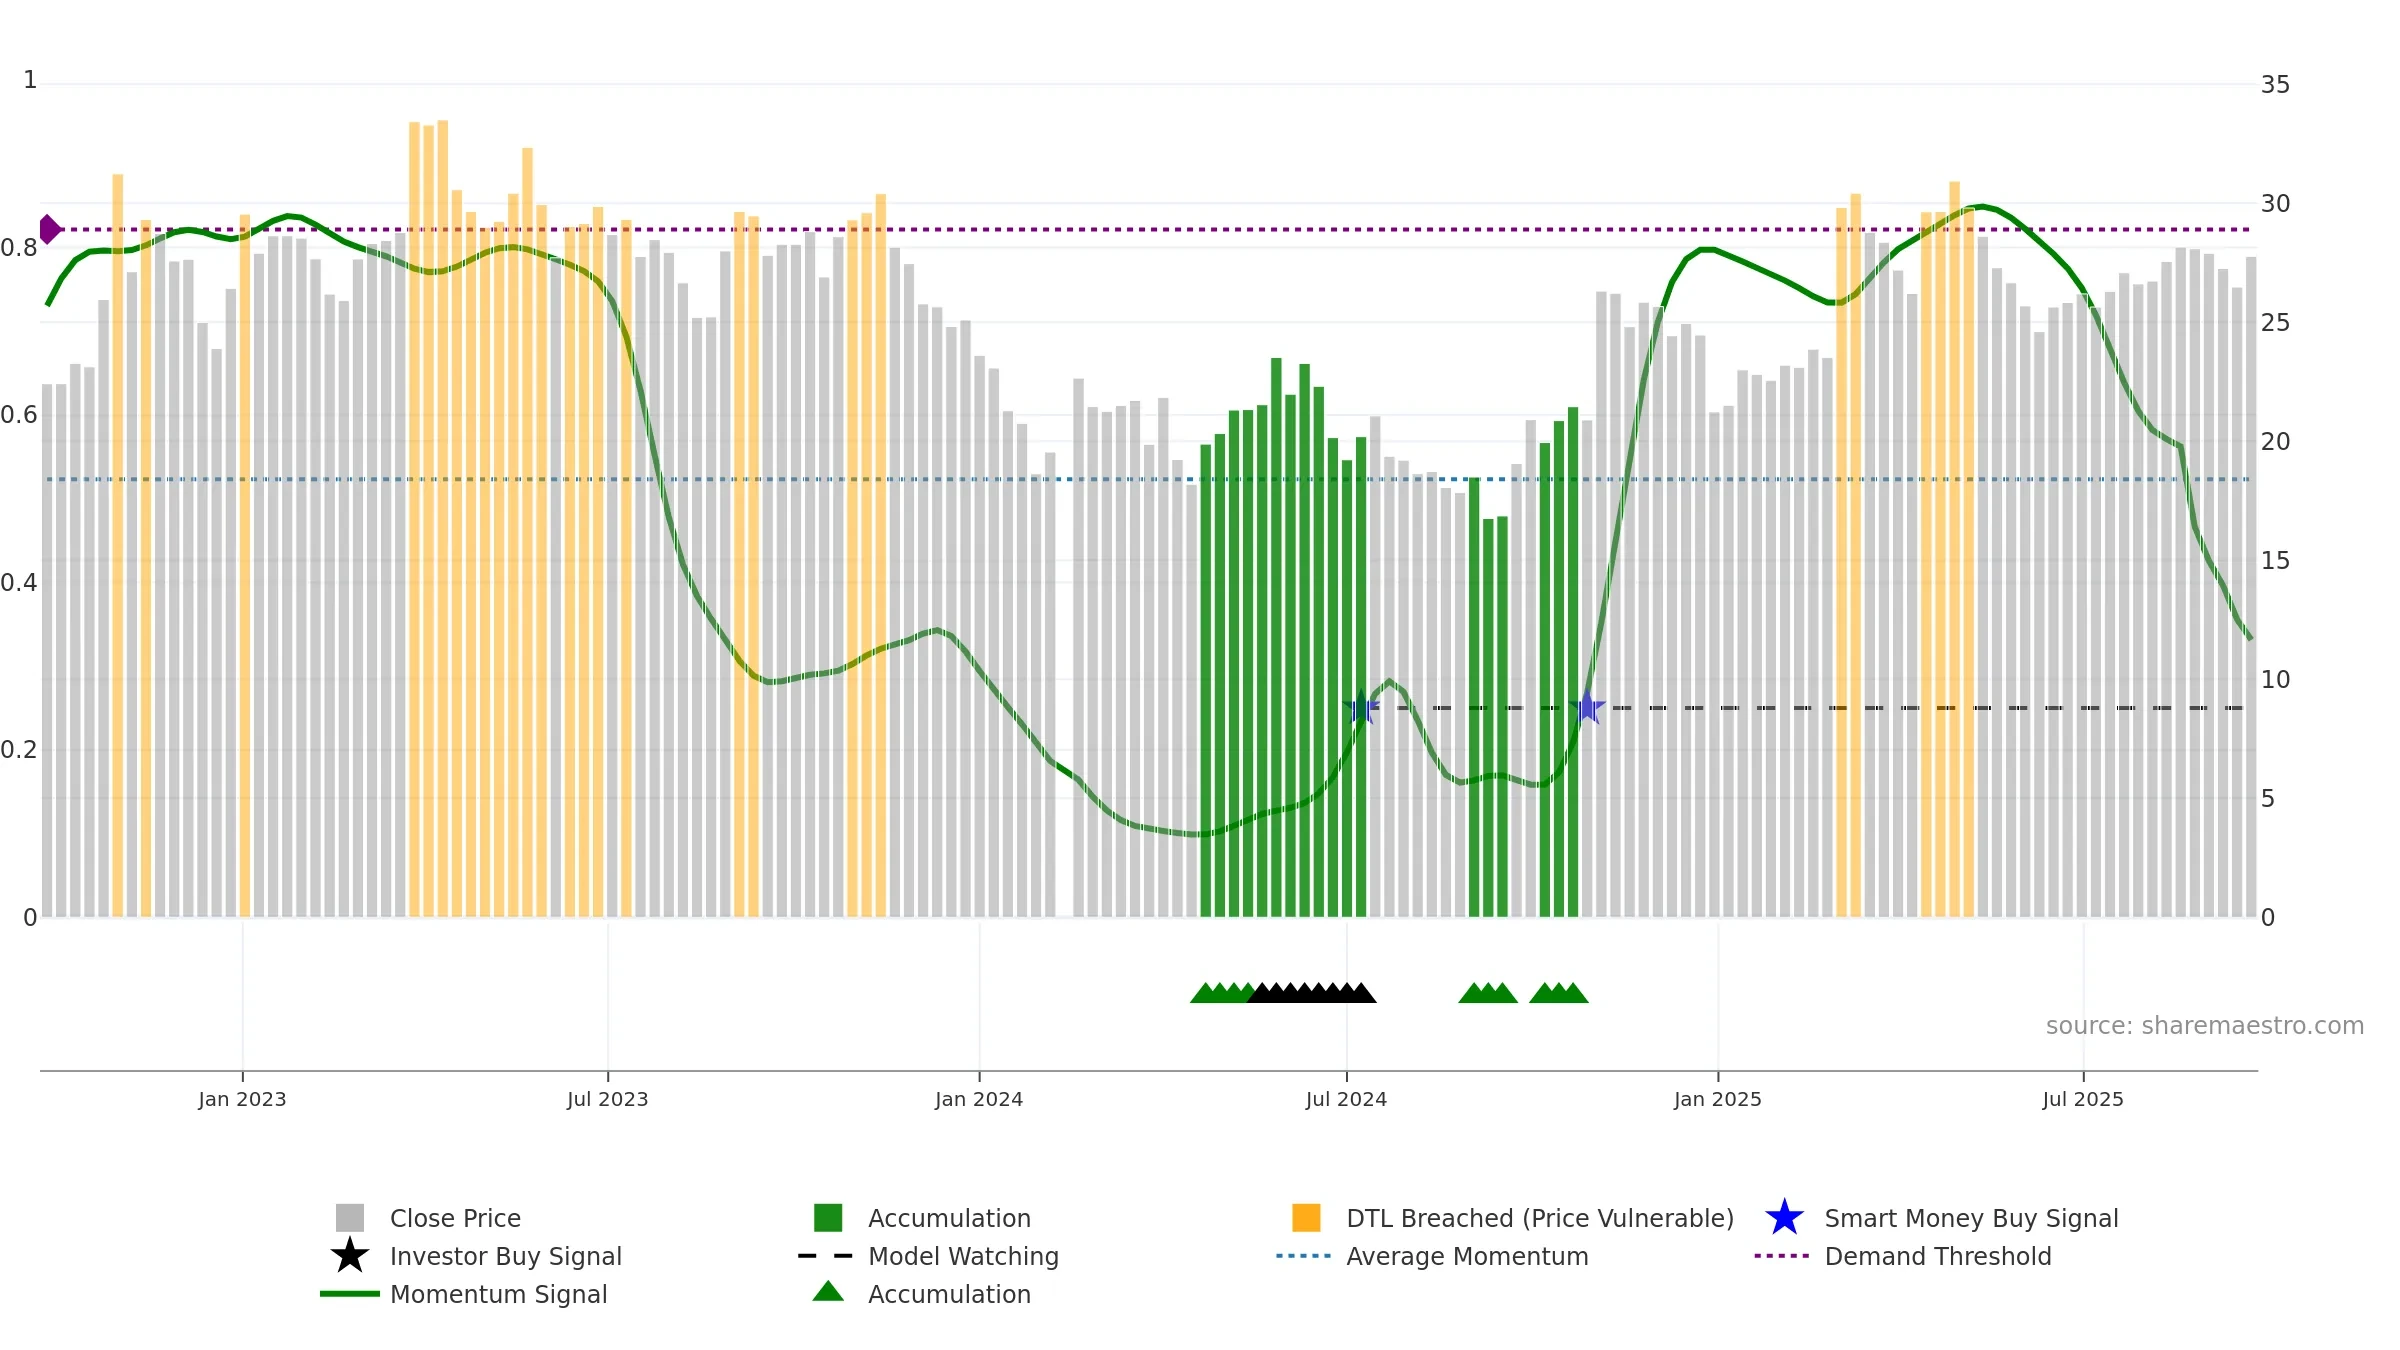
Weekly Report
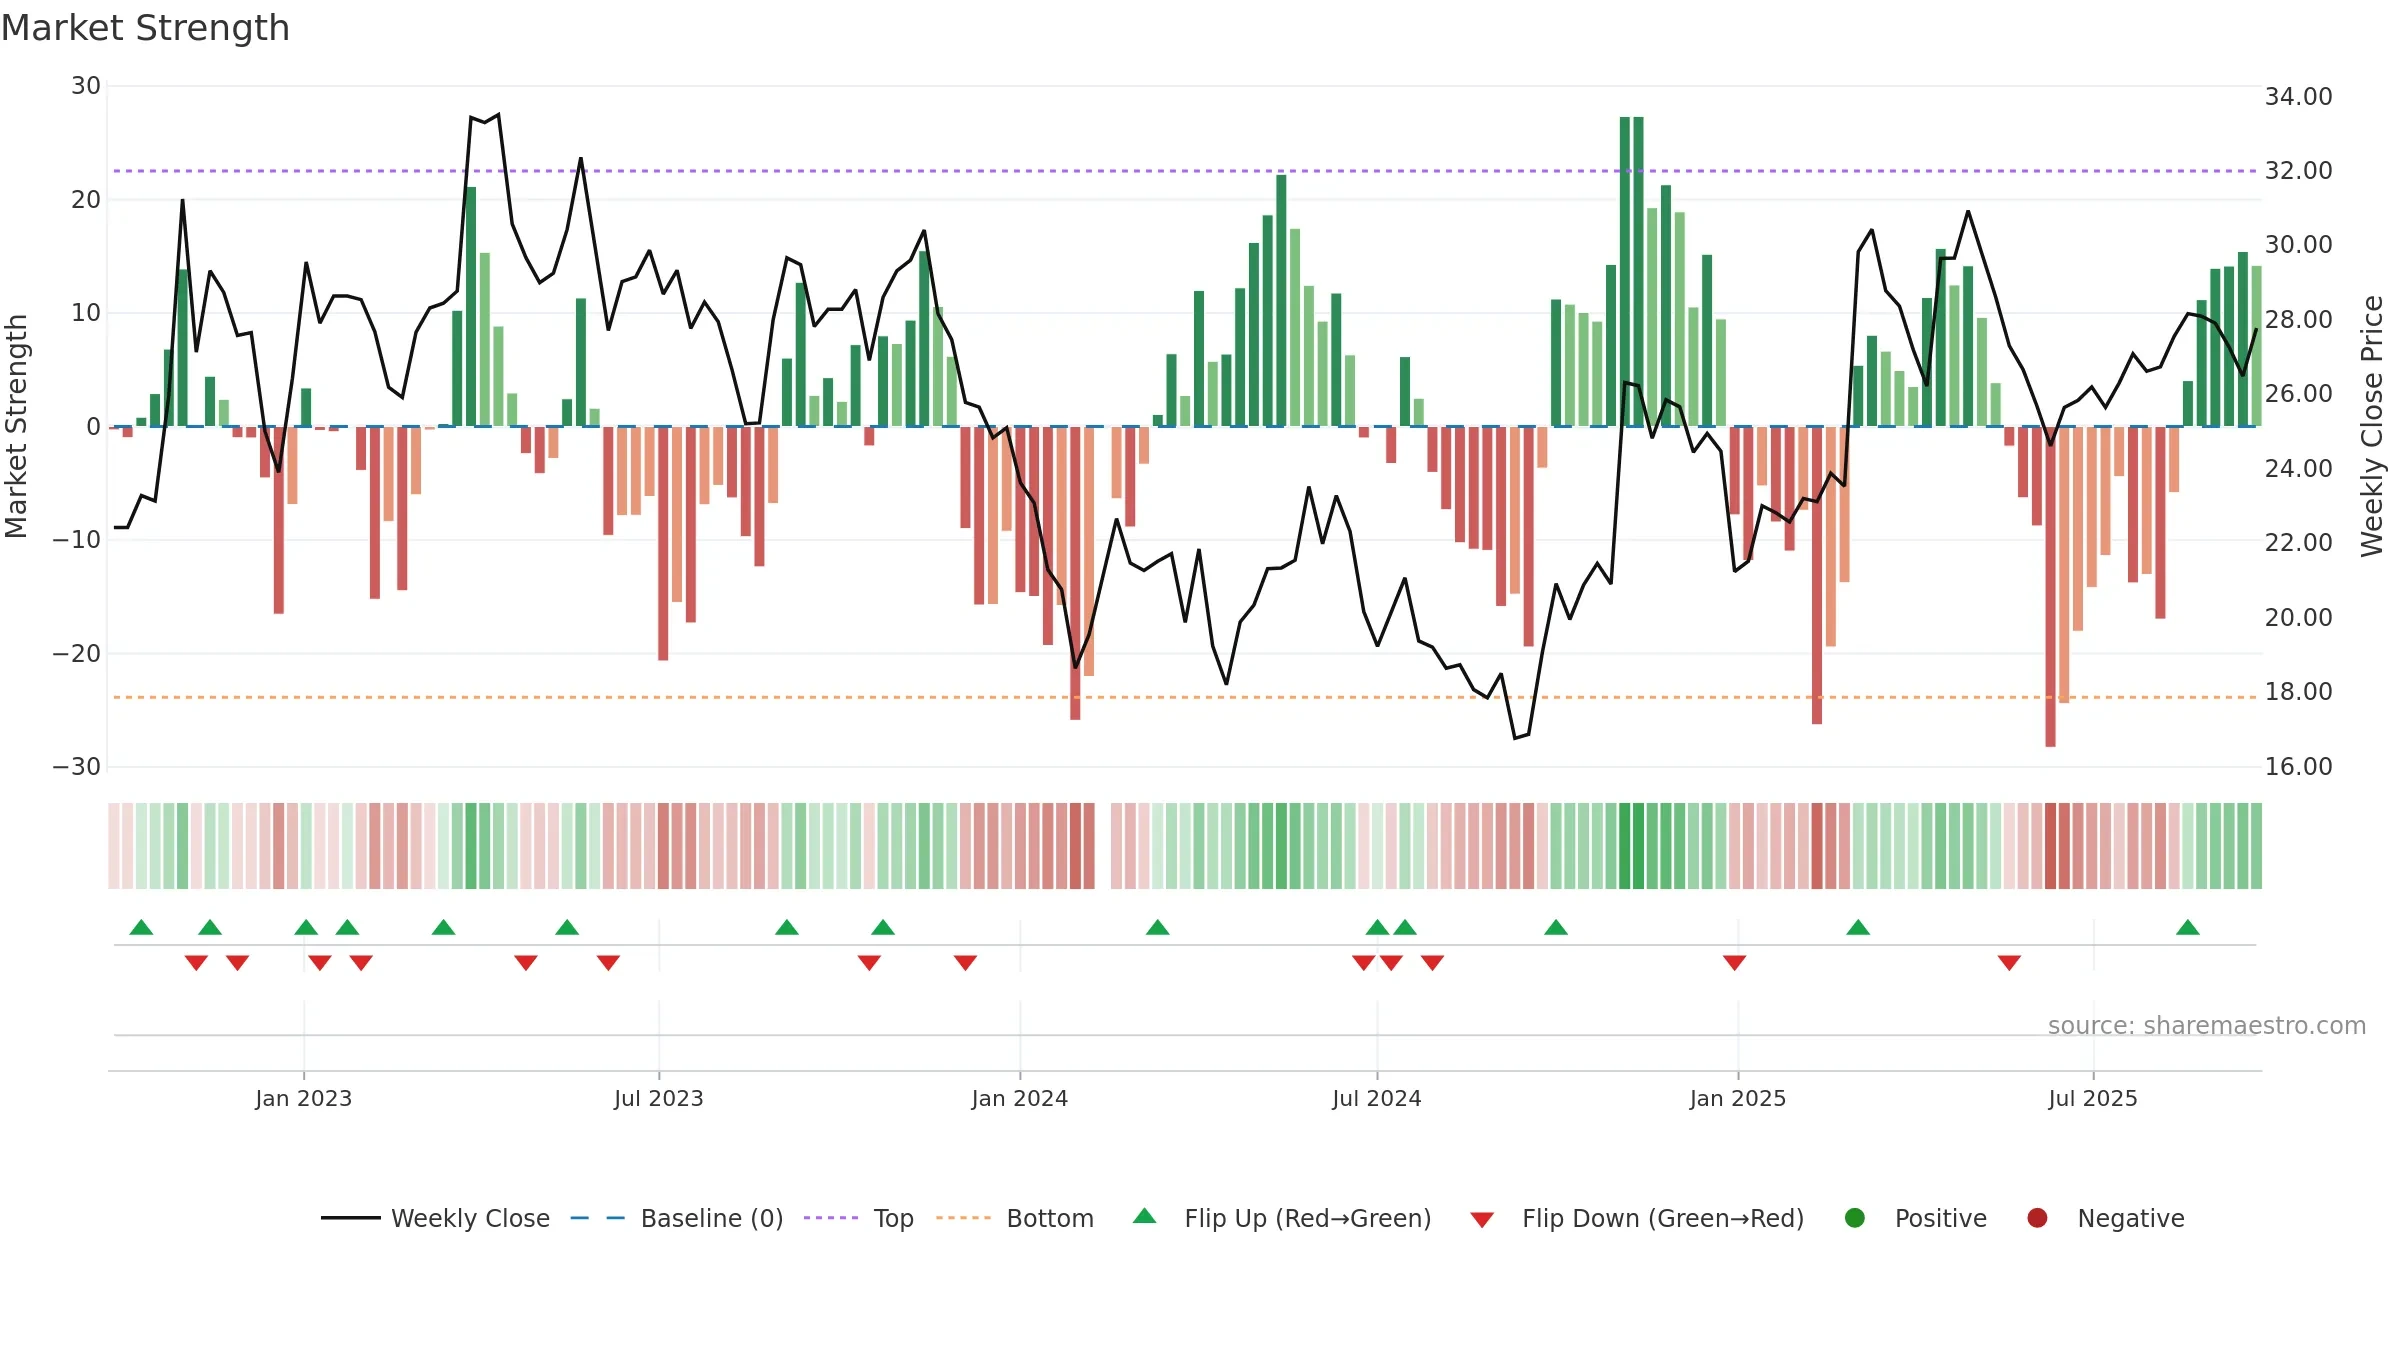
Hangzhou Greenda Electronic Materials Co., Ltd. closed at 27.7700 (-1.21% WoW) . Data window ends Mon, 22 Sep 2025.
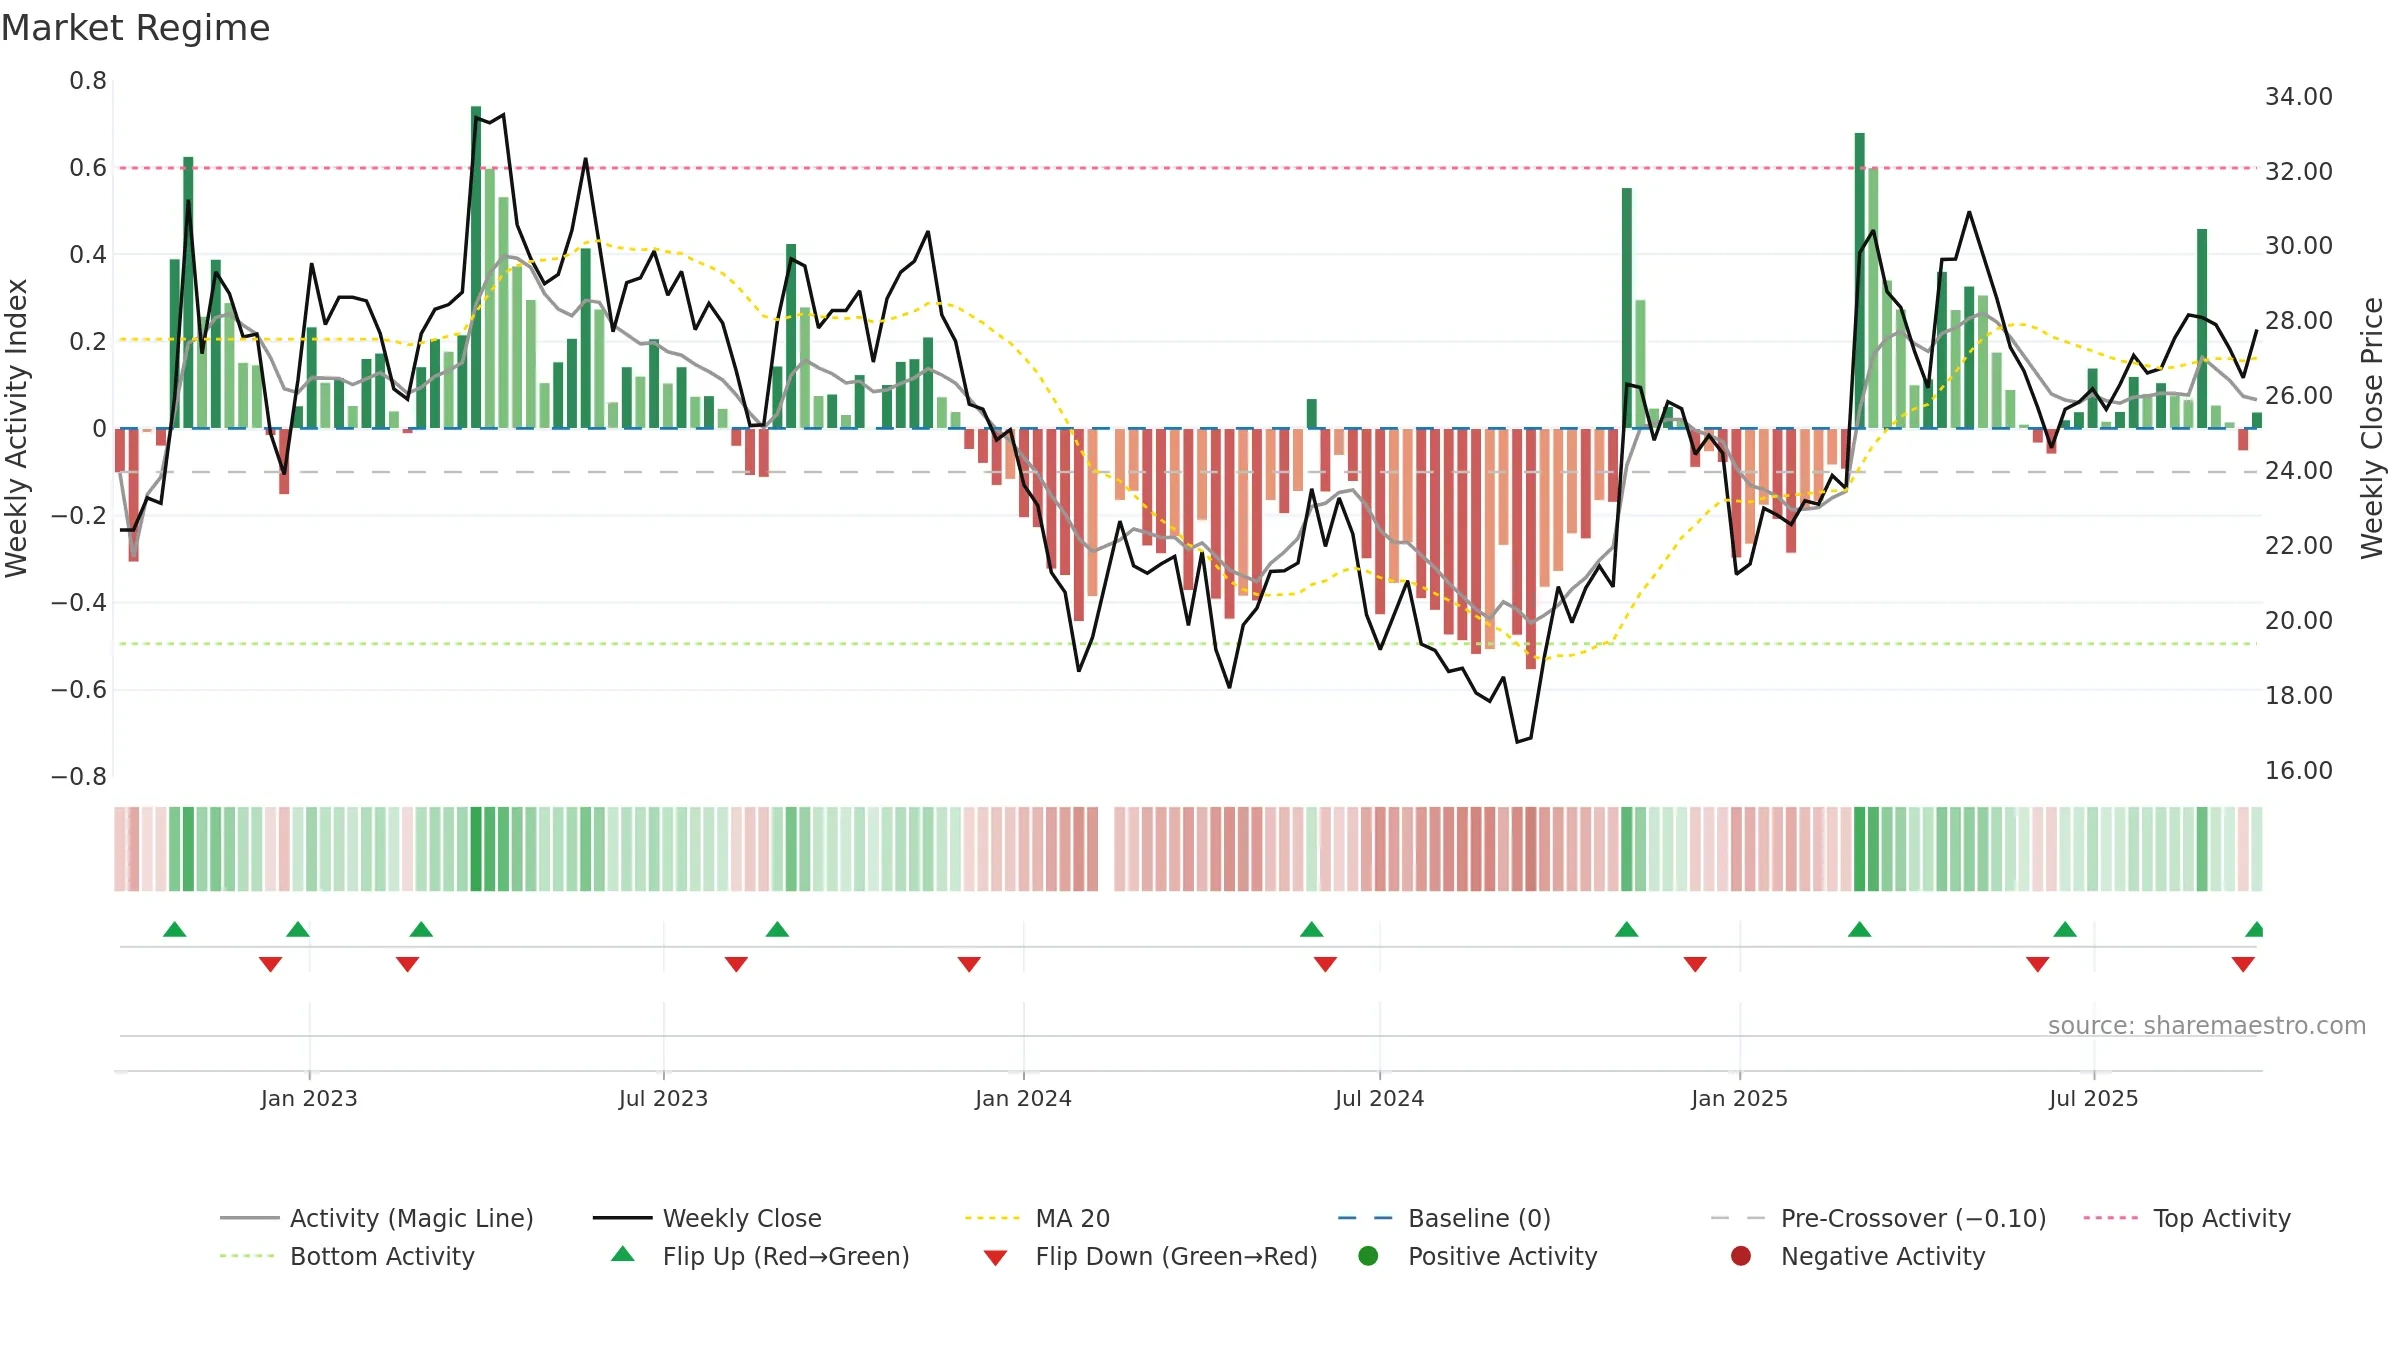
How to read this — Price slope is downward, indicating persistent supply pressure. Volume and price are moving in the same direction — a constructive confirmation. Distance to baseline is narrowing — reverting closer to its fair-value track. Fresh short-term downside crossover weakens near-term tone. Price holds above key averages, indicating constructive participation.
Down-slope argues for patience; rallies can fade sooner unless participation improves.
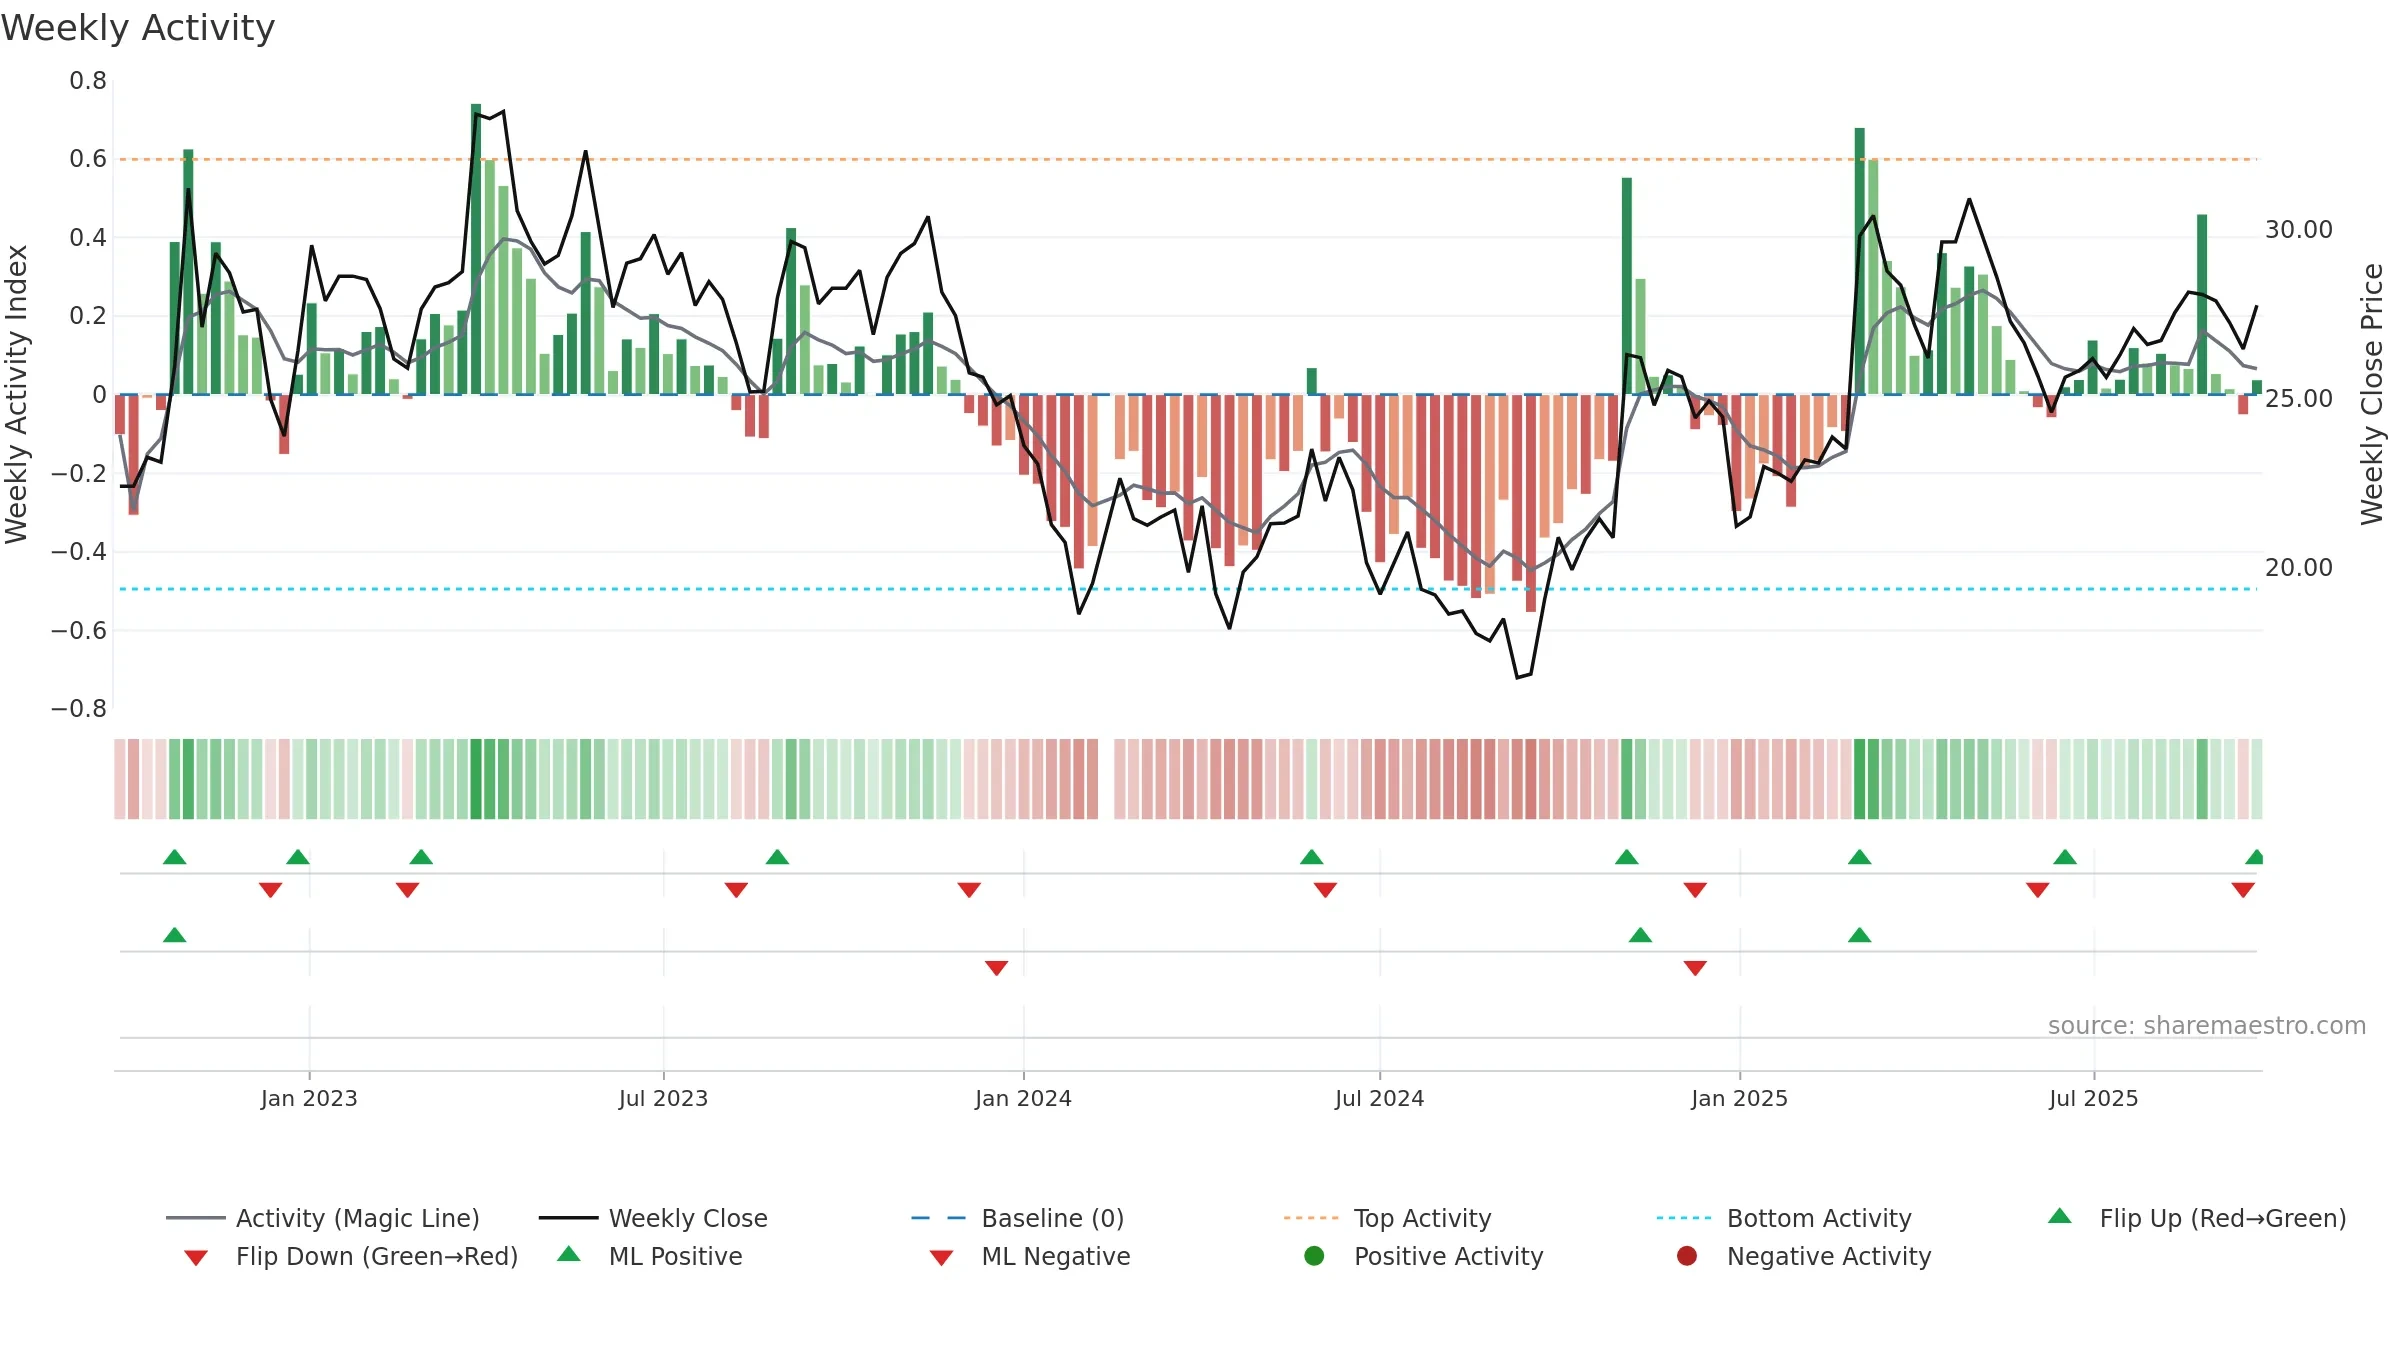
Gauge maps the trend signal to a 0–100 scale.
How to read this — Bearish zone with falling momentum — sellers in control. Sub-0.40 print confirms downside control.
Bias remains lower; rallies are suspect unless gauge reclaims 0.50/0.60.
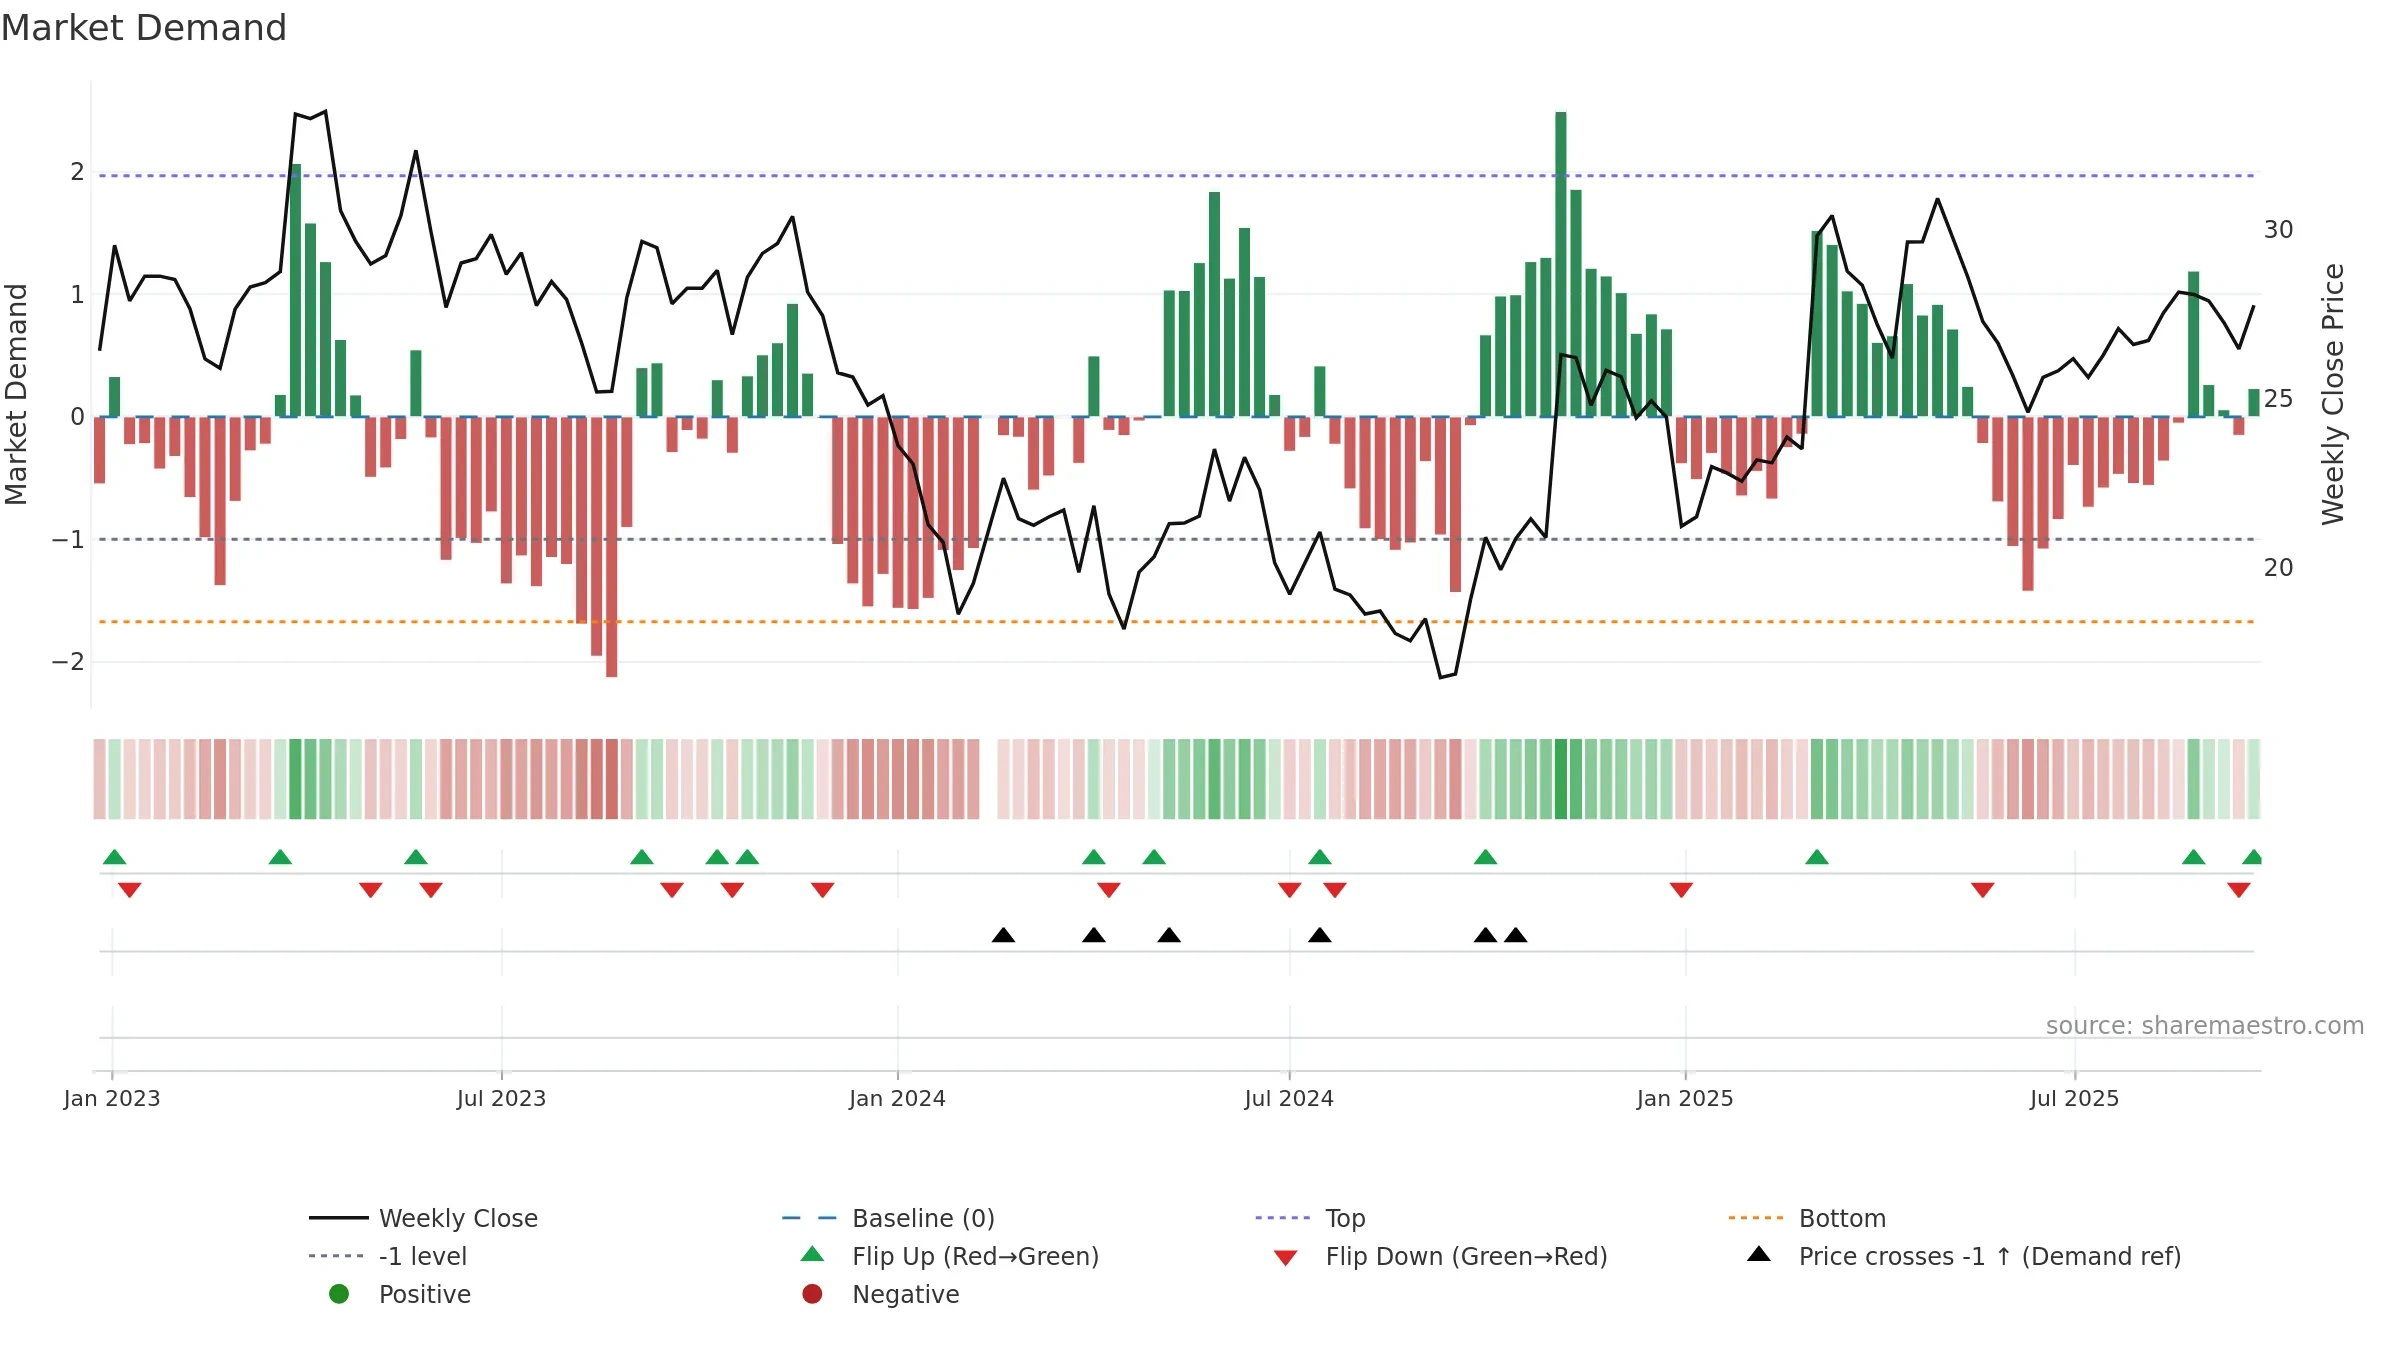
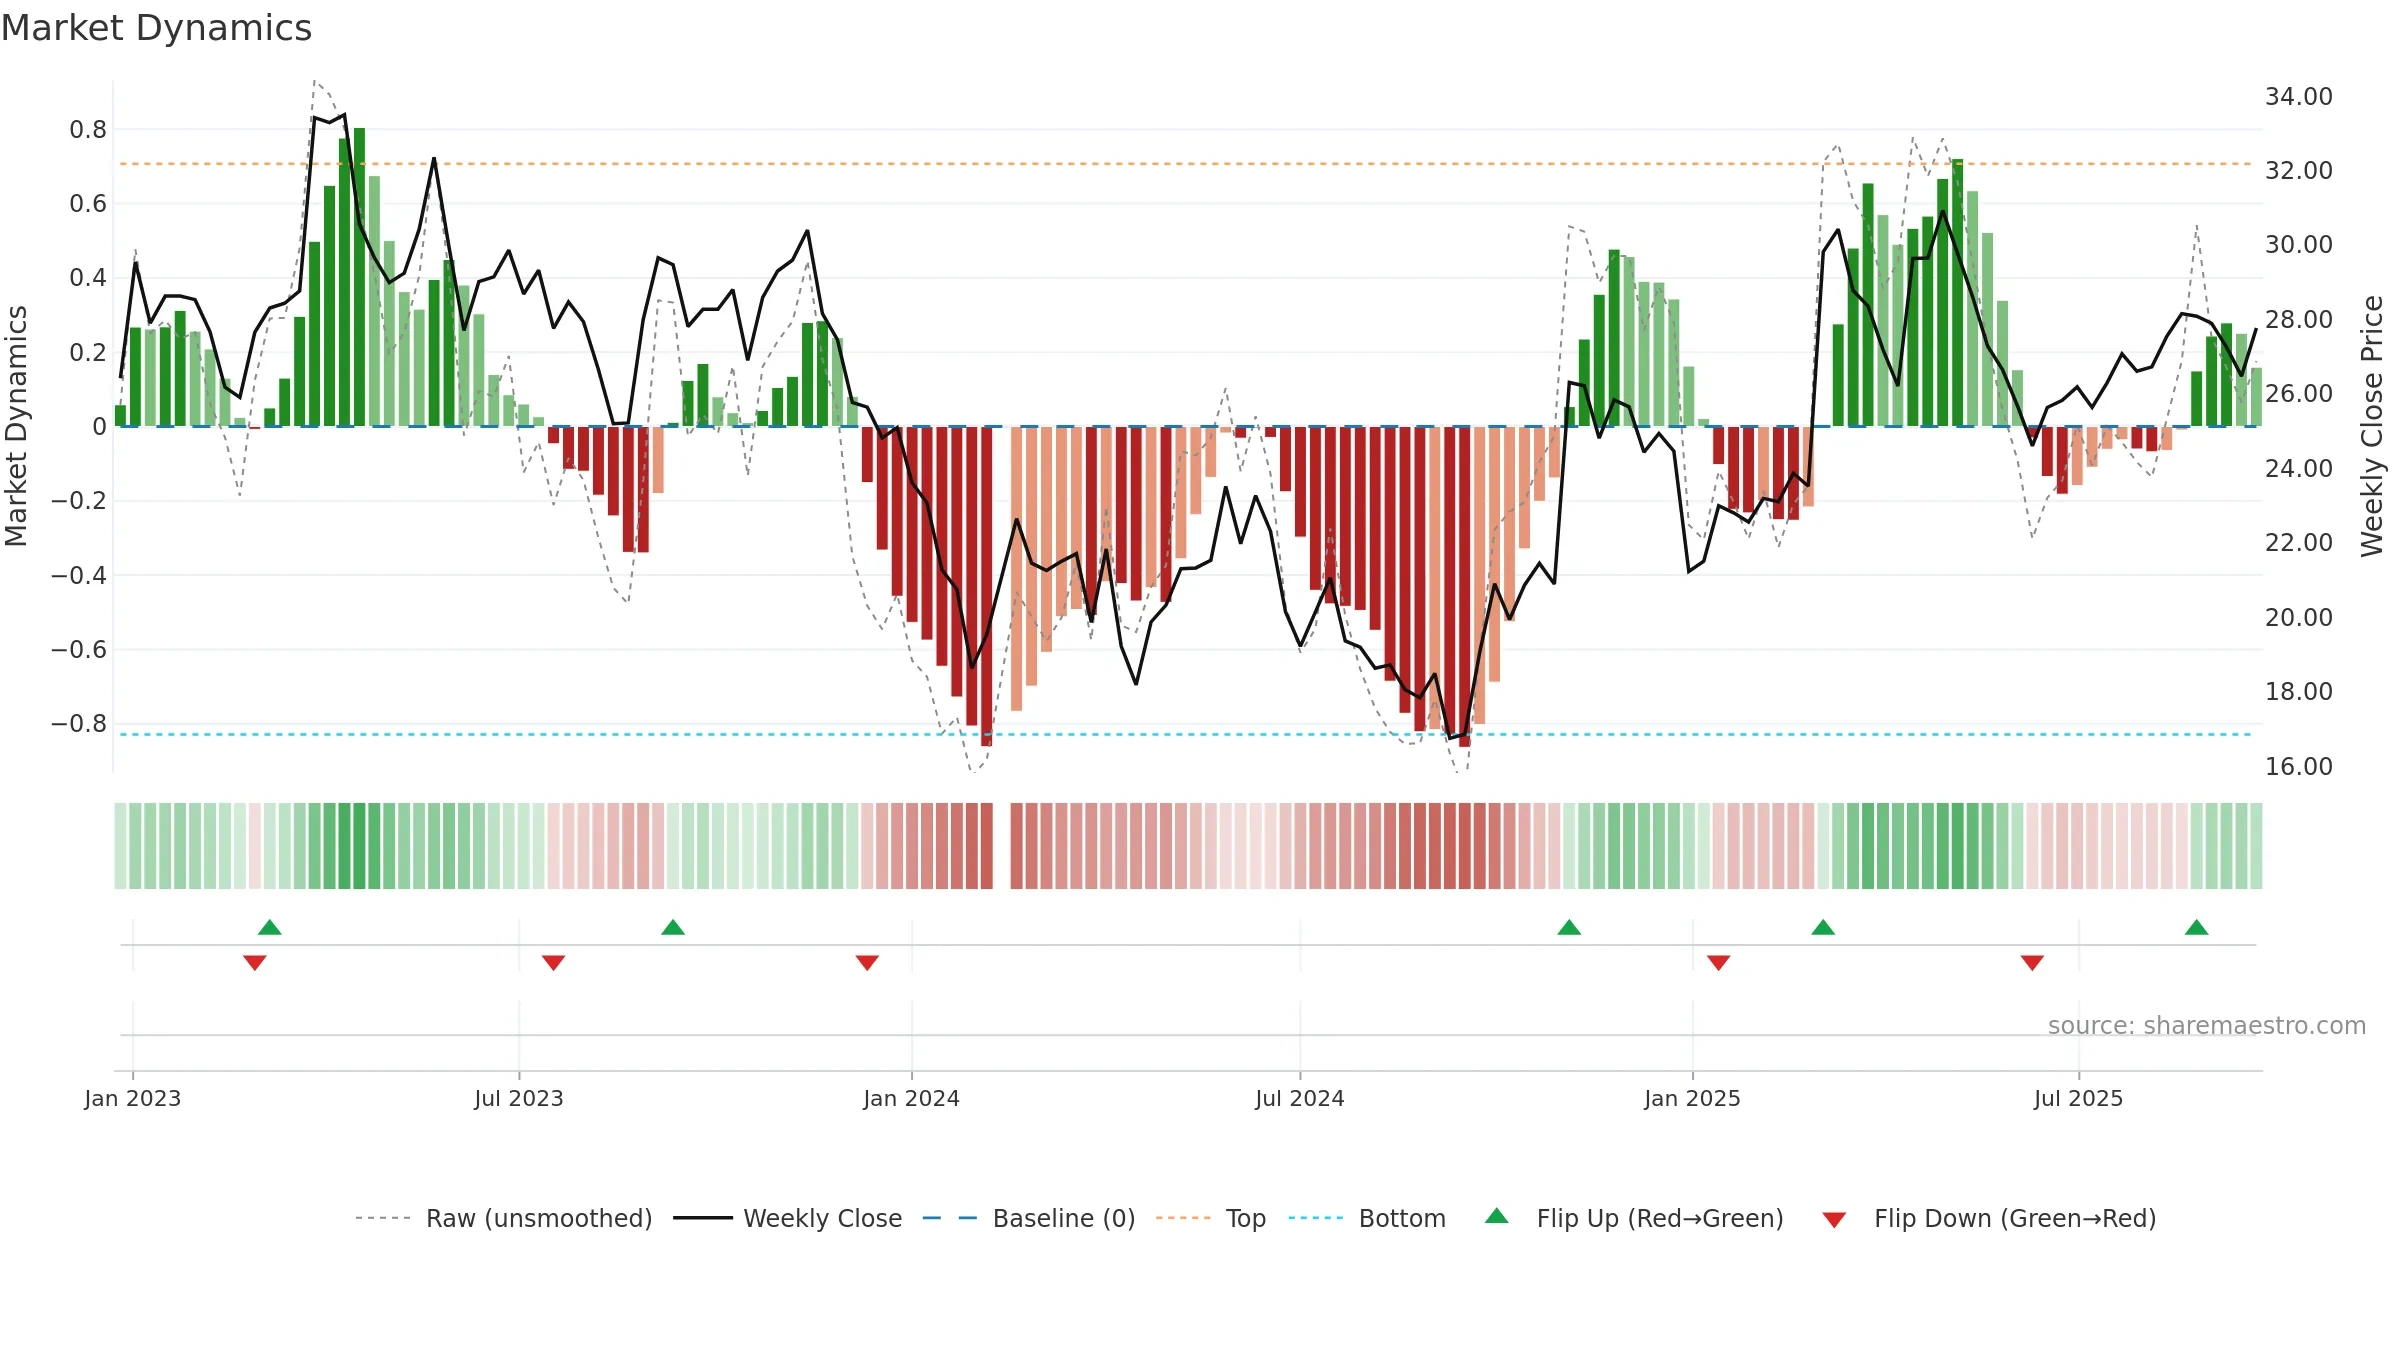
Price is above fair value; upside may be capped without catalysts.
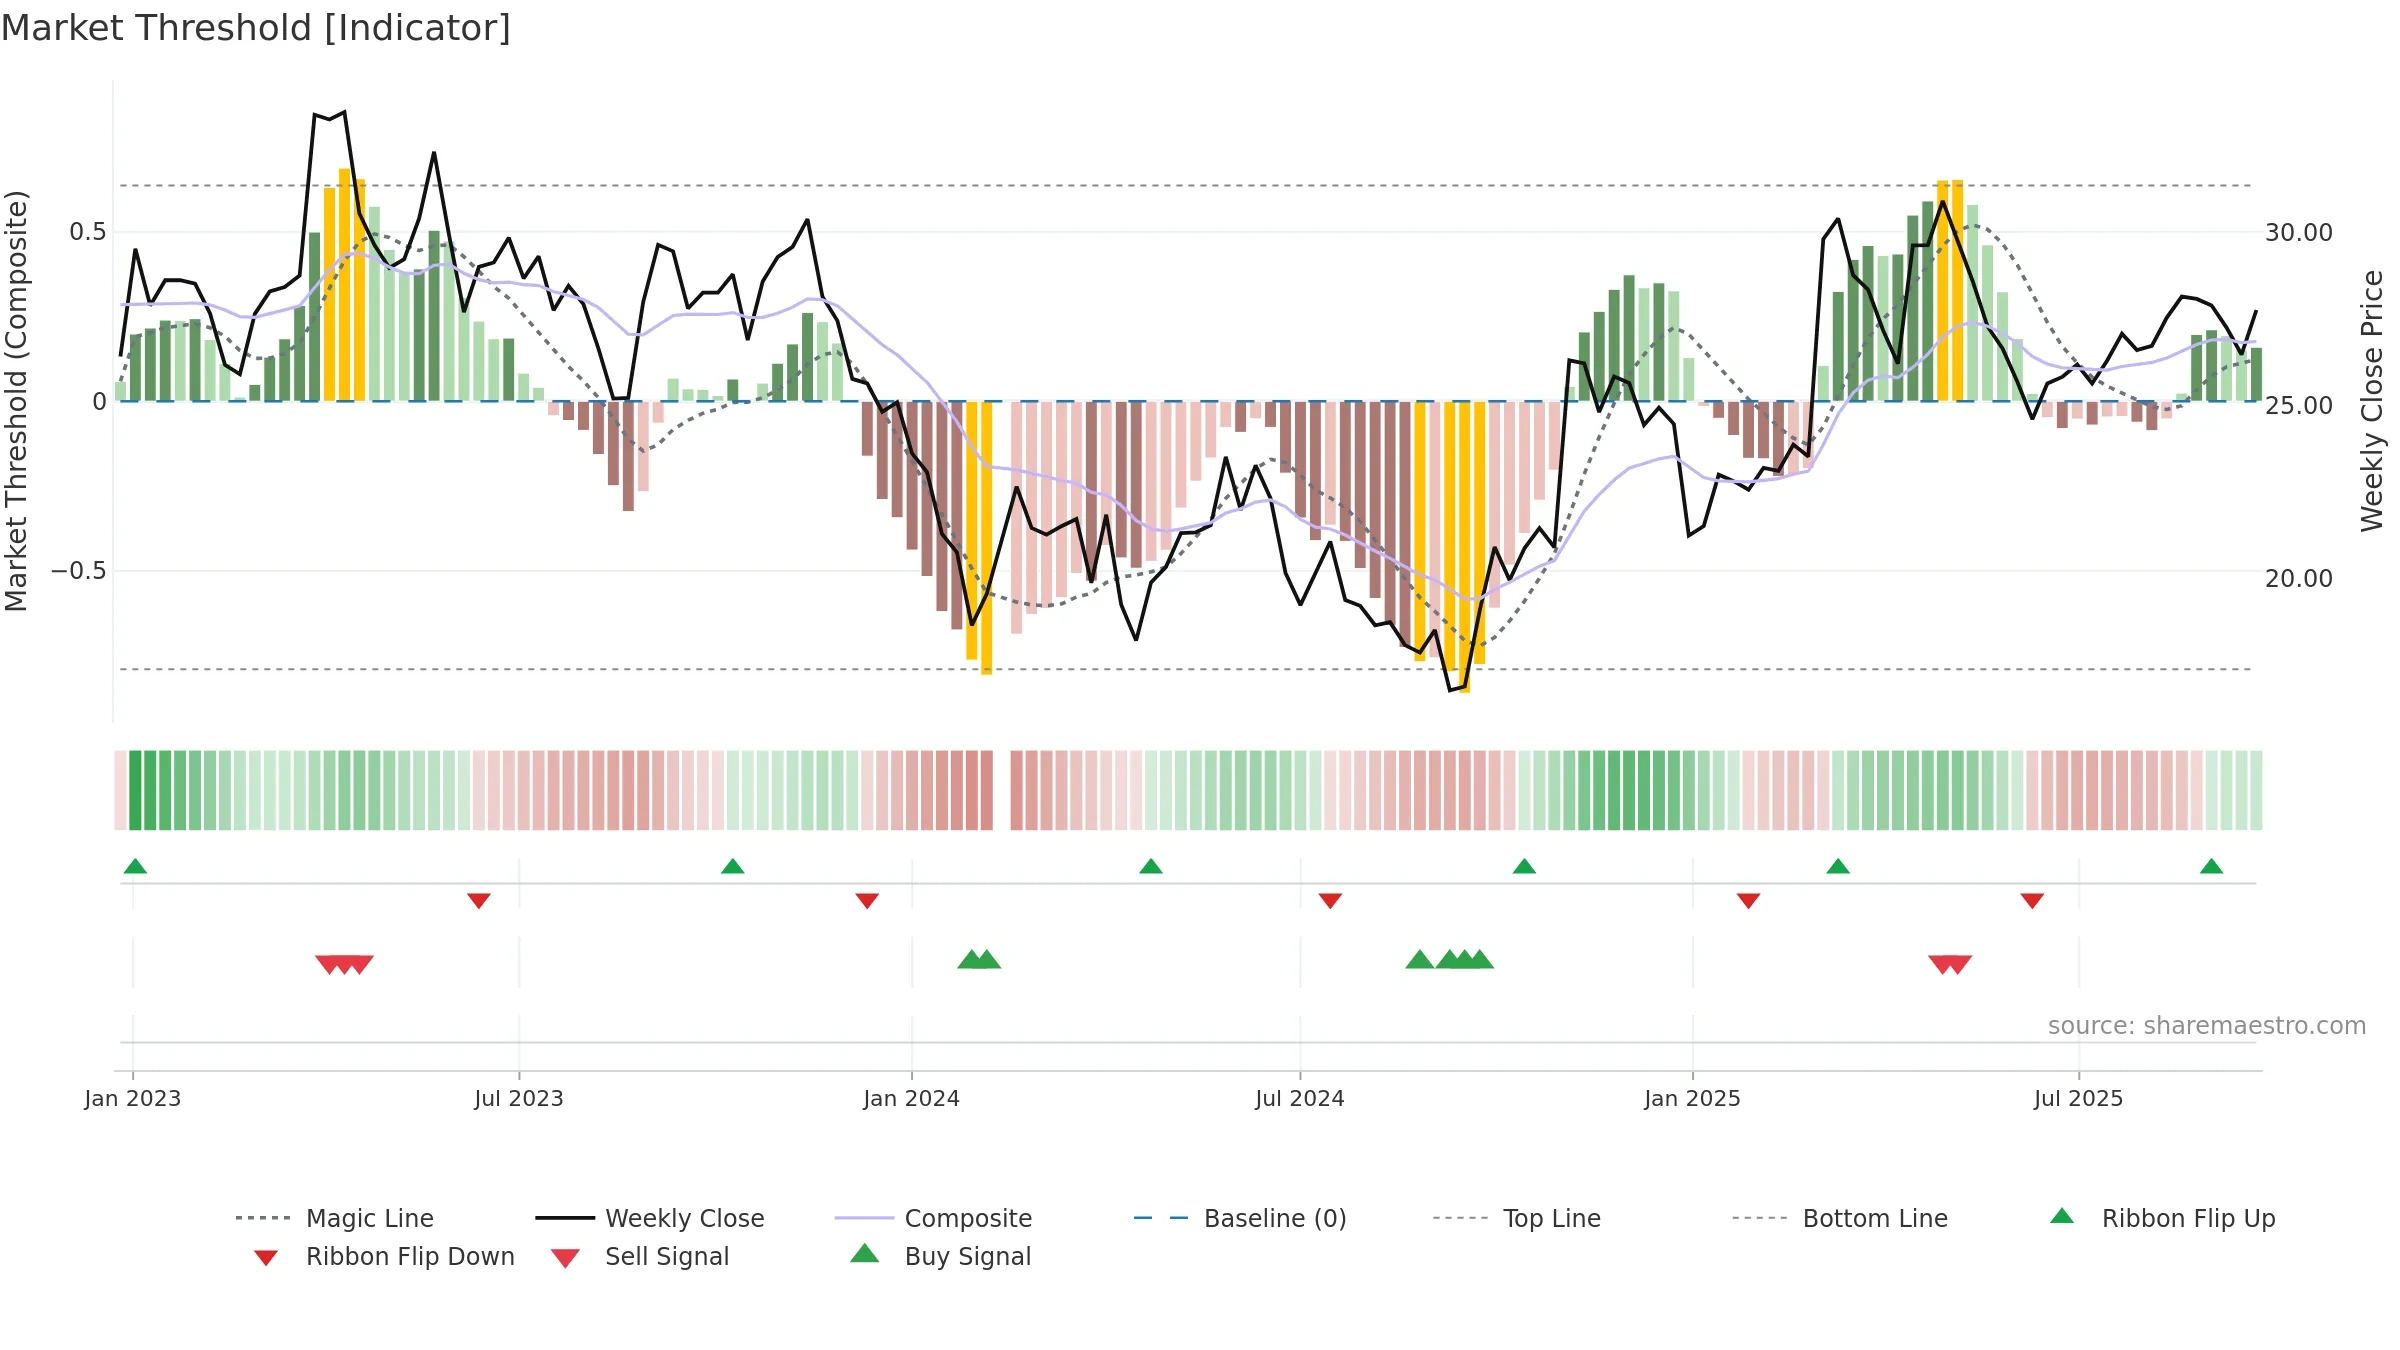
Conclusion
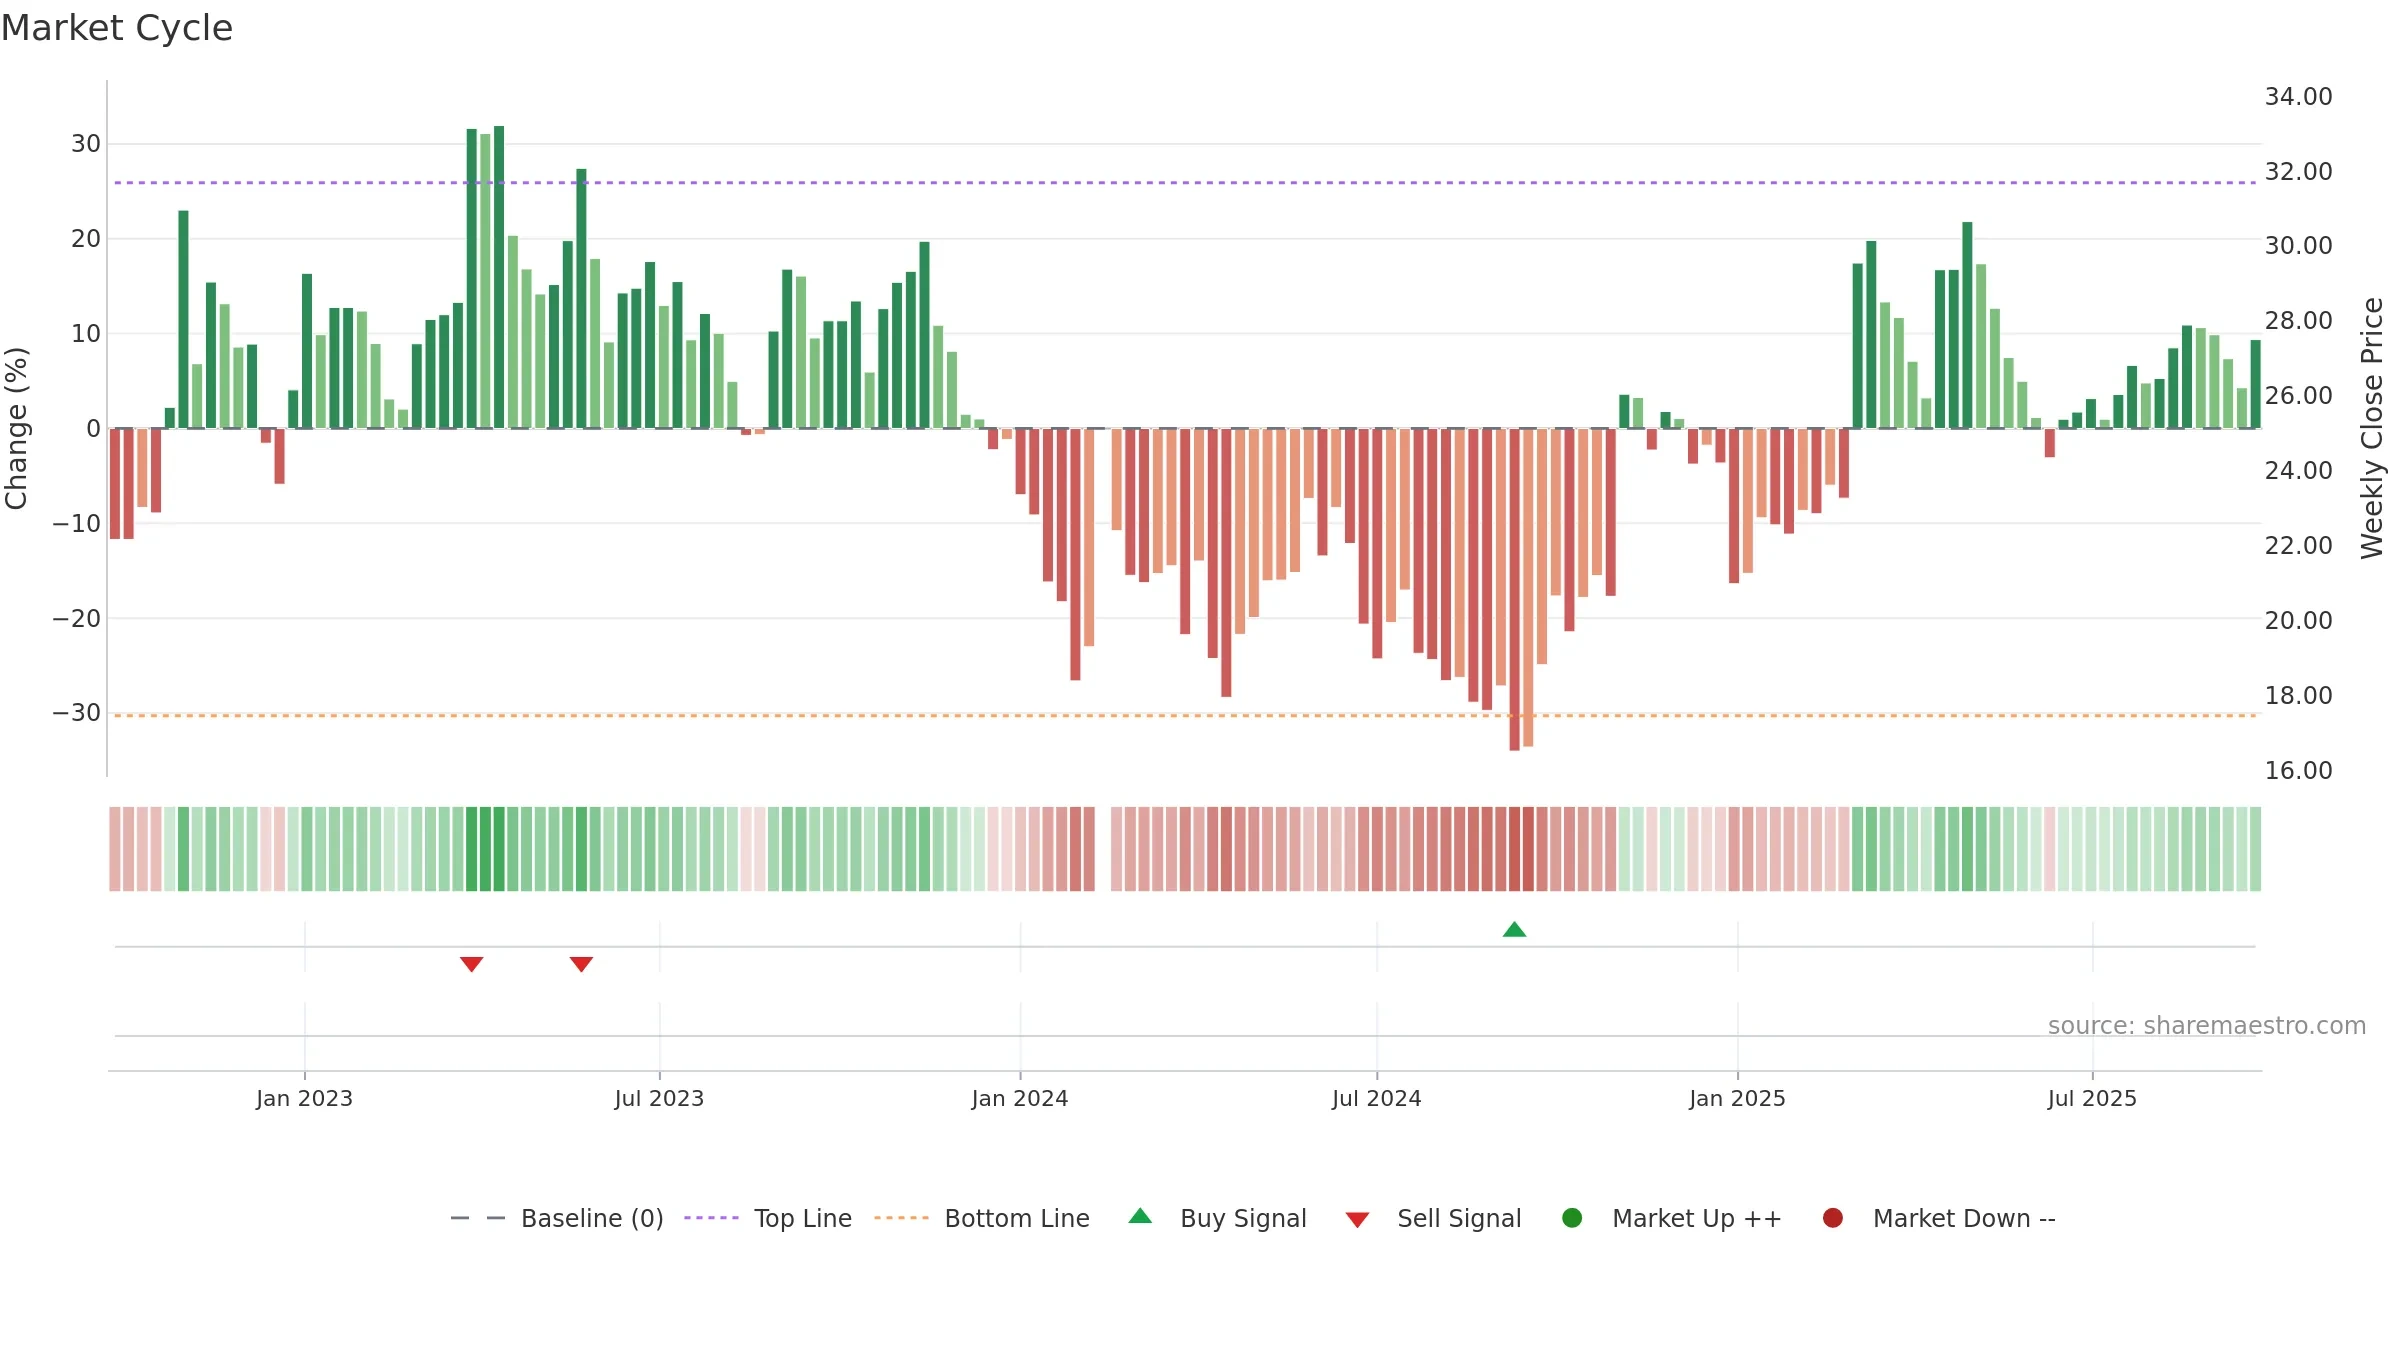
Negative setup. ★★☆☆☆ confidence. Price window: 3. Trend: Downtrend Confirmed; gauge 33. In combination, liquidity confirms the move.
- Price holds above 8w & 26w averages
- Liquidity confirms the price trend
- Bearish control with falling momentum
- Momentum is weak/falling
- Sub-0.40 print confirms bear control
Why: Price window 3.89% over 8w. Close is -1.38% below the prior-window high. Return volatility 2.02%. Volume trend falling. Liquidity convergence with price. Trend state downtrend confirmed. 4–8w crossover bearish. Momentum bearish and falling. Valuation limited upside without catalysts.
Tip: Most metrics include a hover tooltip where they appear in the report.