GCL Energy Technology Co.,Ltd.
002015 SHE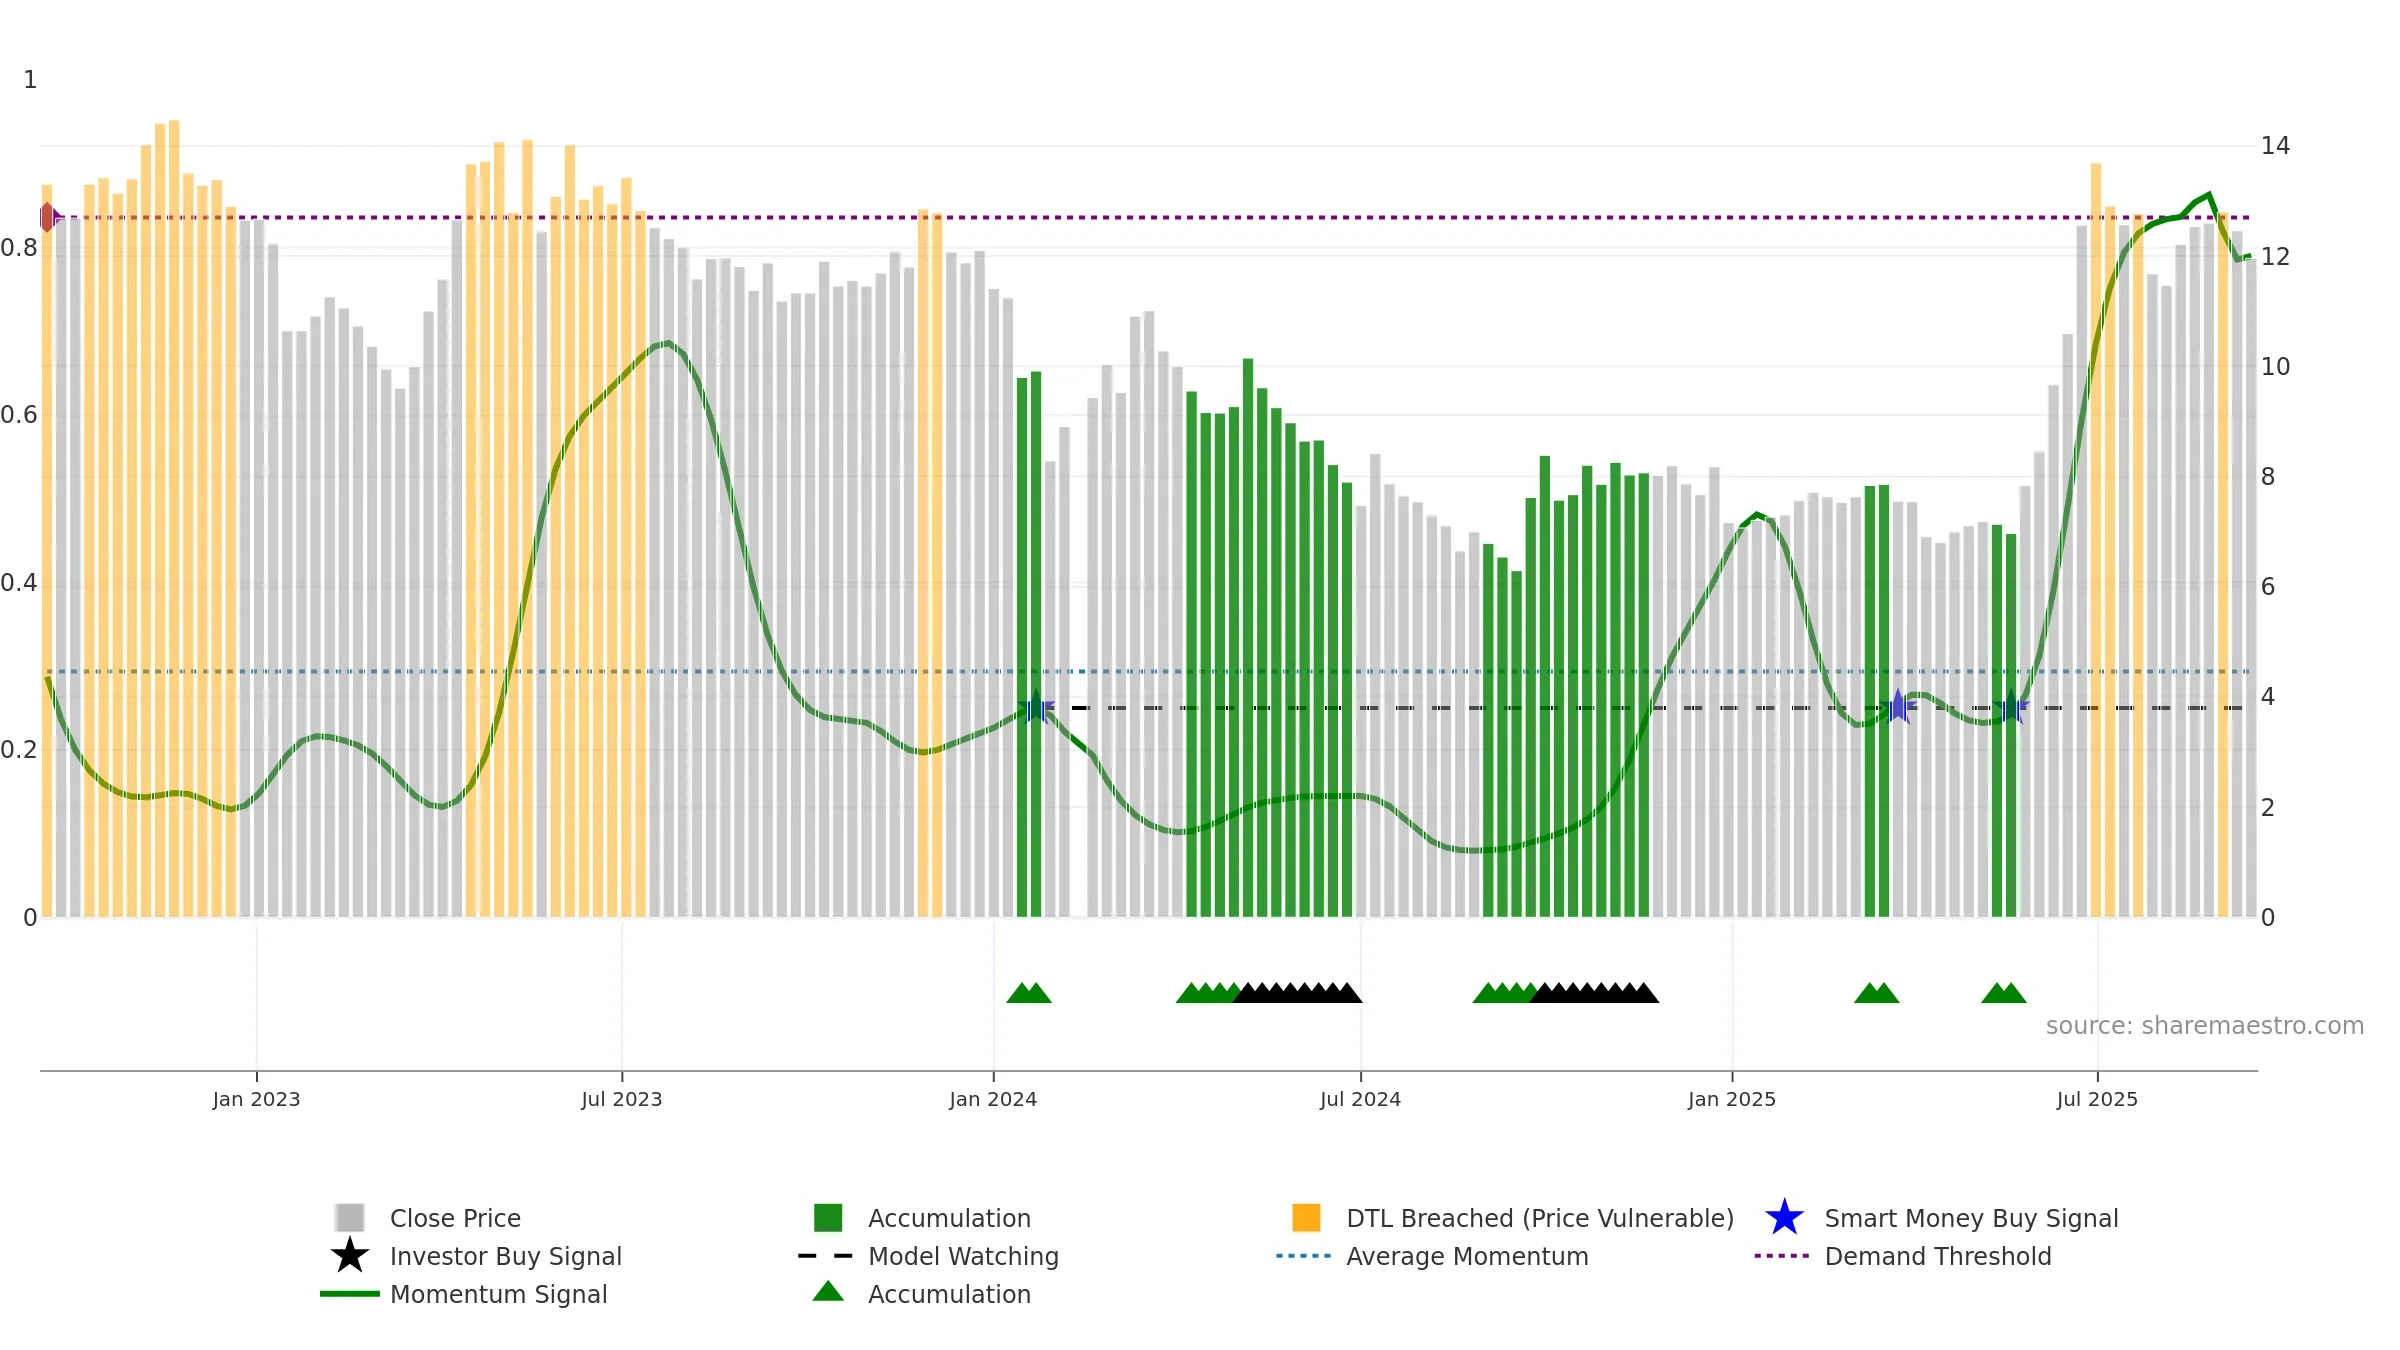
Weekly Report
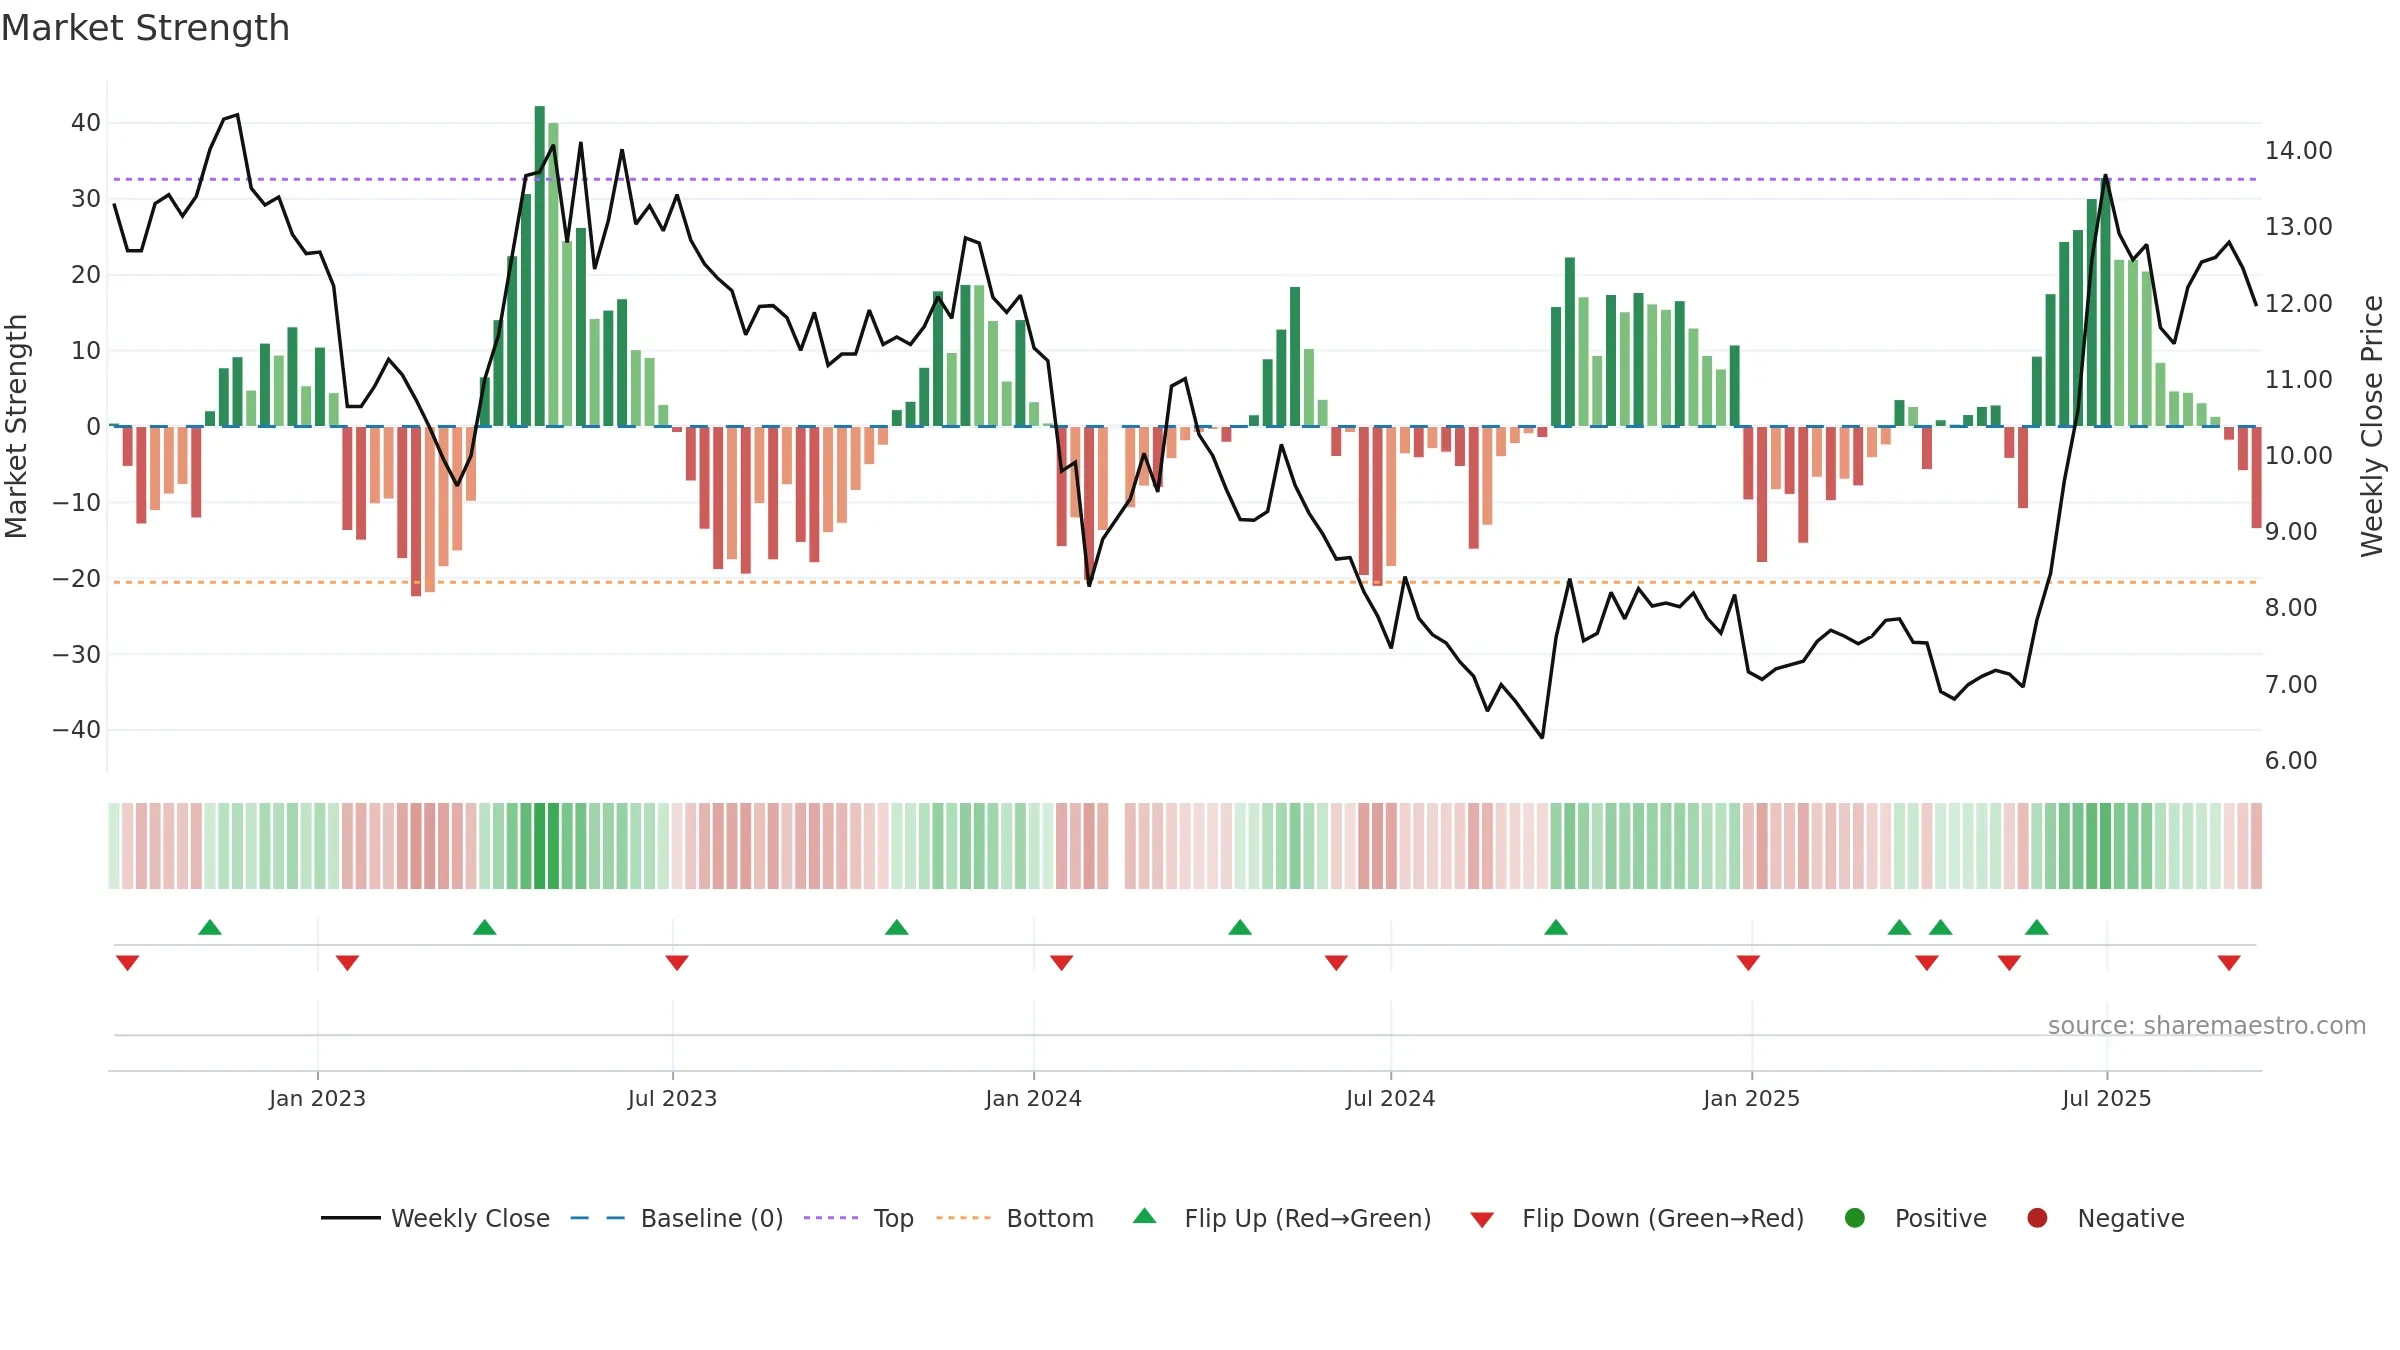
GCL Energy Technology Co.,Ltd. closed at 11.9600 (-0.99% WoW) . Data window ends Mon, 15 Sep 2025.
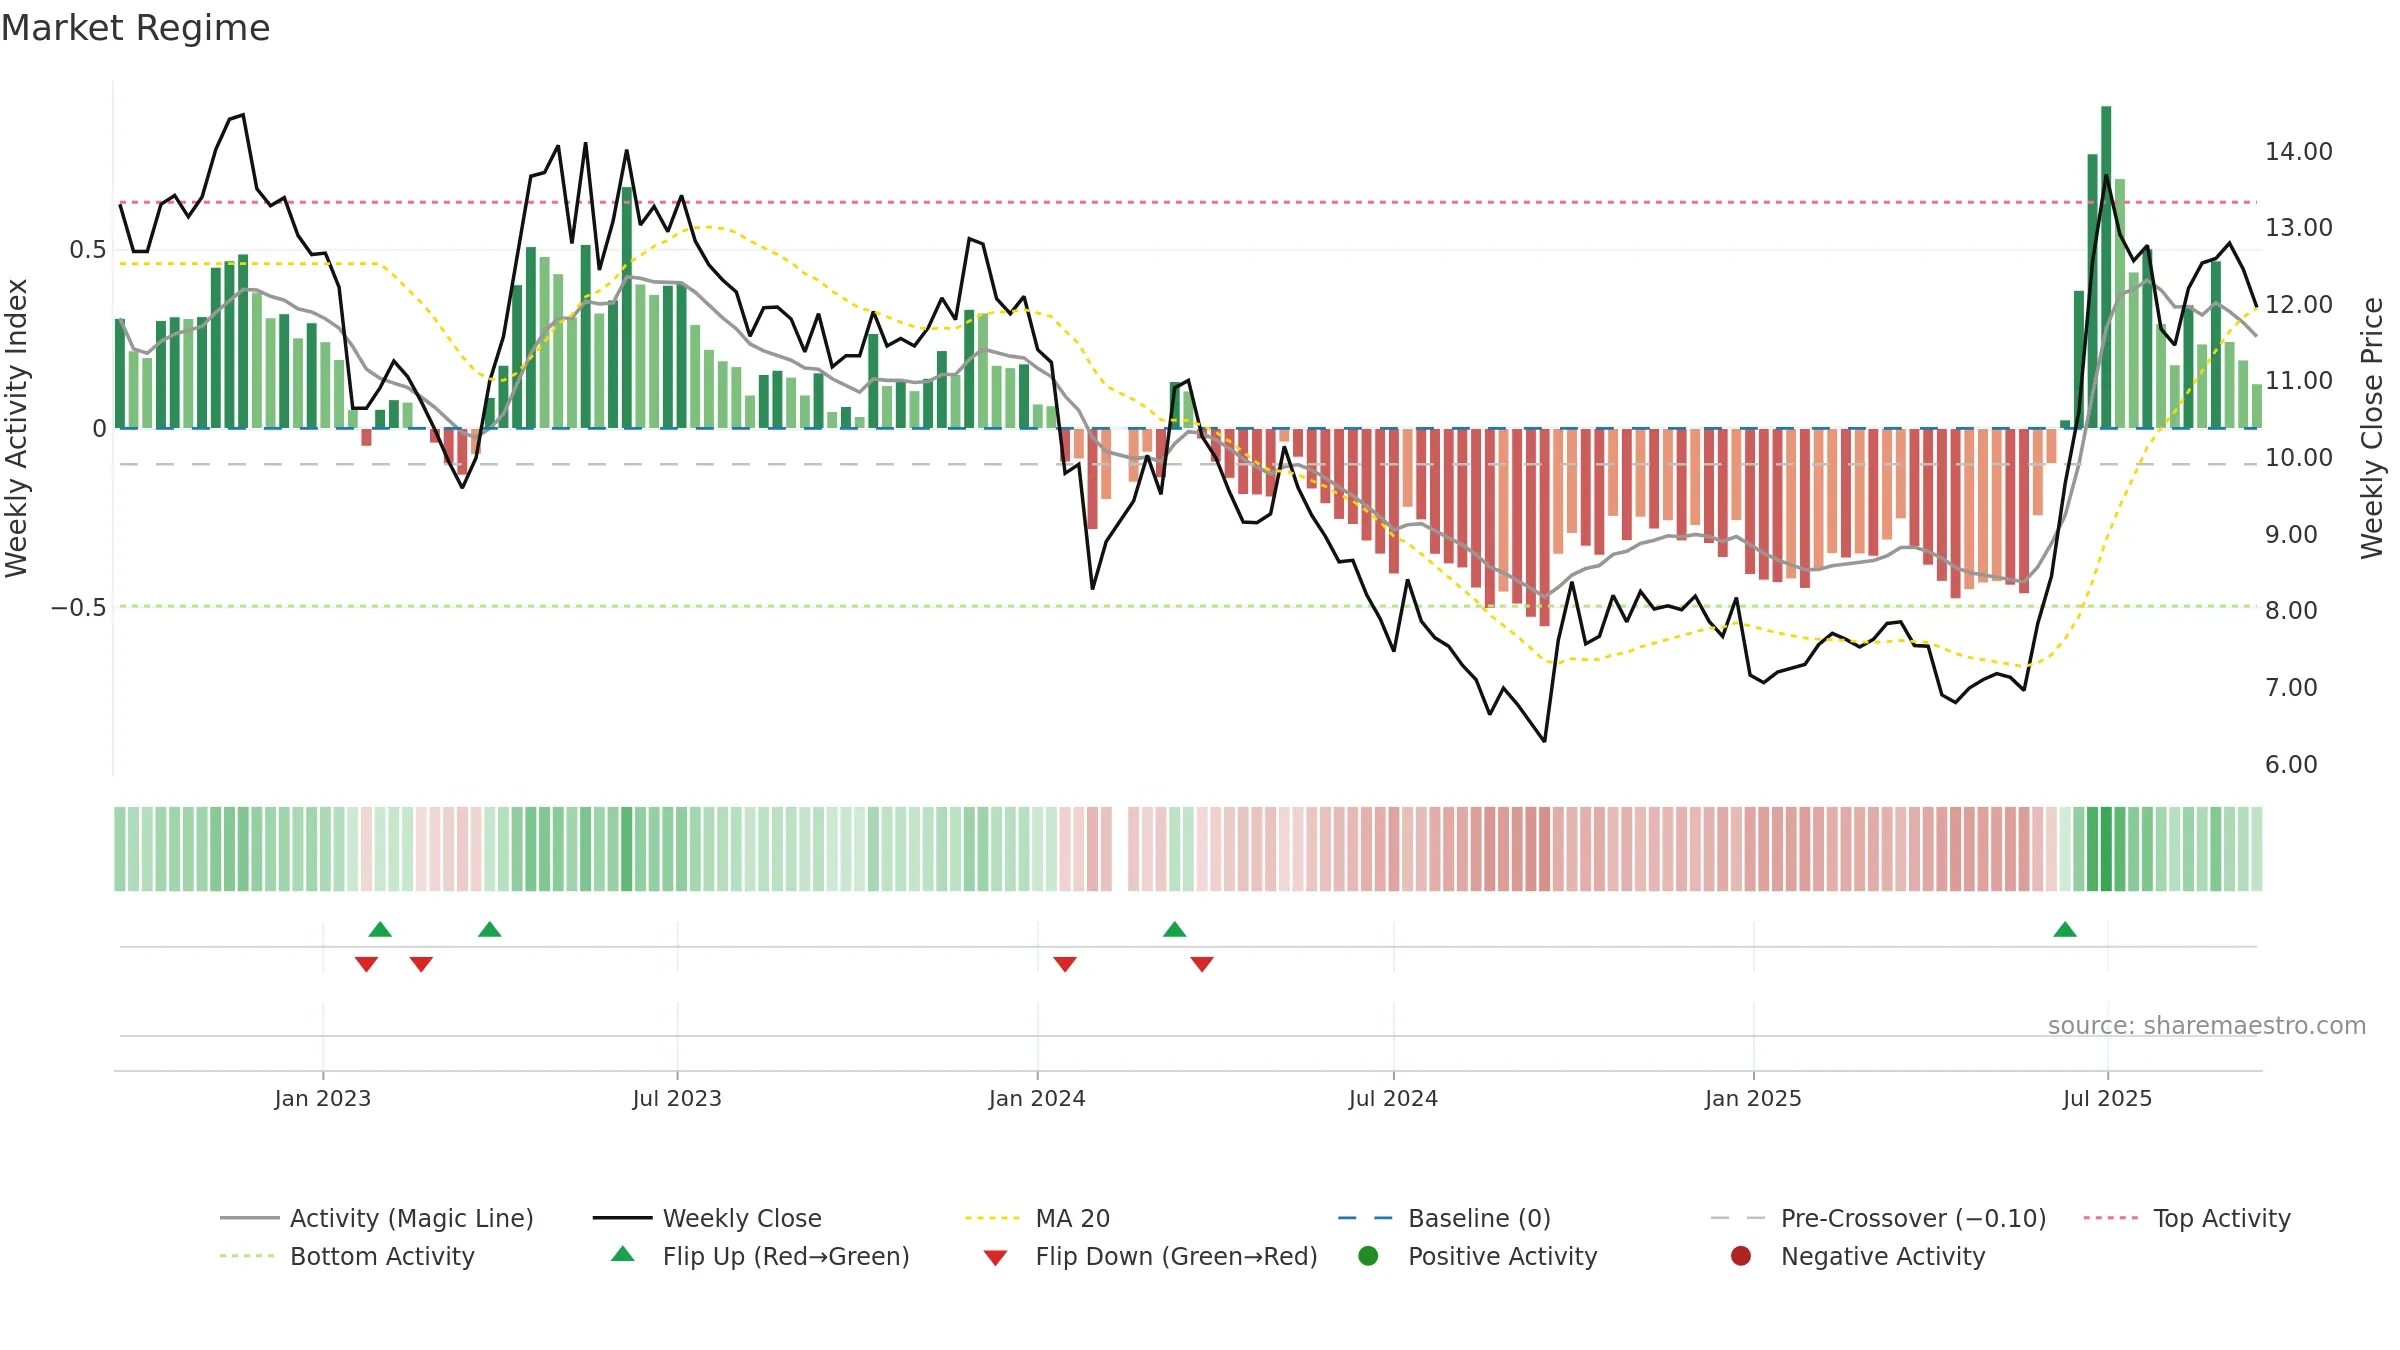
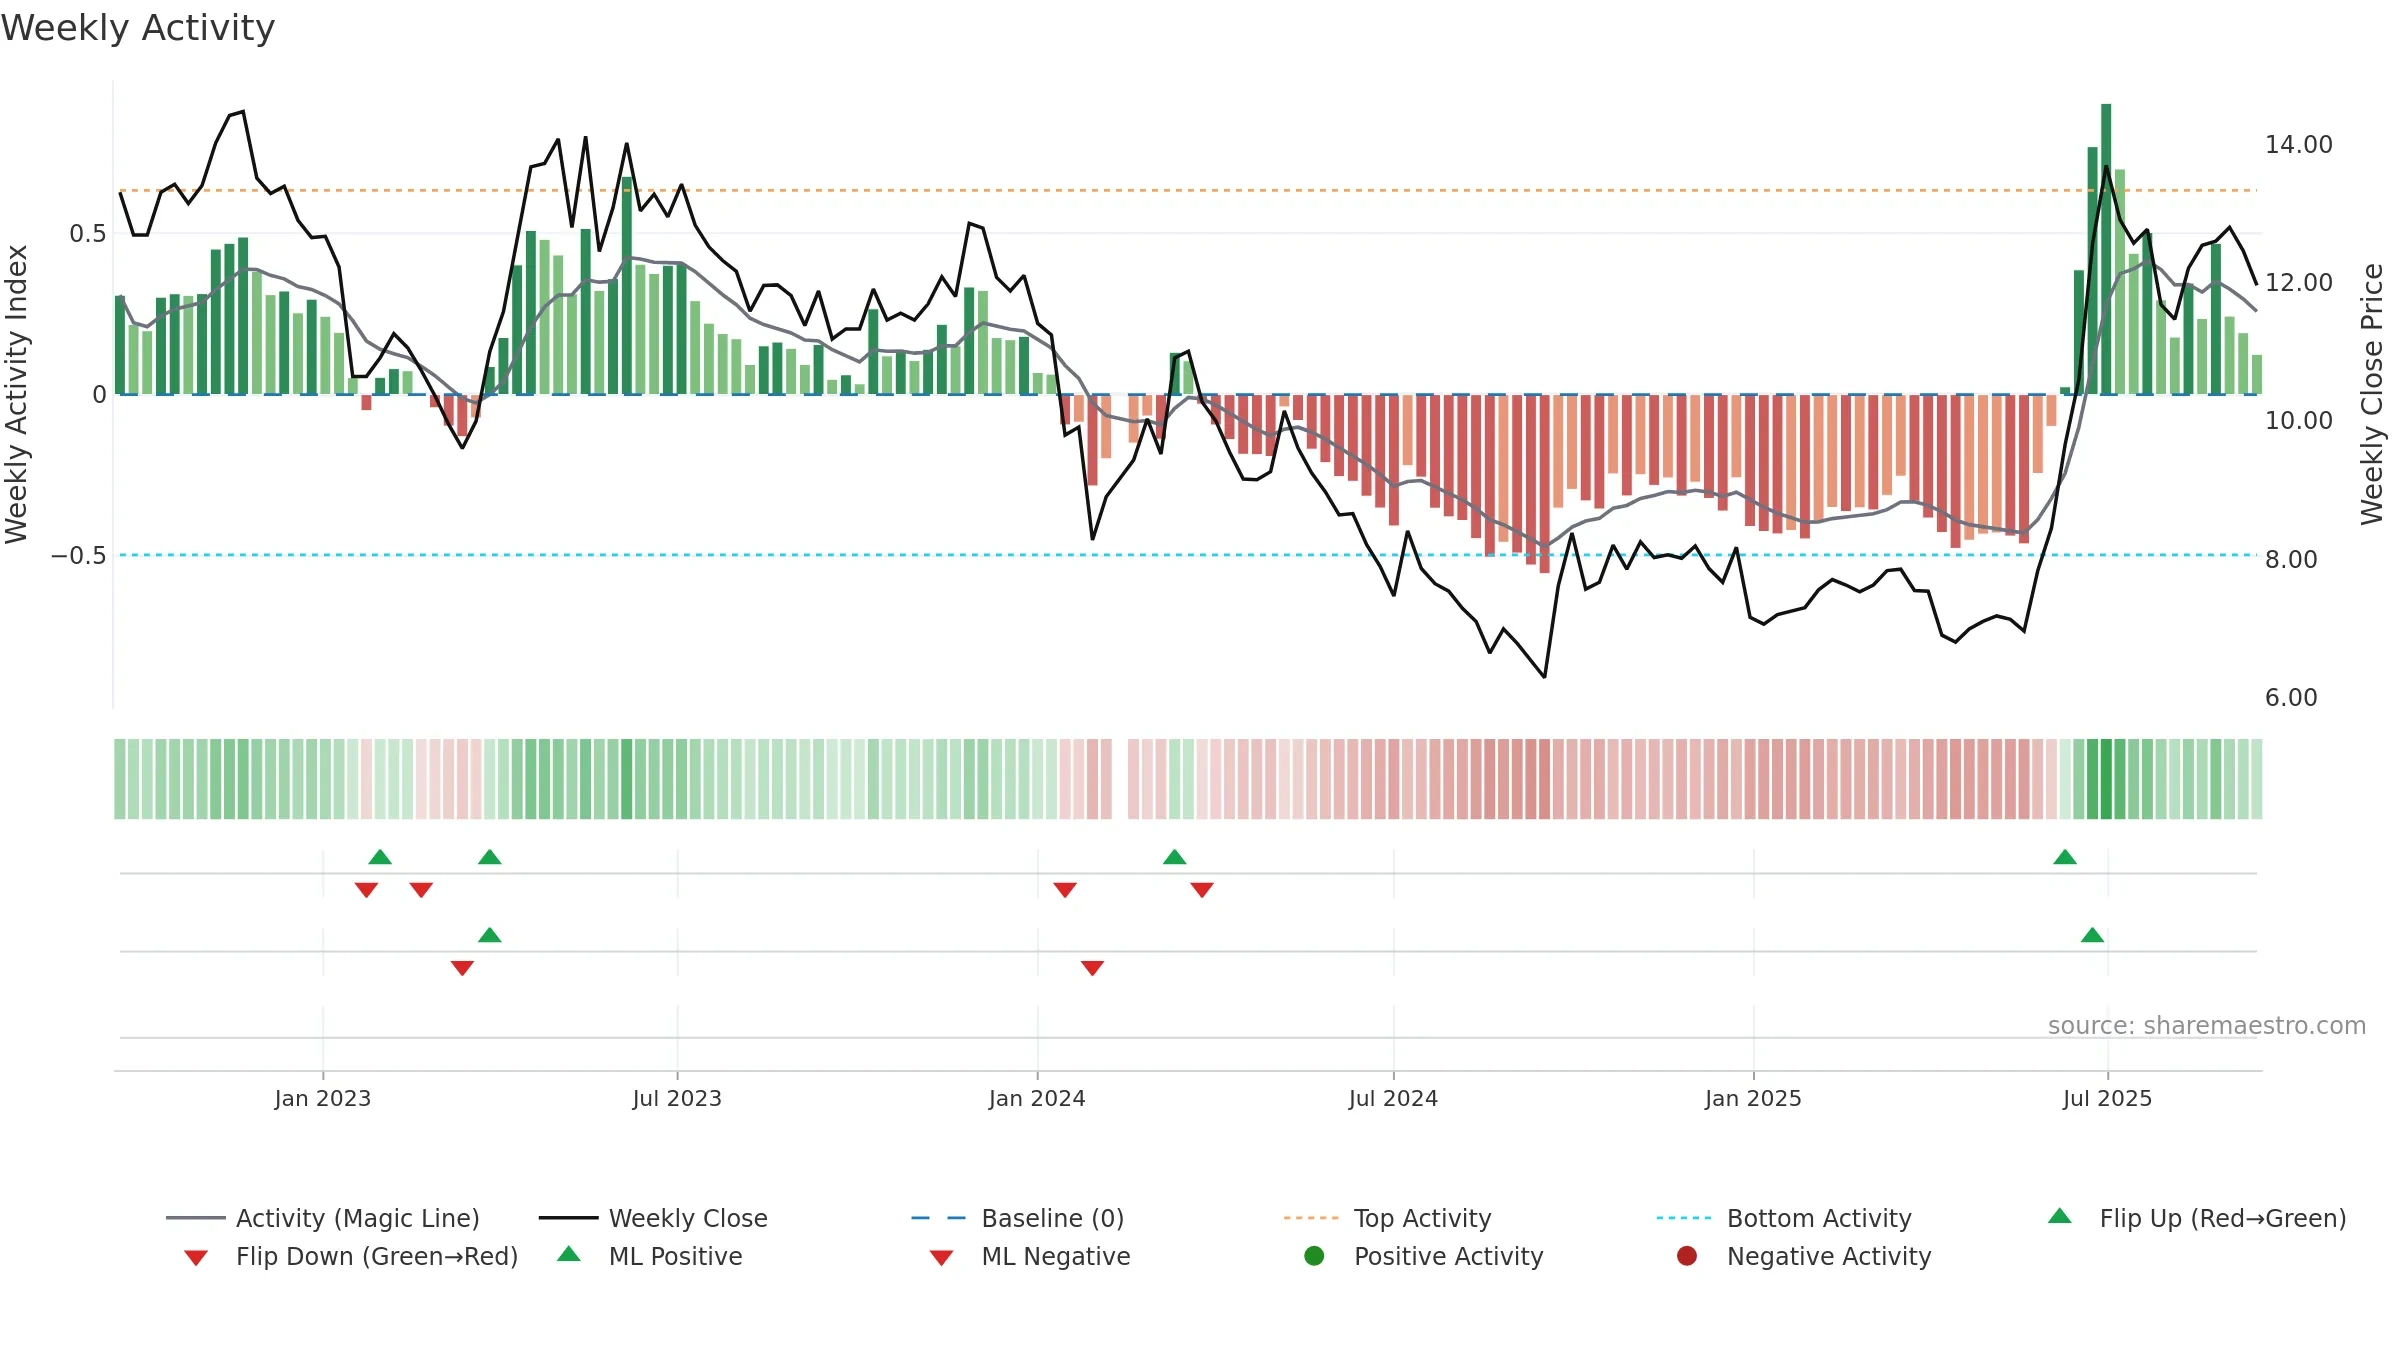
How to read this — Price slope is upward, indicating persistent buying over the window. Elevated weekly volatility increases whipsaw risk. Volume trend diverges from price — watch for fatigue or rotation.
Up-slope supports buying interest; pullbacks may be contained if activity stays firm. Because liquidity isn’t confirming, prefer evidence of fresh demand before chasing moves.
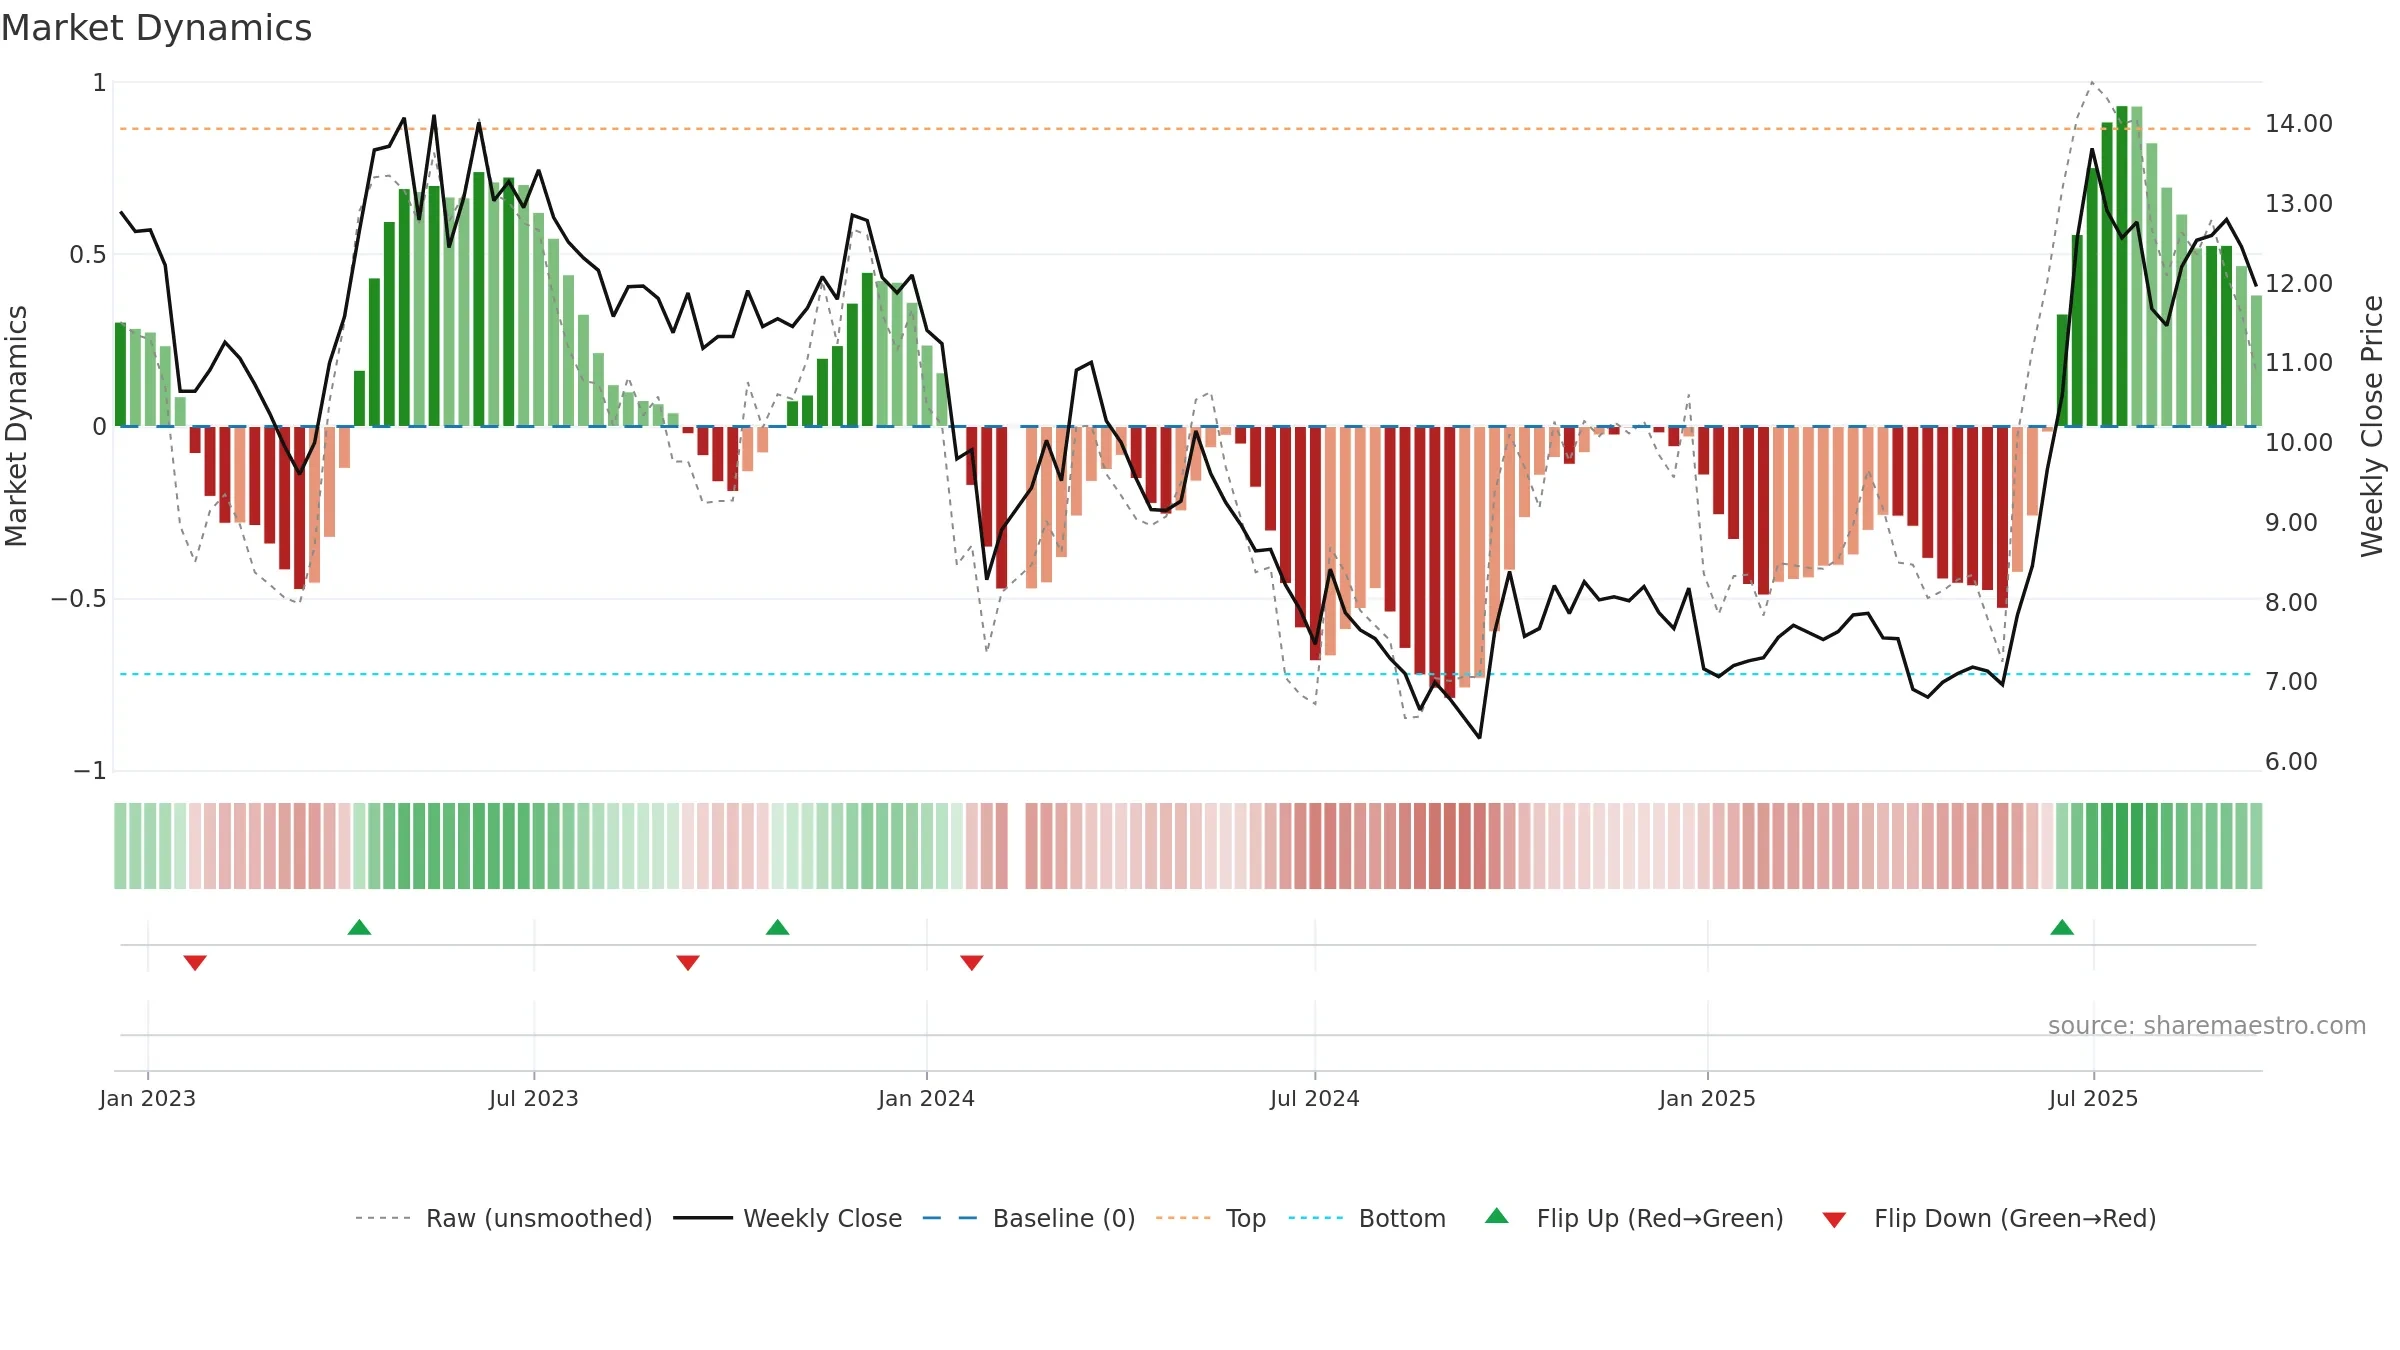
Gauge maps the trend signal to a 0–100 scale.
How to read this — Gauge is elevated but momentum is rolling over; topping risk is rising. Notable breakdown from ≥0.80 weakens trend quality.
Stay alert: protect gains or seek confirmation before adding risk.
The flag is positive: favourable upside skew with supportive conditions.
Conclusion
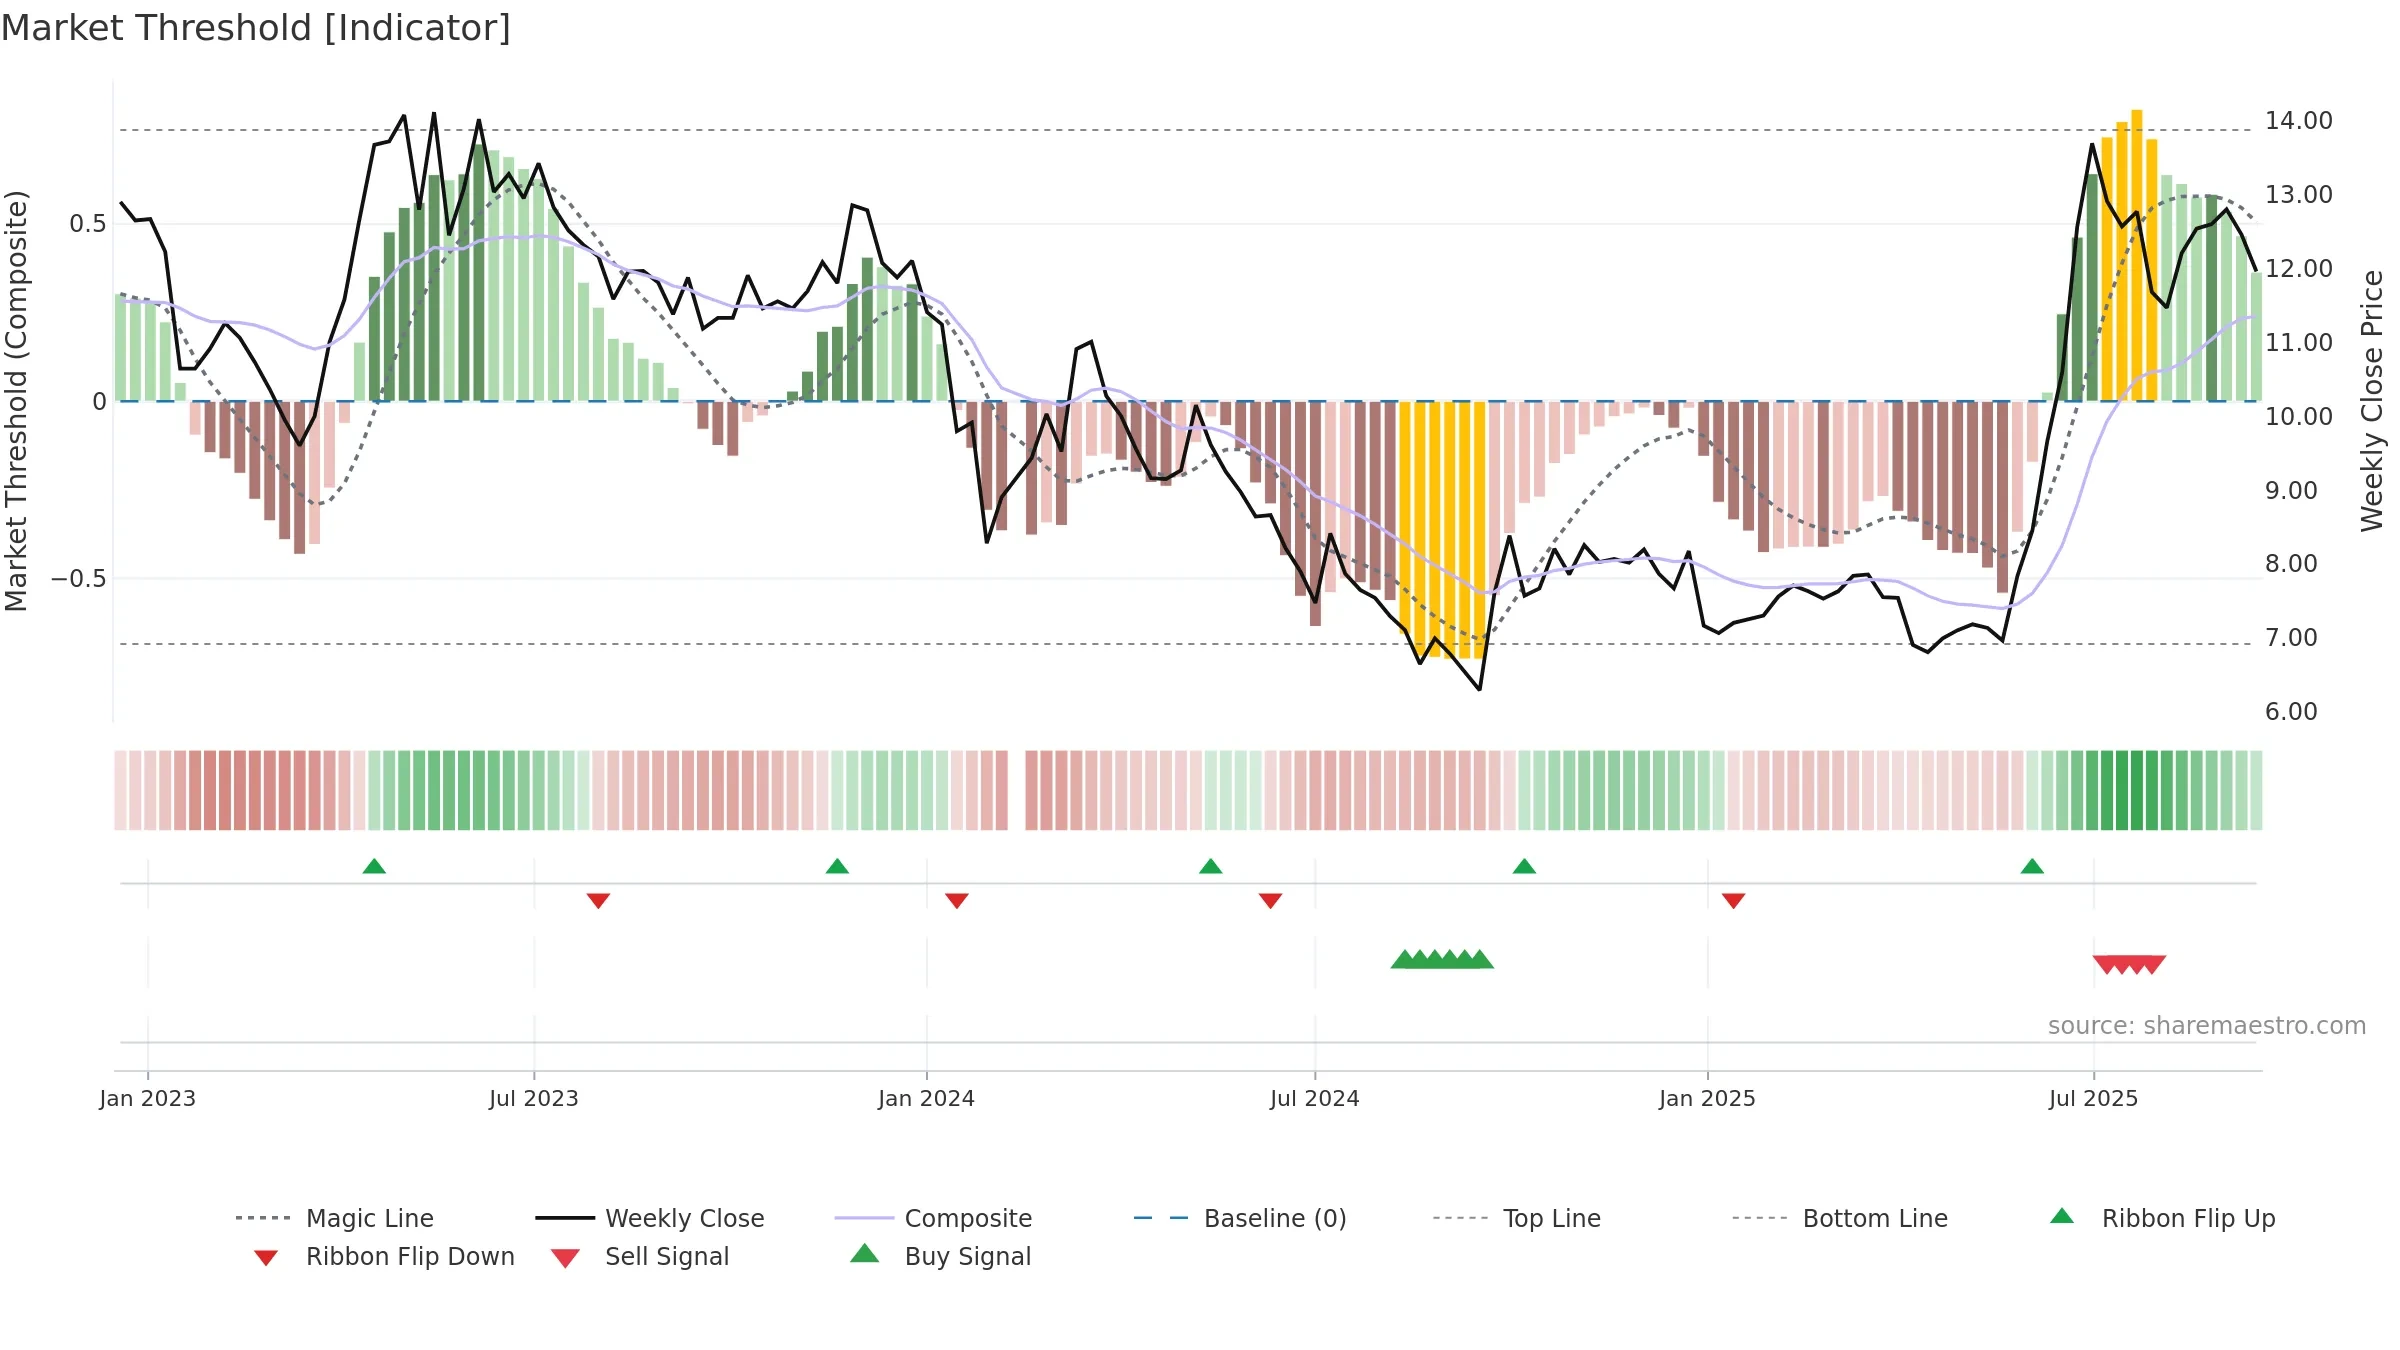
Negative setup. ★★☆☆☆ confidence. Price window: 2. Trend: Uptrend at Risk; gauge 79. In combination, liquidity diverges from price.
- High-level but rolling over (topping risk)
- Momentum is weak/falling
- Price is not above key averages
- Liquidity diverges from price
Why: Price window 2.40% over 8w. Close is -6.56% below the prior-window high. Return volatility 4.01%. Volume trend falling. Liquidity divergence with price. Trend state uptrend at risk. High-regime (0.80–1.00) downticks 2/6 (33.0%) • Accumulating. Momentum neutral and falling. Valuation stance positive.
Tip: Most metrics include a hover tooltip where they appear in the report.